| Param | Original file | Final file |
|---|---|---|
| Filename | modeM0/AS1A05_013T01_9000002944_19728cztM0_level2.evt | modeM0/AS1A05_013T01_9000002944_19728cztM0_level2_quad_clean.evt |
| Size (bytes) | 448,081,920 | 93,778,560 |
| Size | 427.3 MB | 89.4 MB |
| Events in quadrant A | 3,005,834 | 617,442 |
| Events in quadrant B | 3,237,524 | 636,606 |
| Events in quadrant C | 3,320,507 | 599,259 |
| Events in quadrant D | 3,597,968 | 566,750 |
| Mode SS | |||
|---|---|---|---|
| Quadrant | BADHDUFLAG | Total packets | Discarded packets |
| A | 0 | 122 | 0 |
| B | 0 | 122 | 0 |
| C | 0 | 122 | 0 |
| D | 0 | 122 | 0 |
| Mode M0 | |||
|---|---|---|---|
| Quadrant | BADHDUFLAG | Total packets | Discarded packets |
| A | 0 | 12607 | 2 |
| B | 0 | 13282 | 2 |
| C | 0 | 13519 | 2 |
| D | 0 | 14627 | 2 |
| Mode M9 | |||
|---|---|---|---|
| Quadrant | BADHDUFLAG | Total packets | Discarded packets |
| A | 0 | 21 | 0 |
| B | 0 | 22 | 0 |
| C | 0 | 22 | 0 |
| D | 0 | 22 | 0 |
| Quadrant | Total seconds | Saturated seconds | Saturation percentage |
|---|---|---|---|
| A | 6014 | 26 | 0.432325% |
| B | 6014 | 64 | 1.064184% |
| C | 6014 | 67 | 1.114067% |
| D | 6014 | 145 | 2.411041% |
Noise dominated data is calculated using 1-second bins in cleaned event files. If a bin has >2000 counts, and if more than 50% of those come from <1% of pixels, then it is considered to be noise-dominated and hence unusable.
| Quadrant | # 1 sec bins | Bins with >0 counts | Bins with >2000 counts | High rate bins dominated by noise | Noise dominated (total time) | Noise dominated (detector-on time) | Marked lightcurve |
|---|---|---|---|---|---|---|---|
| A | 7394 | 6015 | 0 | 0 | 0.00% | 0.00% | 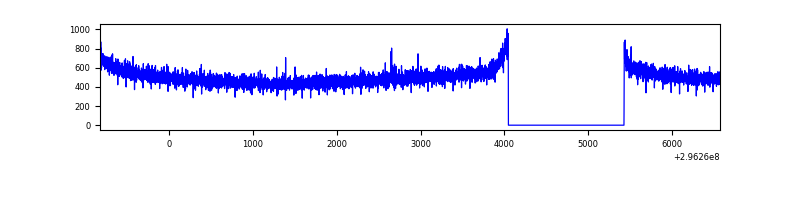 |
| B | 7394 | 6015 | 10 | 10 | 0.14% | 0.17% | 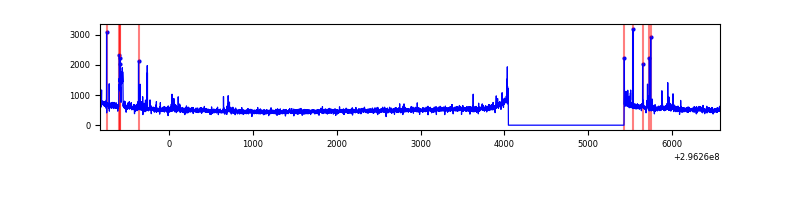 |
| C | 7394 | 6015 | 1 | 1 | 0.01% | 0.02% | 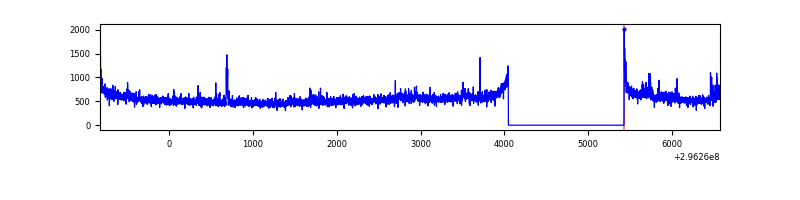 |
| D | 7394 | 6015 | 97 | 97 | 1.31% | 1.61% | 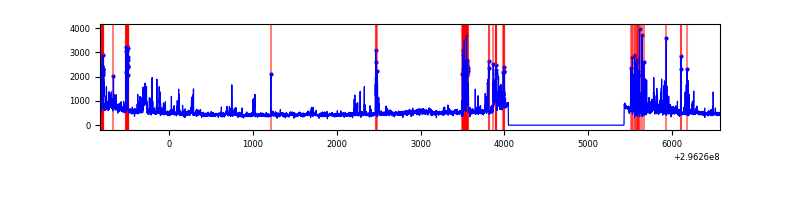 |
Top three noisy pixels from each quadrant. If the there are fewer than three noisy pixels in the level2.evt file, extra rows are filled as -1
| Pixel properties | Quadrant properties | ||||||
|---|---|---|---|---|---|---|---|
| Quadrant | DetID | PixID | Counts | Sigma | Mean | Median | Sigma |
| A | 0 | 226 | 6766 | 38.08 | 780 | 766 | 157.6 |
| A | 13 | 254 | 5948 | 32.89 | 780 | 766 | 157.6 |
| A | 3 | 137 | 5919 | 32.71 | 780 | 766 | 157.6 |
| B | 3 | 64 | 53125 | 355.69 | 791 | 774 | 147.2 |
| B | 7 | 220 | 32428 | 215.07 | 791 | 774 | 147.2 |
| B | 0 | 197 | 18704 | 121.82 | 791 | 774 | 147.2 |
| C | 3 | 233 | 219736 | 1269.08 | 755 | 763 | 172.5 |
| C | 14 | 238 | 120541 | 694.19 | 755 | 763 | 172.5 |
| C | 7 | 247 | 30790 | 174.02 | 755 | 763 | 172.5 |
| D | 1 | 52 | 539013 | 2957.45 | 747 | 724 | 182.0 |
| D | 10 | 199 | 98525 | 537.33 | 747 | 724 | 182.0 |
| D | 7 | 238 | 59242 | 321.51 | 747 | 724 | 182.0 |
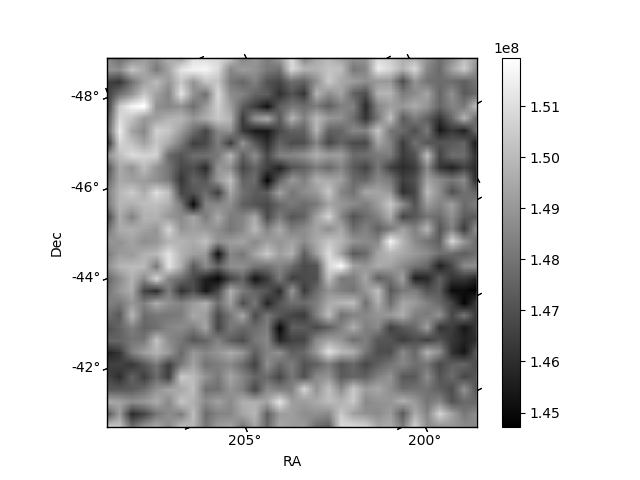
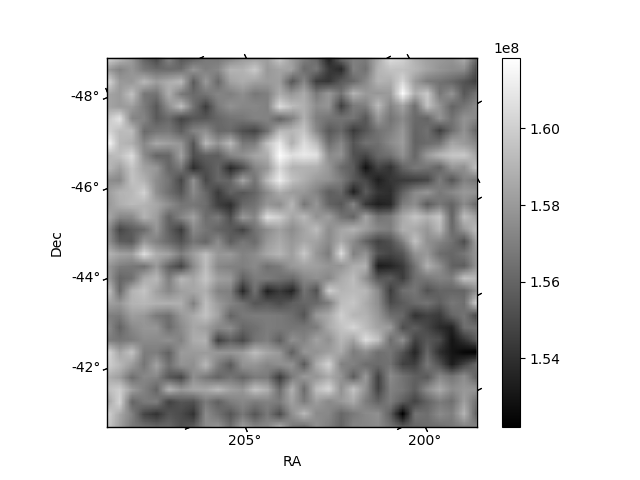
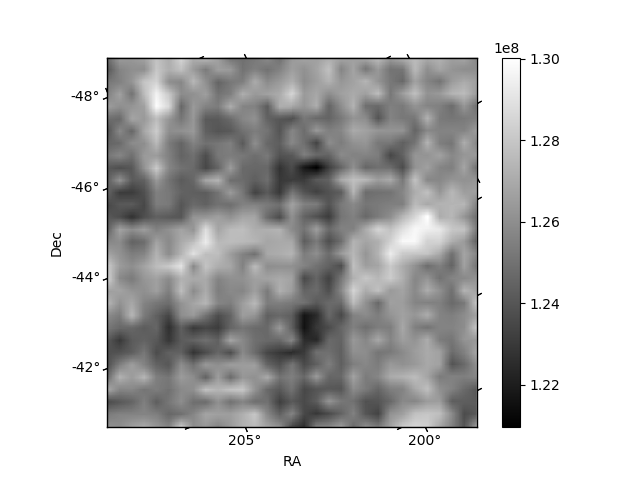
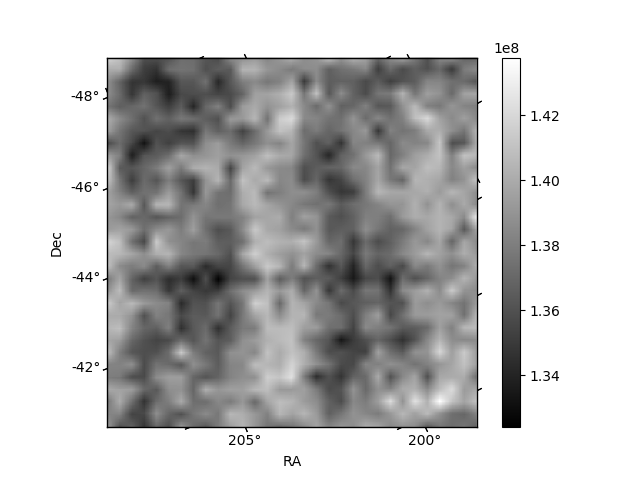
Histogram calculated using DETX and DETY for each event in the final _common_clean file
| Quadrant A | 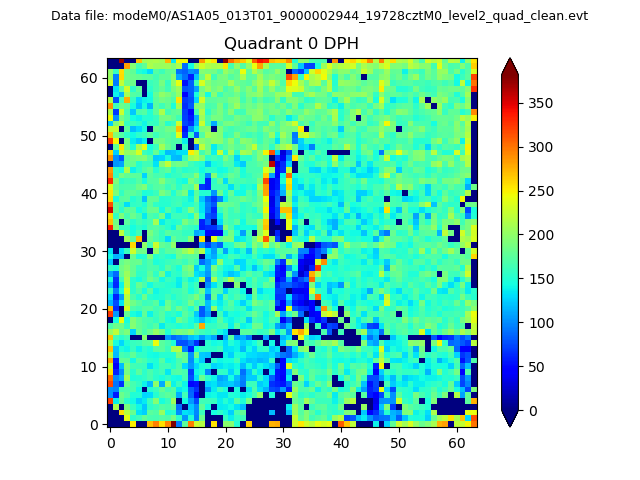 |
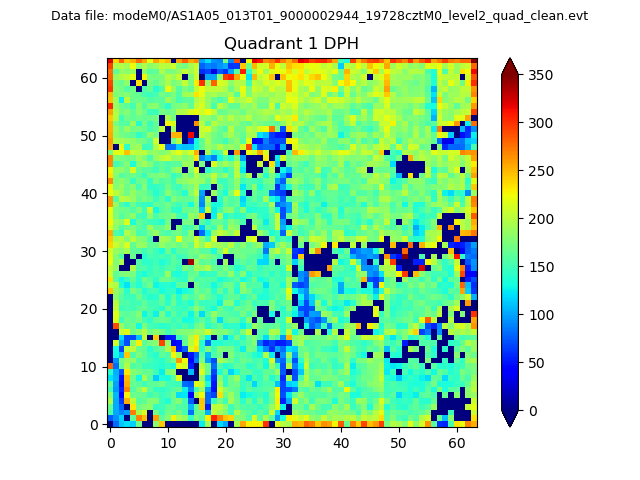 |
Quadrant B |
|---|---|---|---|
| Quadrant D | 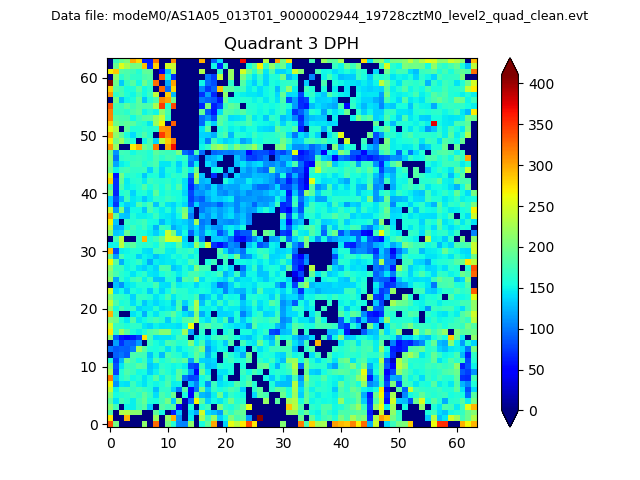 |
 |
Quadrant C |
| Plot type | Count rate plots | Images |
|---|---|---|
| Comparison with Poisson distribution Blue bars denote a histogram of data divided into 1 sec bins. Red curve is a Poisson curve with rate = median count rate of data. |
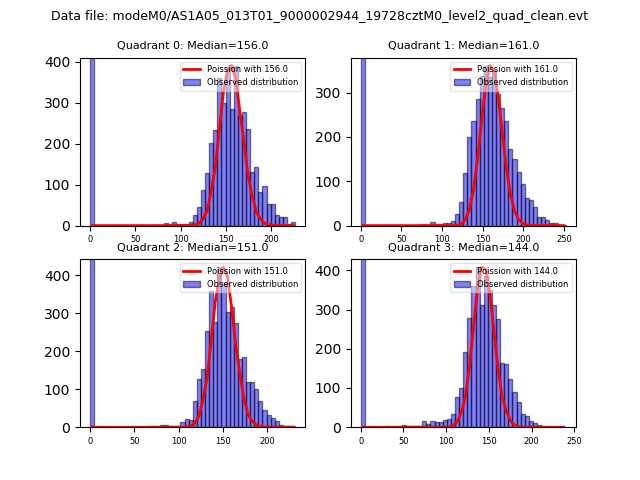 |
 |
| Quadrant-wise count rates Data is divided into 100 sec bins |
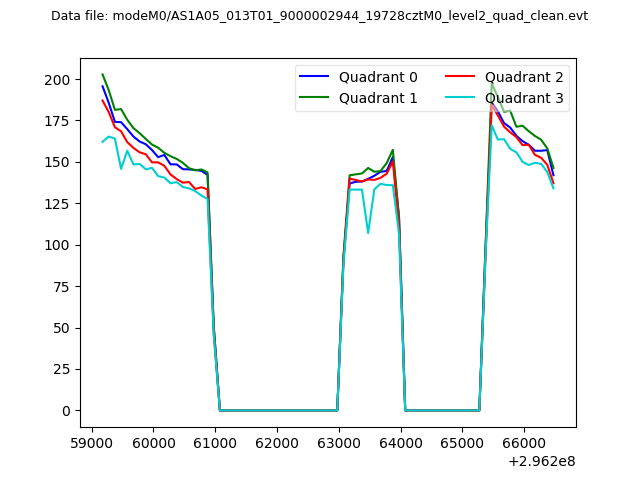 |
|
| Module-wise count rates for Quadrant A Data is divided into 100 sec bins |
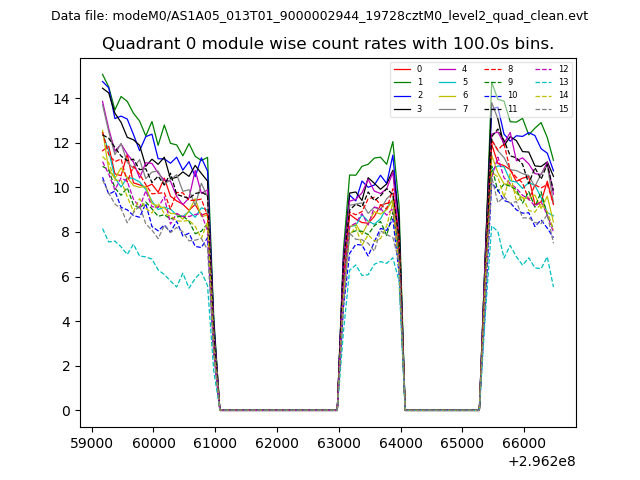 |
 |
| Module-wise count rates for Quadrant B Data is divided into 100 sec bins |
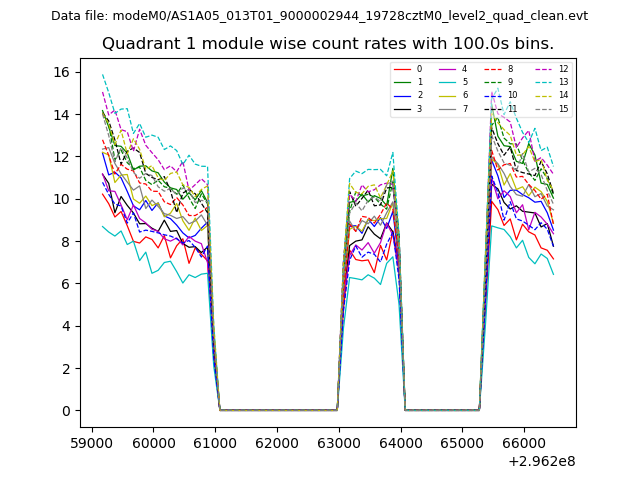 |
 |
| Module-wise count rates for Quadrant C Data is divided into 100 sec bins |
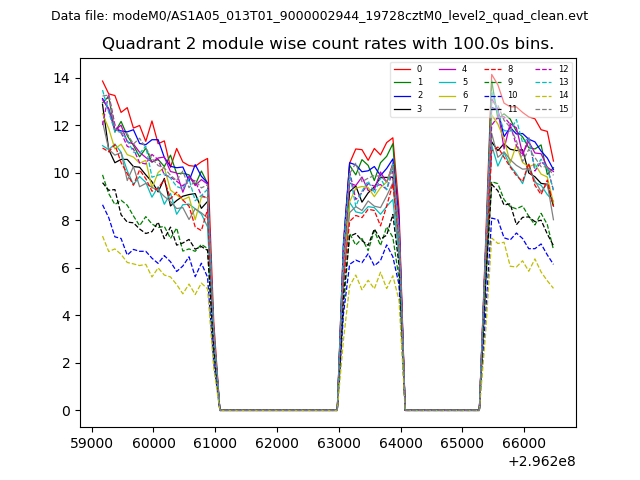 |
 |
| Module-wise count rates for Quadrant D Data is divided into 100 sec bins |
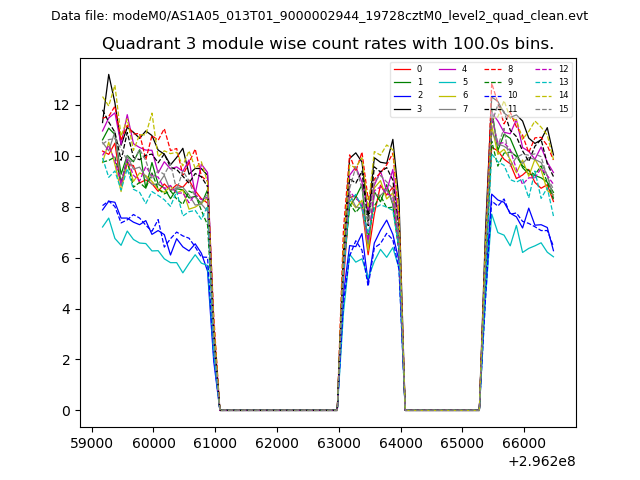 |
 |
| Parameter | Plot |
|---|---|
| CZT HV Monitor | 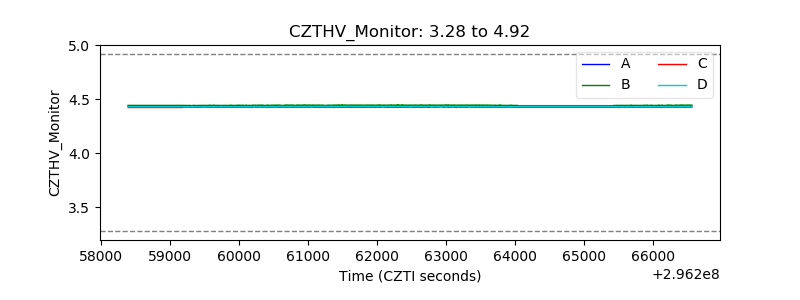 |
| D_VDD | 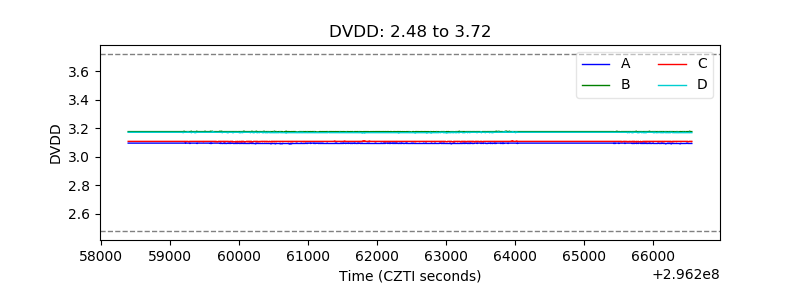 |
| Temperature 1 | 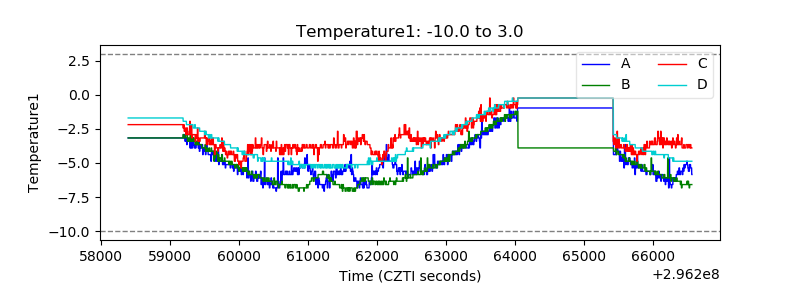 |
| Veto HV Monitor | 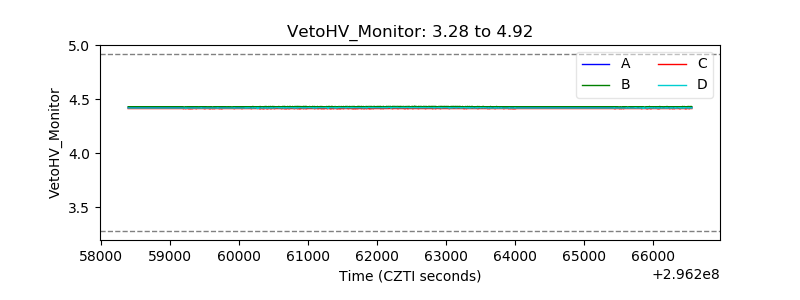 |
| Veto LLD | 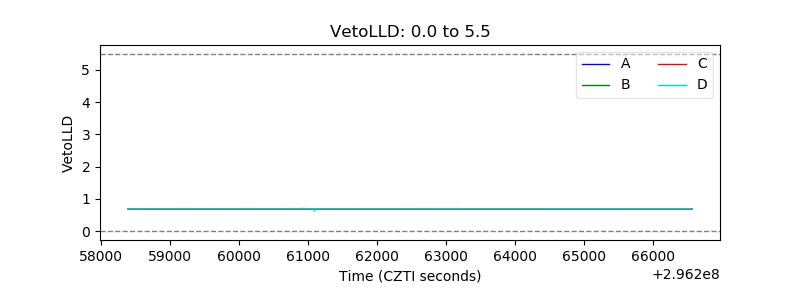 |
| Alpha Counter | 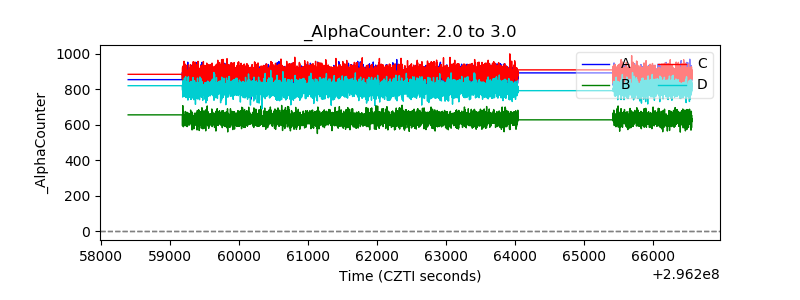 |
| _CPM_Rate | 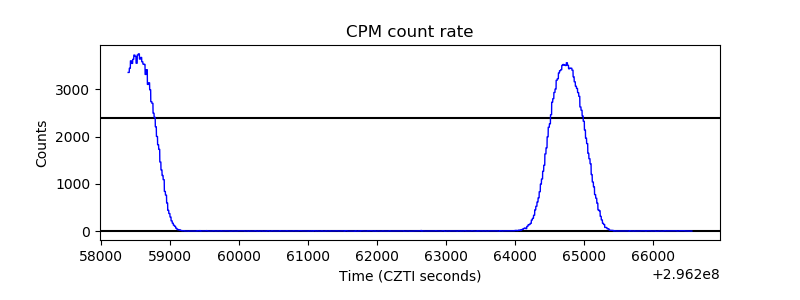 |
| CZT Counter |  |
| +2.5 Volts monitor |  |
| +5 Volts monitor | 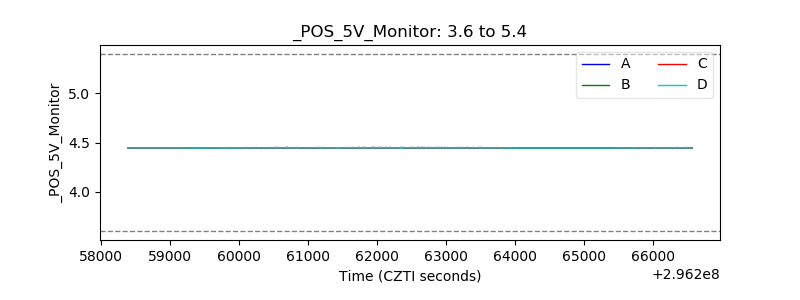 |
| _ROLL_ROT | 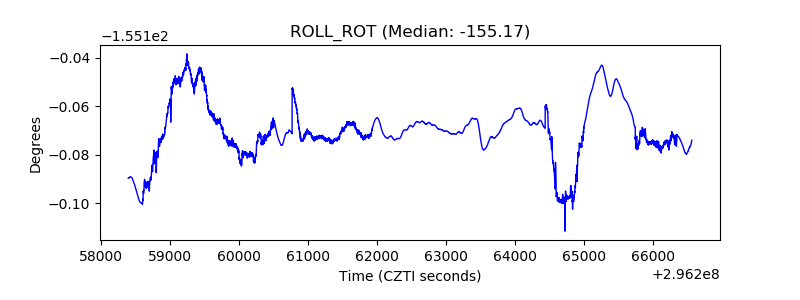 |
| _Roll_DEC | 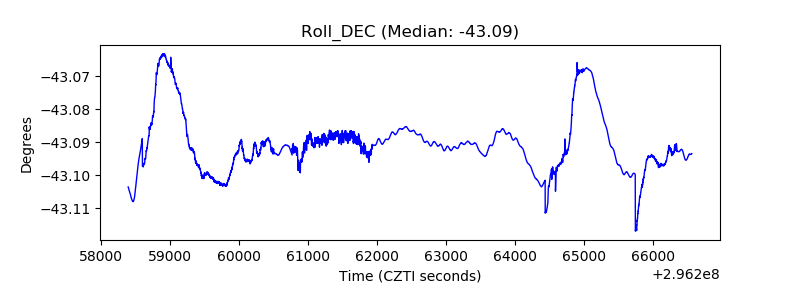 |
| _Roll_RA |  |
| Veto Counter | 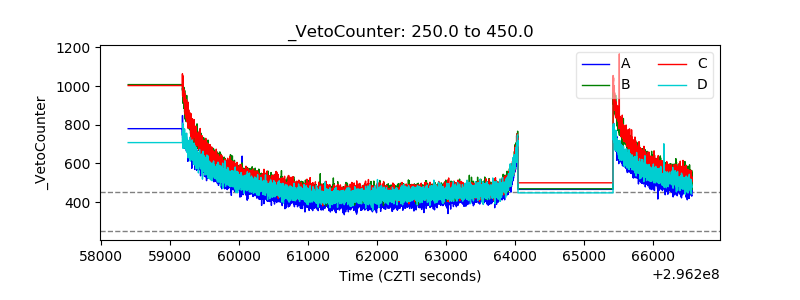 |