| Param | Original file | Final file |
|---|---|---|
| Filename | modeM0/AS1A05_013T01_9000002944_19729cztM0_level2.evt | modeM0/AS1A05_013T01_9000002944_19729cztM0_level2_quad_clean.evt |
| Size (bytes) | 455,734,080 | 90,227,520 |
| Size | 434.6 MB | 86.0 MB |
| Events in quadrant A | 2,998,760 | 567,521 |
| Events in quadrant B | 3,309,923 | 611,924 |
| Events in quadrant C | 3,500,247 | 577,097 |
| Events in quadrant D | 3,577,757 | 548,862 |
| Mode SS | |||
|---|---|---|---|
| Quadrant | BADHDUFLAG | Total packets | Discarded packets |
| A | 0 | 124 | 0 |
| B | 0 | 124 | 0 |
| C | 0 | 124 | 0 |
| D | 0 | 124 | 0 |
| Mode M0 | |||
|---|---|---|---|
| Quadrant | BADHDUFLAG | Total packets | Discarded packets |
| A | 0 | 12832 | 298 |
| B | 0 | 13511 | 2 |
| C | 0 | 14286 | 2 |
| D | 0 | 14552 | 2 |
| Quadrant | Total seconds | Saturated seconds | Saturation percentage |
|---|---|---|---|
| A | 6008 | 19 | 0.316245% |
| B | 6154 | 67 | 1.088723% |
| C | 6154 | 68 | 1.104972% |
| D | 6154 | 102 | 1.657459% |
Noise dominated data is calculated using 1-second bins in cleaned event files. If a bin has >2000 counts, and if more than 50% of those come from <1% of pixels, then it is considered to be noise-dominated and hence unusable.
| Quadrant | # 1 sec bins | Bins with >0 counts | Bins with >2000 counts | High rate bins dominated by noise | Noise dominated (total time) | Noise dominated (detector-on time) | Marked lightcurve |
|---|---|---|---|---|---|---|---|
| A | 7549 | 6012 | 0 | 0 | 0.00% | 0.00% | 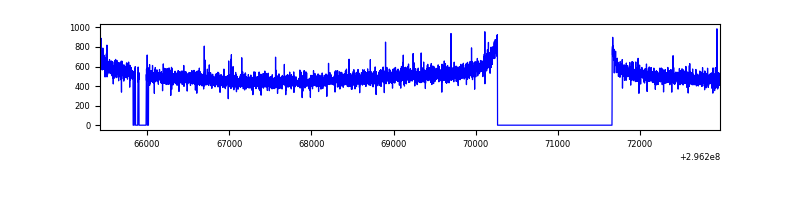 |
| B | 7549 | 6155 | 8 | 8 | 0.11% | 0.13% | 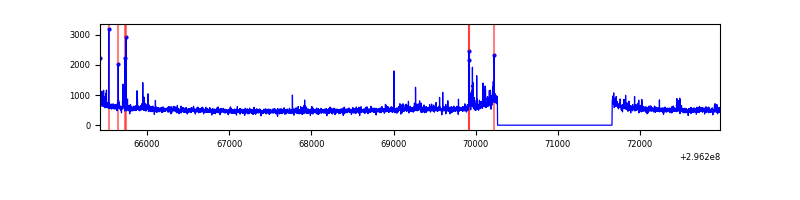 |
| C | 7549 | 6155 | 1 | 1 | 0.01% | 0.02% | 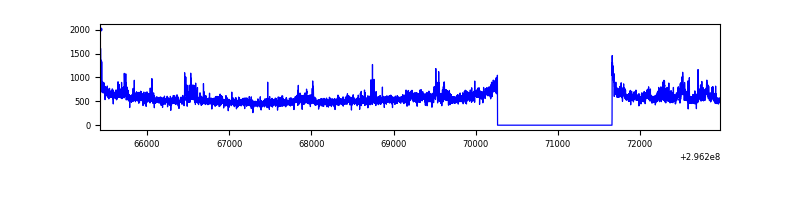 |
| D | 7549 | 6155 | 86 | 86 | 1.14% | 1.40% | 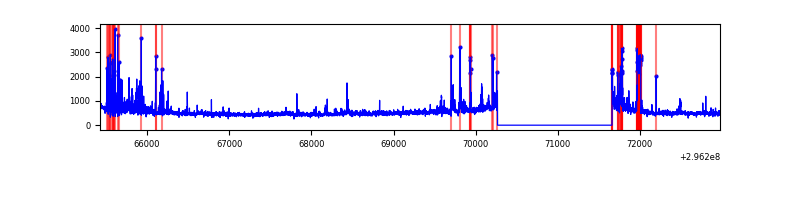 |
Top three noisy pixels from each quadrant. If the there are fewer than three noisy pixels in the level2.evt file, extra rows are filled as -1
| Pixel properties | Quadrant properties | ||||||
|---|---|---|---|---|---|---|---|
| Quadrant | DetID | PixID | Counts | Sigma | Mean | Median | Sigma |
| A | 0 | 226 | 6630 | 37.61 | 778 | 764 | 156.0 |
| A | 3 | 137 | 5881 | 32.81 | 778 | 764 | 156.0 |
| A | 12 | 194 | 5660 | 31.39 | 778 | 764 | 156.0 |
| B | 7 | 220 | 45106 | 293.52 | 808 | 791 | 151.0 |
| B | 4 | 216 | 38150 | 247.45 | 808 | 791 | 151.0 |
| B | 4 | 171 | 28120 | 181.02 | 808 | 791 | 151.0 |
| C | 3 | 233 | 347485 | 1954.69 | 774 | 782 | 177.4 |
| C | 14 | 238 | 124077 | 695.13 | 774 | 782 | 177.4 |
| C | 7 | 247 | 7889 | 40.07 | 774 | 782 | 177.4 |
| D | 1 | 52 | 332792 | 1784.9 | 768 | 748 | 186.0 |
| D | 7 | 38 | 106121 | 566.43 | 768 | 748 | 186.0 |
| D | 12 | 218 | 77242 | 411.19 | 768 | 748 | 186.0 |
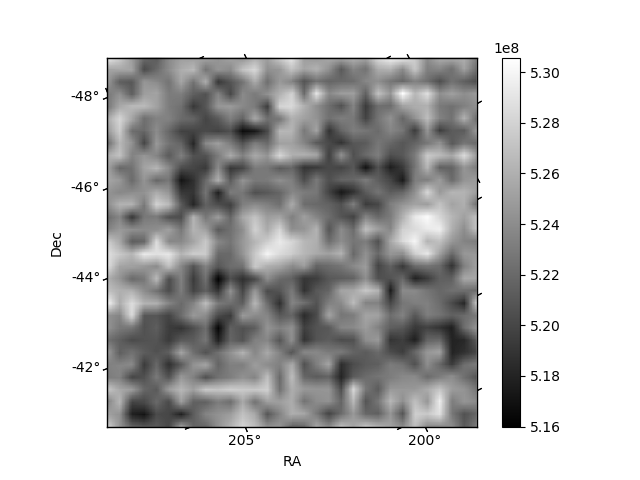
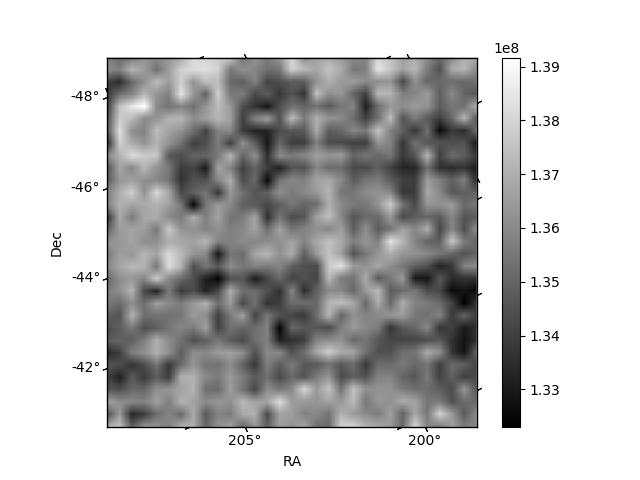
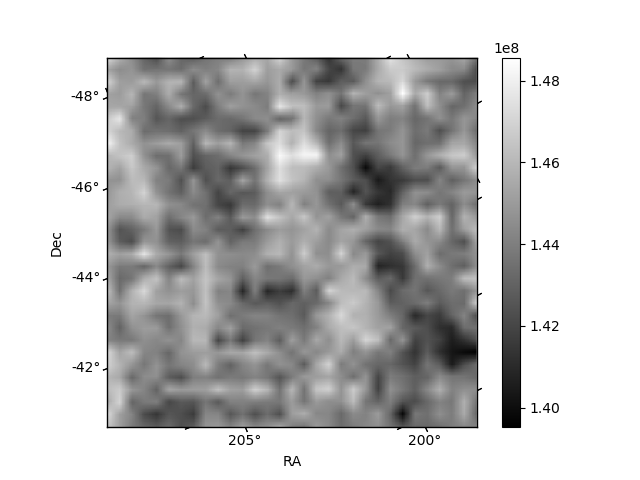
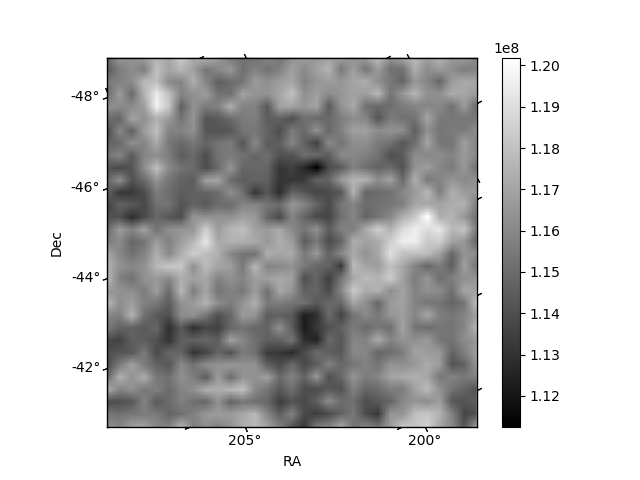
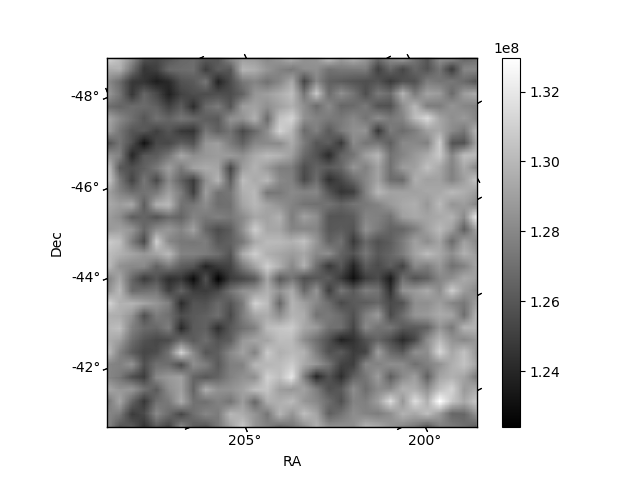
Histogram calculated using DETX and DETY for each event in the final _common_clean file
| Quadrant A | 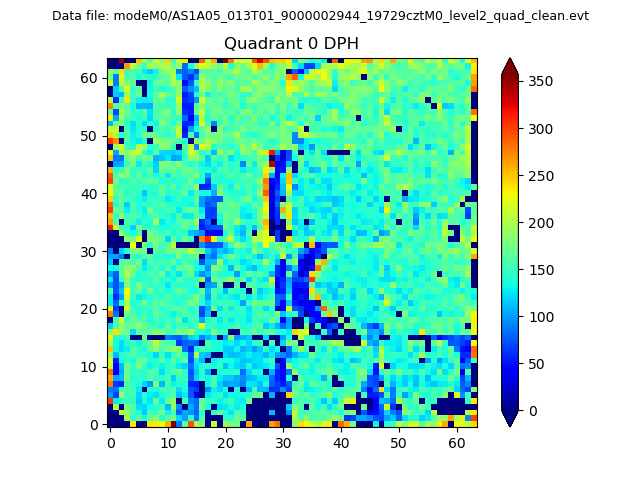 |
 |
Quadrant B |
|---|---|---|---|
| Quadrant D | 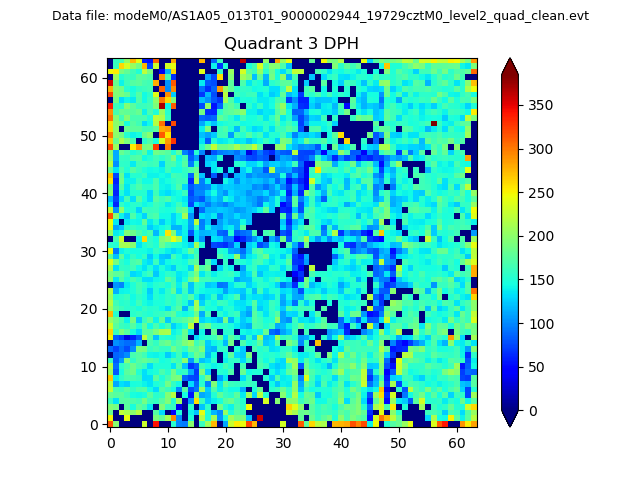 |
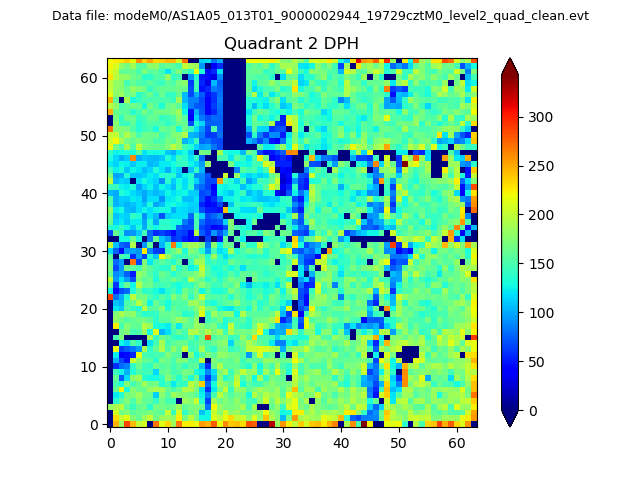 |
Quadrant C |
| Plot type | Count rate plots | Images |
|---|---|---|
| Comparison with Poisson distribution Blue bars denote a histogram of data divided into 1 sec bins. Red curve is a Poisson curve with rate = median count rate of data. |
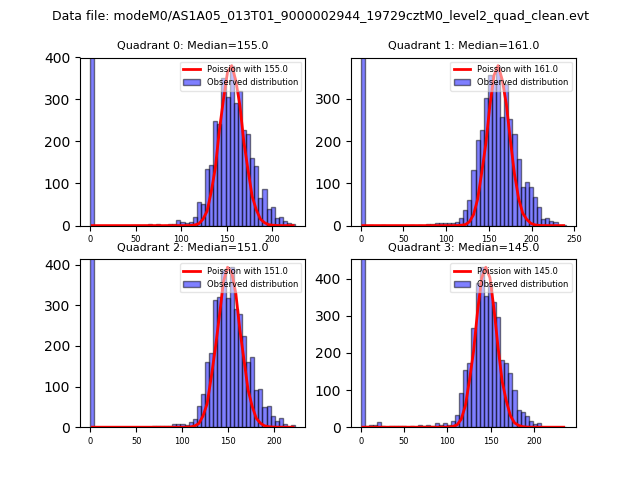 |
 |
| Quadrant-wise count rates Data is divided into 100 sec bins |
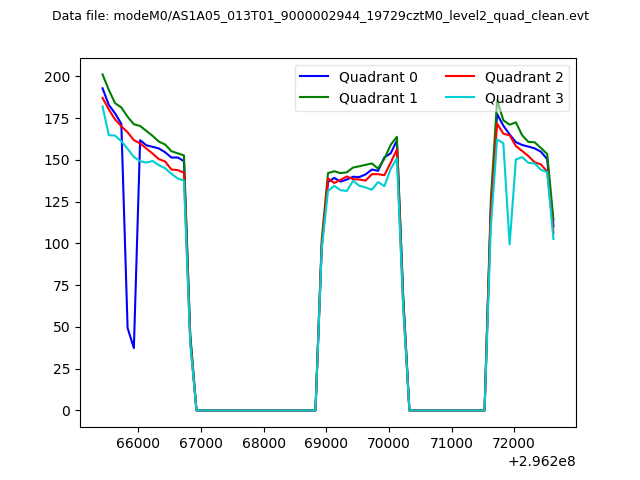 |
|
| Module-wise count rates for Quadrant A Data is divided into 100 sec bins |
 |
 |
| Module-wise count rates for Quadrant B Data is divided into 100 sec bins |
 |
 |
| Module-wise count rates for Quadrant C Data is divided into 100 sec bins |
 |
 |
| Module-wise count rates for Quadrant D Data is divided into 100 sec bins |
 |
 |
| Parameter | Plot |
|---|---|
| CZT HV Monitor |  |
| D_VDD | 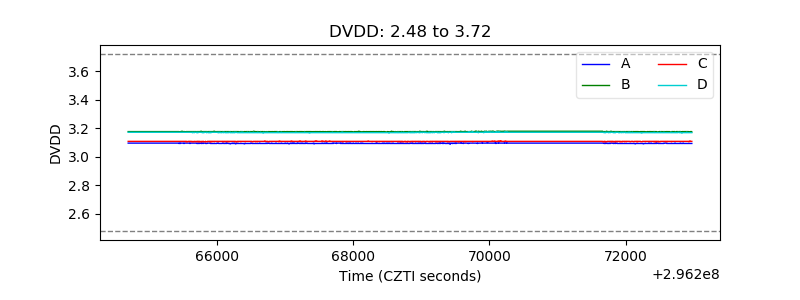 |
| Temperature 1 | 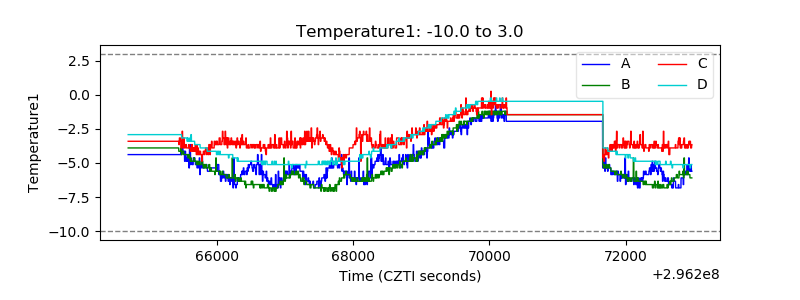 |
| Veto HV Monitor | 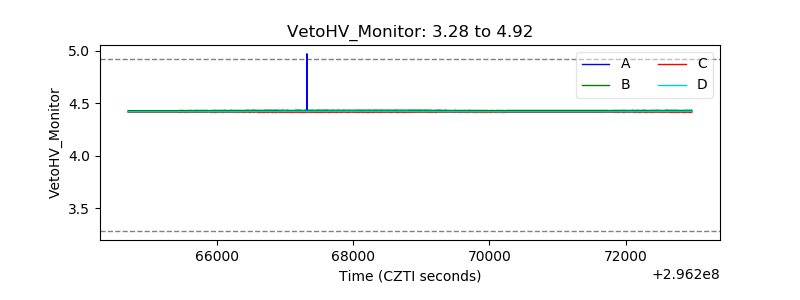 |
| Veto LLD | 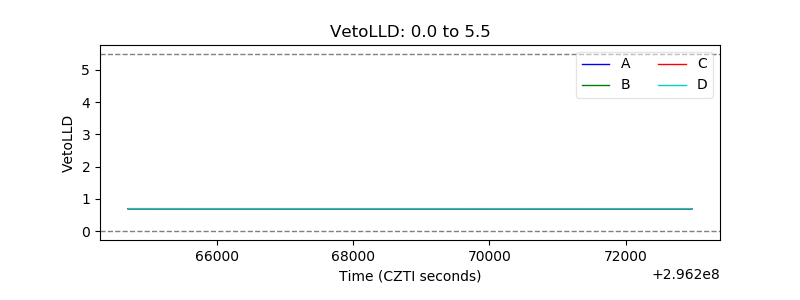 |
| Alpha Counter | 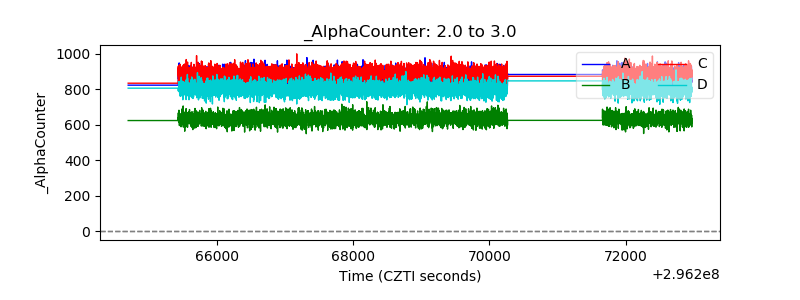 |
| _CPM_Rate | 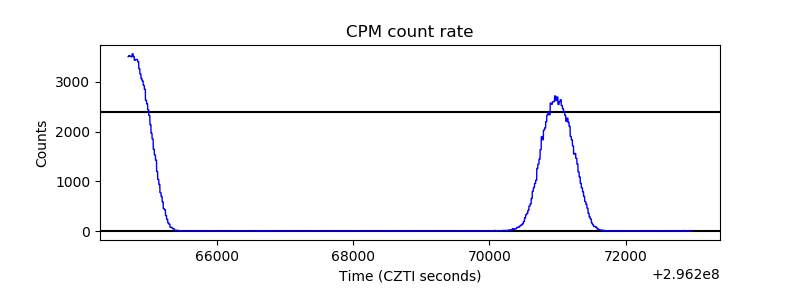 |
| CZT Counter | 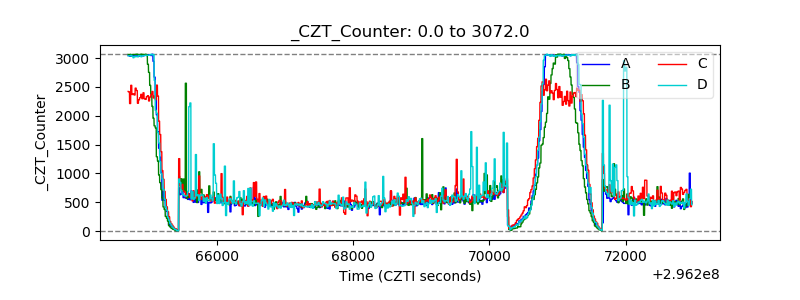 |
| +2.5 Volts monitor |  |
| +5 Volts monitor | 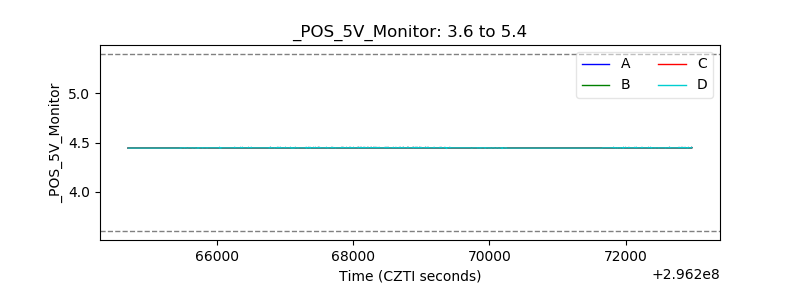 |
| _ROLL_ROT | 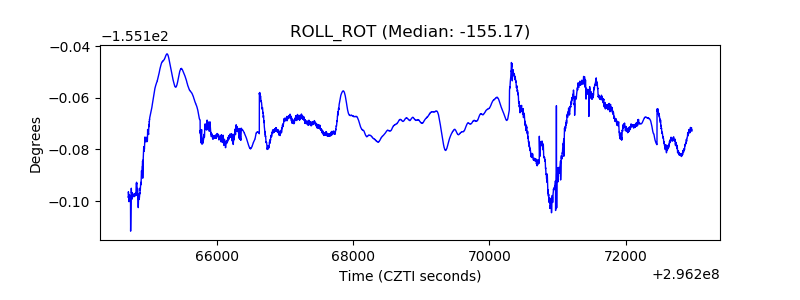 |
| _Roll_DEC | 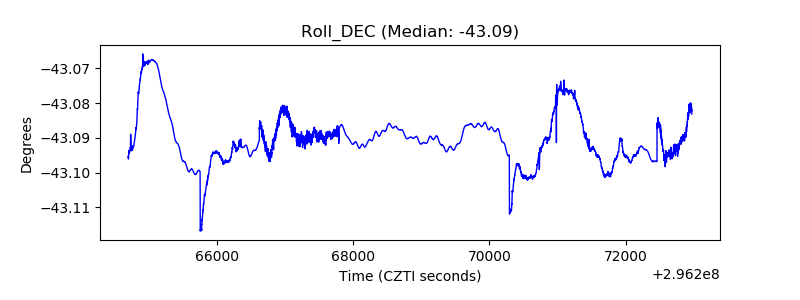 |
| _Roll_RA | 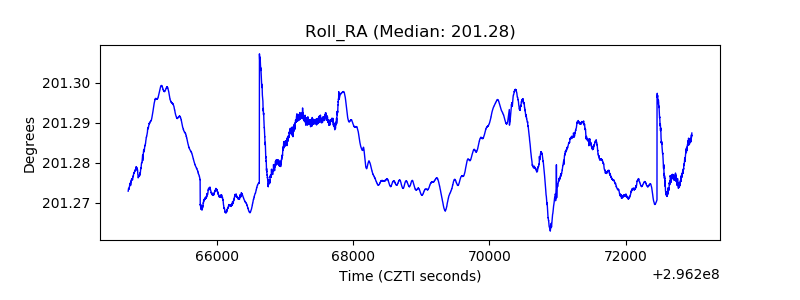 |
| Veto Counter | 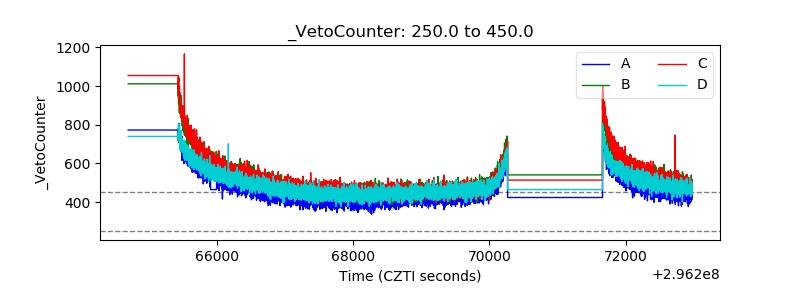 |