| Param | Original file | Final file |
|---|---|---|
| Filename | modeM0/AS1A05_013T01_9000002944_19730cztM0_level2.evt | modeM0/AS1A05_013T01_9000002944_19730cztM0_level2_quad_clean.evt |
| Size (bytes) | 483,678,720 | 81,748,800 |
| Size | 461.3 MB | 78.0 MB |
| Events in quadrant A | 3,183,072 | 514,783 |
| Events in quadrant B | 3,427,854 | 528,753 |
| Events in quadrant C | 4,091,546 | 500,098 |
| Events in quadrant D | 3,507,741 | 481,561 |
| Mode SS | |||
|---|---|---|---|
| Quadrant | BADHDUFLAG | Total packets | Discarded packets |
| A | 0 | 130 | 0 |
| B | 0 | 130 | 0 |
| C | 0 | 130 | 0 |
| D | 0 | 130 | 0 |
| Mode M0 | |||
|---|---|---|---|
| Quadrant | BADHDUFLAG | Total packets | Discarded packets |
| A | 0 | 13444 | 2 |
| B | 0 | 14085 | 2 |
| C | 0 | 16503 | 2 |
| D | 0 | 14591 | 2 |
| Mode M9 | |||
|---|---|---|---|
| Quadrant | BADHDUFLAG | Total packets | Discarded packets |
| A | 0 | 20 | 0 |
| B | 0 | 21 | 0 |
| C | 0 | 21 | 0 |
| D | 0 | 21 | 0 |
| Quadrant | Total seconds | Saturated seconds | Saturation percentage |
|---|---|---|---|
| A | 6459 | 6 | 0.092894% |
| B | 6459 | 58 | 0.897972% |
| C | 6459 | 94 | 1.455334% |
| D | 6459 | 98 | 1.517263% |
Noise dominated data is calculated using 1-second bins in cleaned event files. If a bin has >2000 counts, and if more than 50% of those come from <1% of pixels, then it is considered to be noise-dominated and hence unusable.
| Quadrant | # 1 sec bins | Bins with >0 counts | Bins with >2000 counts | High rate bins dominated by noise | Noise dominated (total time) | Noise dominated (detector-on time) | Marked lightcurve |
|---|---|---|---|---|---|---|---|
| A | 7794 | 6460 | 0 | 0 | 0.00% | 0.00% | 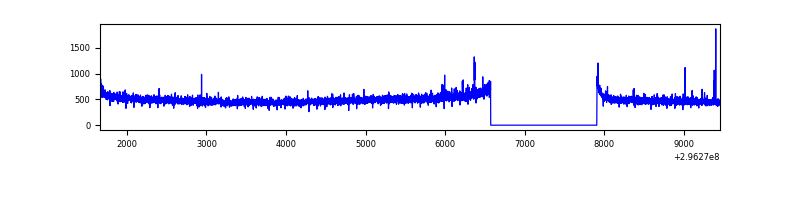 |
| B | 7794 | 6460 | 20 | 20 | 0.26% | 0.31% | 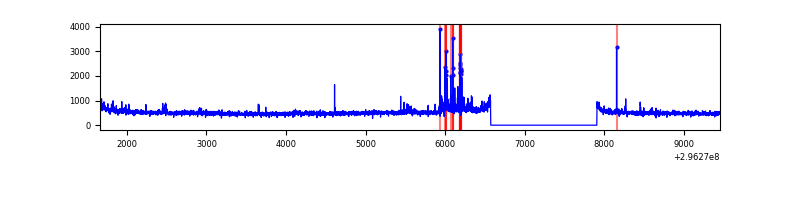 |
| C | 7794 | 6460 | 1 | 1 | 0.01% | 0.02% | 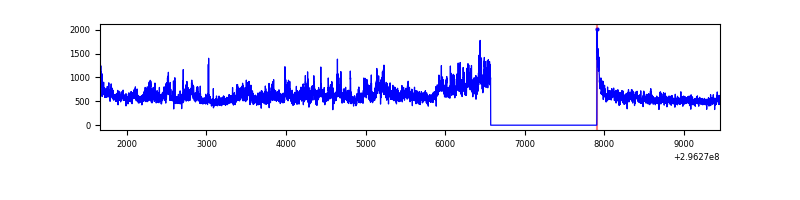 |
| D | 7794 | 6460 | 86 | 86 | 1.10% | 1.33% | 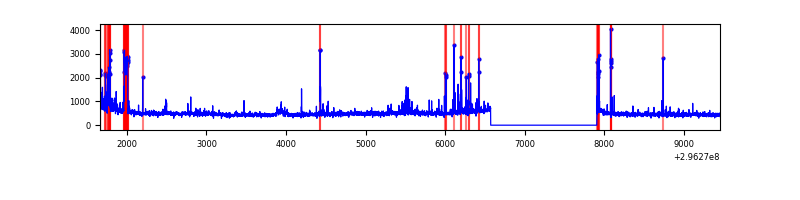 |
Top three noisy pixels from each quadrant. If the there are fewer than three noisy pixels in the level2.evt file, extra rows are filled as -1
| Pixel properties | Quadrant properties | ||||||
|---|---|---|---|---|---|---|---|
| Quadrant | DetID | PixID | Counts | Sigma | Mean | Median | Sigma |
| A | 6 | 16 | 26210 | 156.54 | 815 | 801 | 162.3 |
| A | 13 | 254 | 7992 | 44.3 | 815 | 801 | 162.3 |
| A | 0 | 226 | 7162 | 39.19 | 815 | 801 | 162.3 |
| B | 7 | 220 | 97838 | 624.0 | 823 | 805 | 155.5 |
| B | 4 | 216 | 45076 | 284.7 | 823 | 805 | 155.5 |
| B | 4 | 171 | 28883 | 180.57 | 823 | 805 | 155.5 |
| C | 3 | 233 | 880853 | 4849.44 | 791 | 798 | 181.5 |
| C | 14 | 238 | 125335 | 686.25 | 791 | 798 | 181.5 |
| C | 13 | 61 | 5560 | 26.24 | 791 | 798 | 181.5 |
| D | 1 | 52 | 214599 | 1111.55 | 791 | 769 | 192.4 |
| D | 7 | 38 | 106843 | 551.4 | 791 | 769 | 192.4 |
| D | 12 | 218 | 74531 | 383.43 | 791 | 769 | 192.4 |
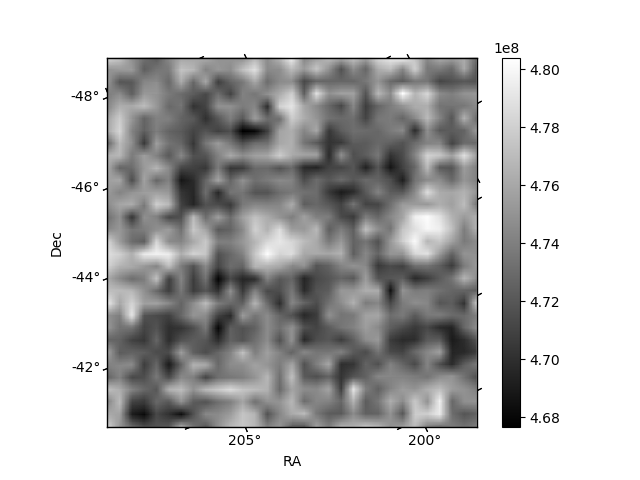
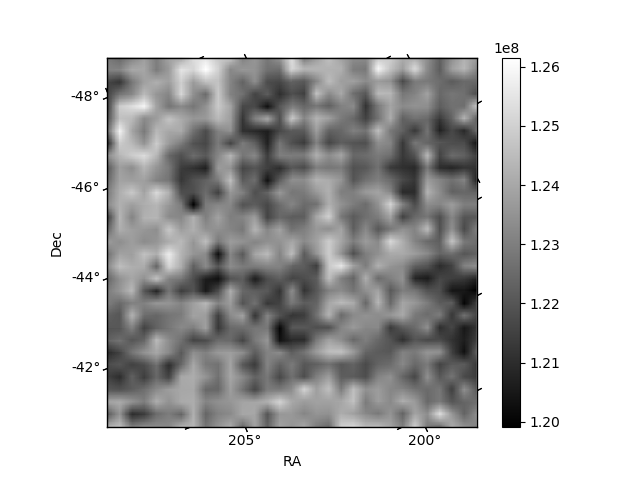
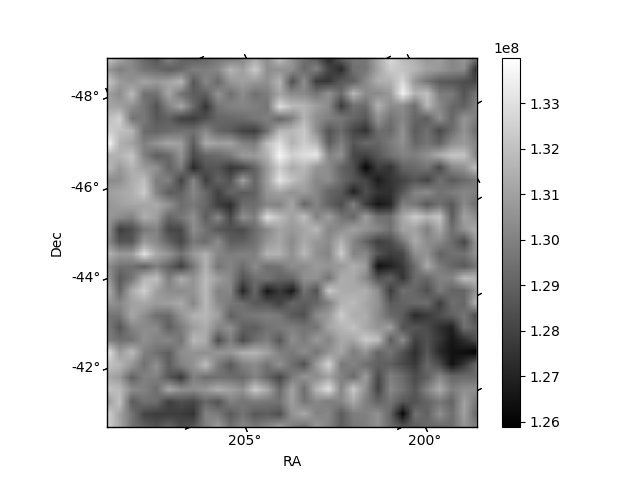
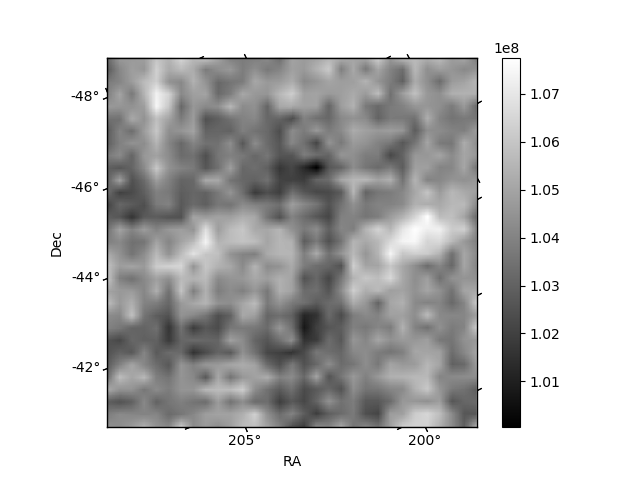
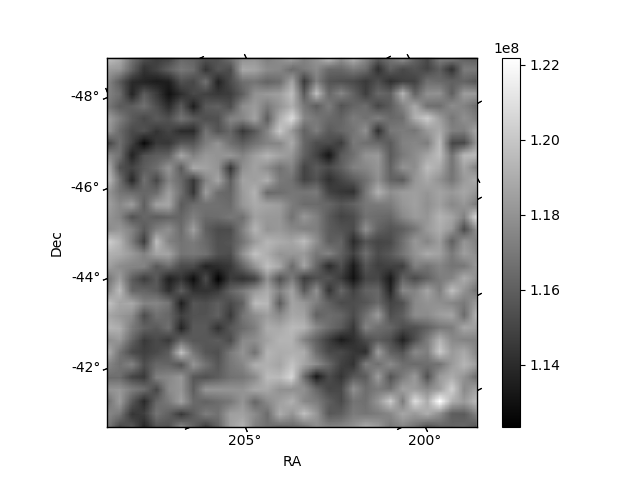
Histogram calculated using DETX and DETY for each event in the final _common_clean file
| Quadrant A | 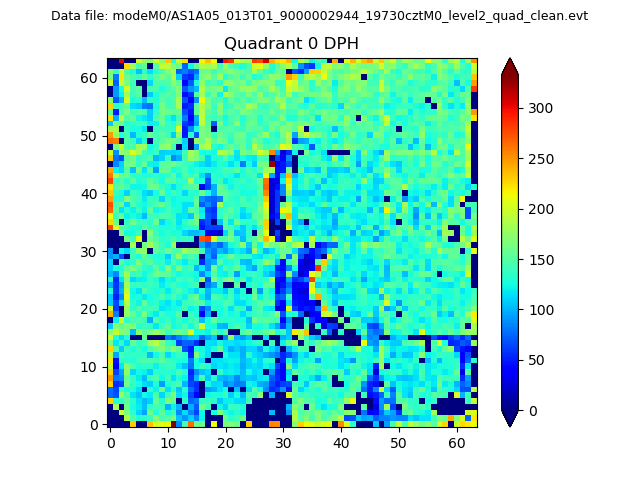 |
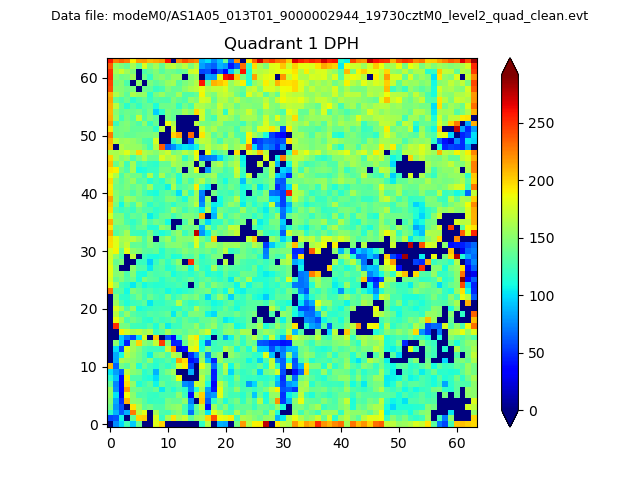 |
Quadrant B |
|---|---|---|---|
| Quadrant D |  |
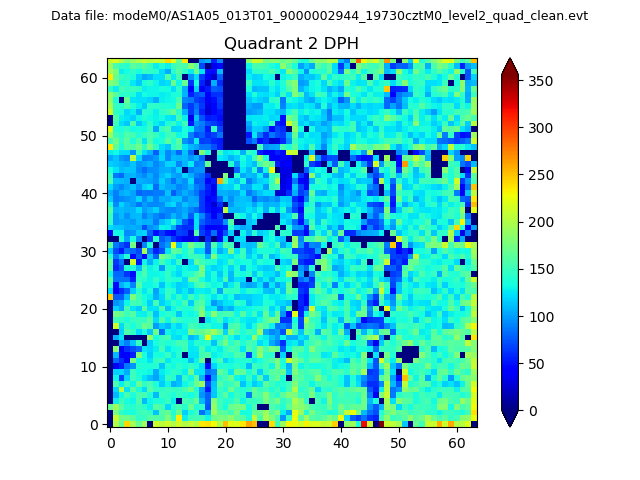 |
Quadrant C |
| Plot type | Count rate plots | Images |
|---|---|---|
| Comparison with Poisson distribution Blue bars denote a histogram of data divided into 1 sec bins. Red curve is a Poisson curve with rate = median count rate of data. |
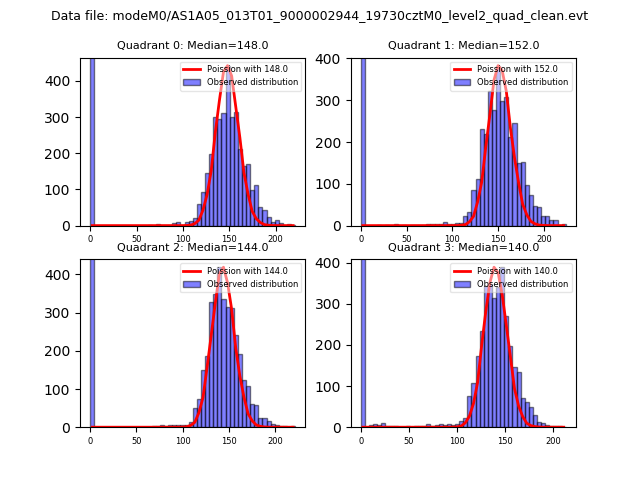 |
 |
| Quadrant-wise count rates Data is divided into 100 sec bins |
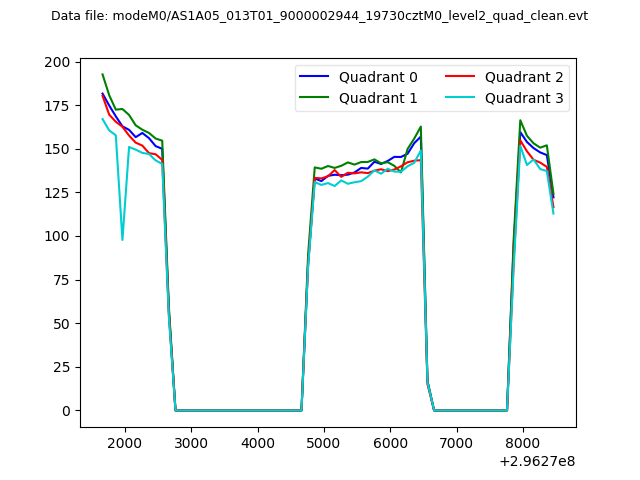 |
|
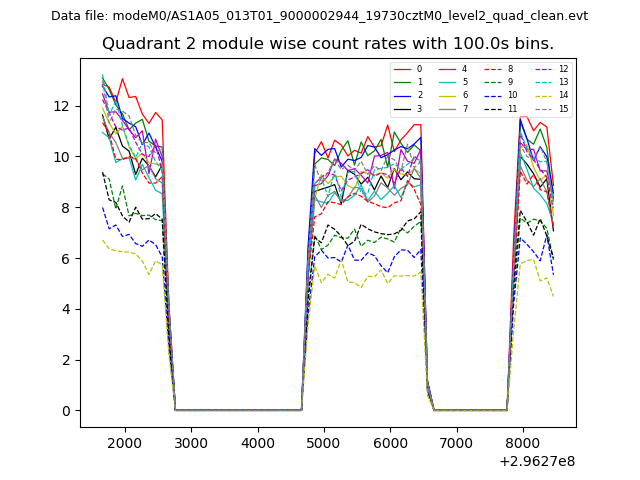
| Module-wise count rates for Quadrant A Data is divided into 100 sec bins |
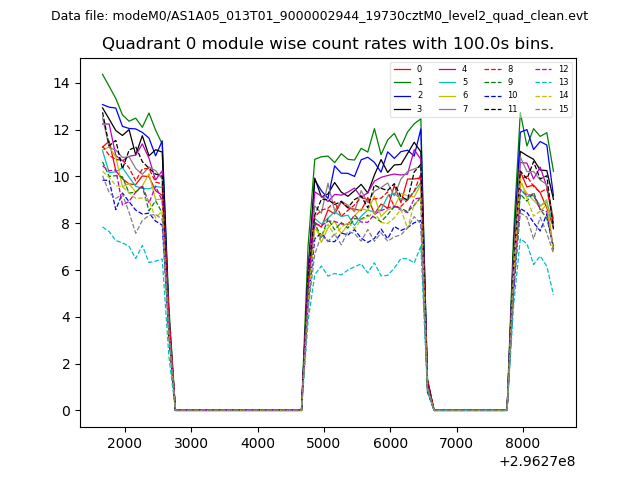 |
 |
| Module-wise count rates for Quadrant B Data is divided into 100 sec bins |
 |
 |
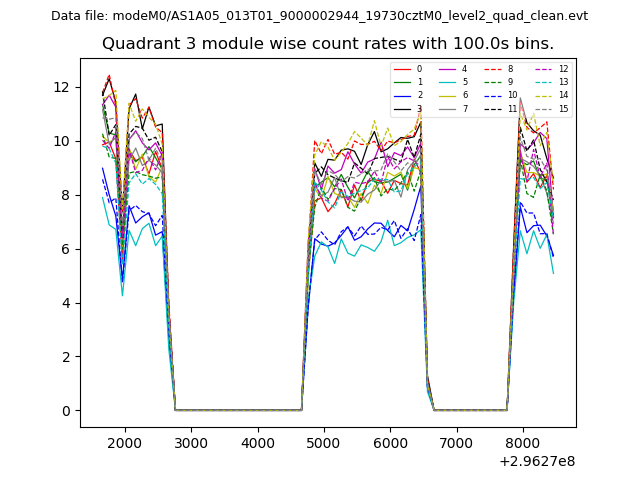
| Module-wise count rates for Quadrant C Data is divided into 100 sec bins |
 |
 |
| Module-wise count rates for Quadrant D Data is divided into 100 sec bins |
 |
 |
| Parameter | Plot |
|---|---|
| CZT HV Monitor |  |
| D_VDD | 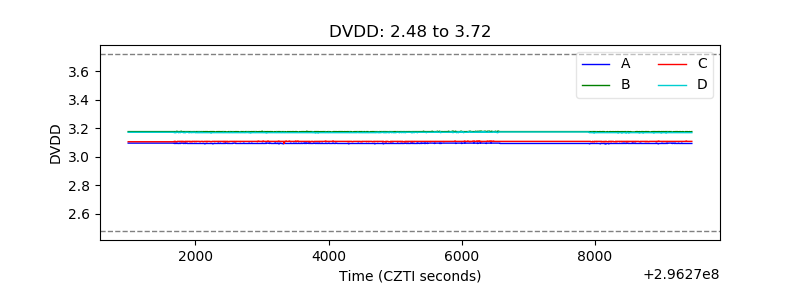 |
| Temperature 1 | 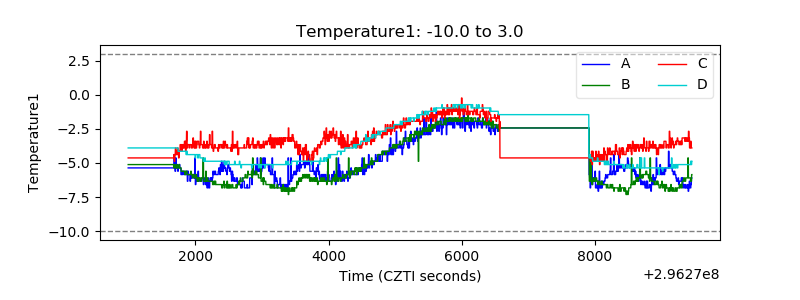 |
| Veto HV Monitor | 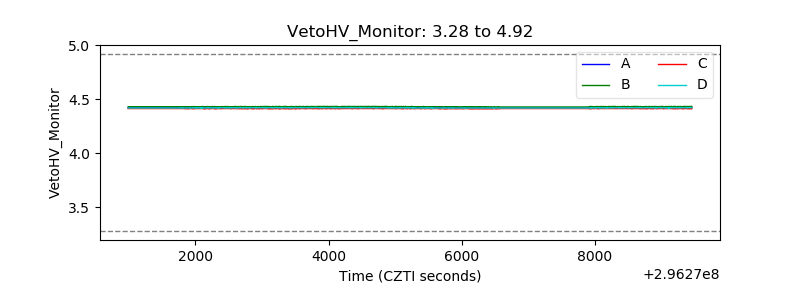 |
| Veto LLD |  |
| Alpha Counter | 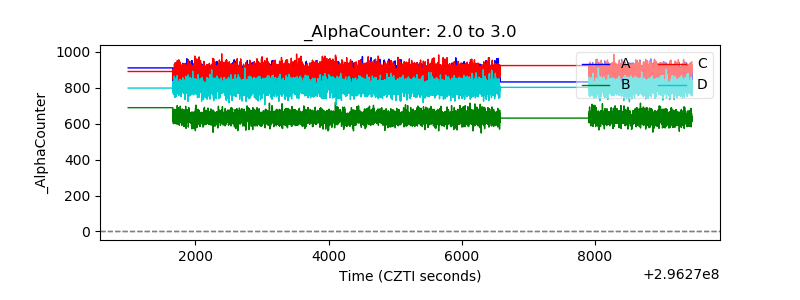 |
| _CPM_Rate | 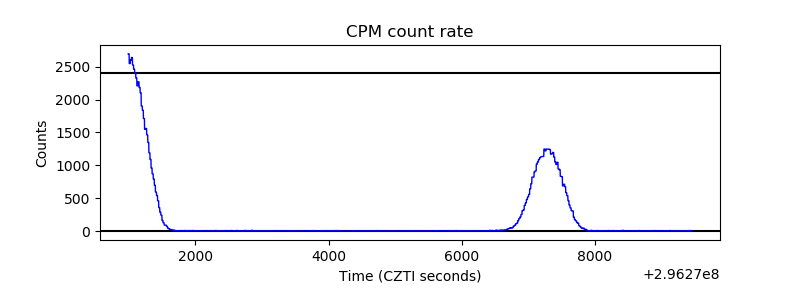 |
| CZT Counter | 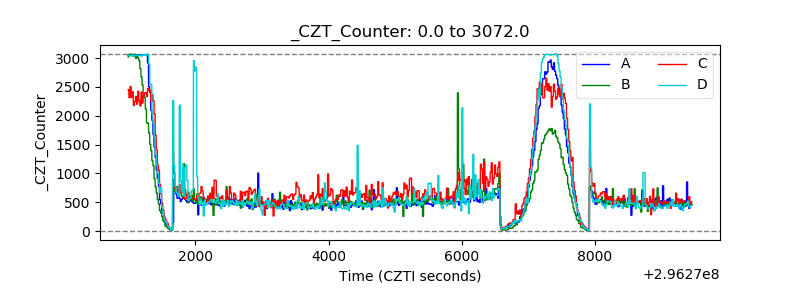 |
| +2.5 Volts monitor |  |
| +5 Volts monitor |  |
| _ROLL_ROT |  |
| _Roll_DEC | 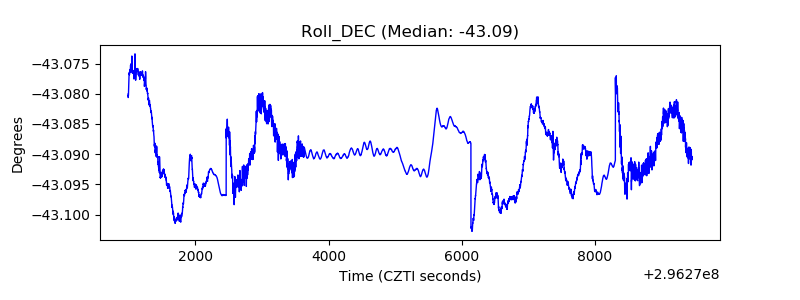 |
| _Roll_RA | 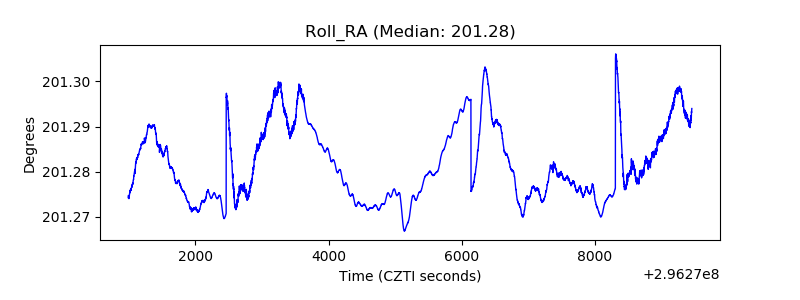 |
| Veto Counter |  |