| Param | Original file | Final file |
|---|---|---|
| Filename | modeM0/AS1A05_013T01_9000002944_19732cztM0_level2.evt | modeM0/AS1A05_013T01_9000002944_19732cztM0_level2_quad_clean.evt |
| Size (bytes) | 512,890,560 | 74,134,080 |
| Size | 489.1 MB | 70.7 MB |
| Events in quadrant A | 3,292,815 | 448,085 |
| Events in quadrant B | 3,488,610 | 453,387 |
| Events in quadrant C | 4,093,593 | 432,102 |
| Events in quadrant D | 4,186,892 | 427,626 |
| Mode SS | |||
|---|---|---|---|
| Quadrant | BADHDUFLAG | Total packets | Discarded packets |
| A | 0 | 144 | 0 |
| B | 0 | 144 | 0 |
| C | 0 | 144 | 0 |
| D | 0 | 144 | 0 |
| Mode M0 | |||
|---|---|---|---|
| Quadrant | BADHDUFLAG | Total packets | Discarded packets |
| A | 0 | 14388 | 1 |
| B | 0 | 14785 | 1 |
| C | 0 | 16456 | 1 |
| D | 0 | 17002 | 1 |
| Mode M9 | |||
|---|---|---|---|
| Quadrant | BADHDUFLAG | Total packets | Discarded packets |
| A | 0 | 5 | 0 |
| B | 0 | 5 | 0 |
| C | 0 | 5 | 0 |
| D | 0 | 5 | 0 |
| Quadrant | Total seconds | Saturated seconds | Saturation percentage |
|---|---|---|---|
| A | 6935 | 91 | 1.312185% |
| B | 6936 | 141 | 2.032872% |
| C | 6936 | 219 | 3.157439% |
| D | 6936 | 244 | 3.517878% |
Noise dominated data is calculated using 1-second bins in cleaned event files. If a bin has >2000 counts, and if more than 50% of those come from <1% of pixels, then it is considered to be noise-dominated and hence unusable.
| Quadrant | # 1 sec bins | Bins with >0 counts | Bins with >2000 counts | High rate bins dominated by noise | Noise dominated (total time) | Noise dominated (detector-on time) | Marked lightcurve |
|---|---|---|---|---|---|---|---|
| A | 7460 | 6936 | 1 | 1 | 0.01% | 0.01% | 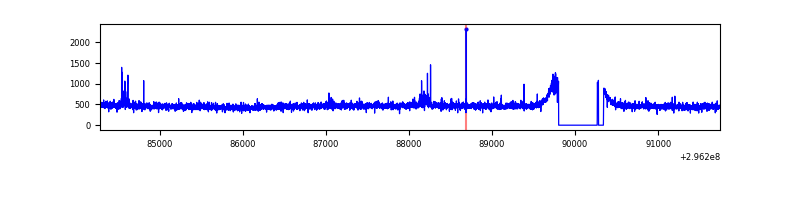 |
| B | 7461 | 6937 | 19 | 19 | 0.25% | 0.27% | 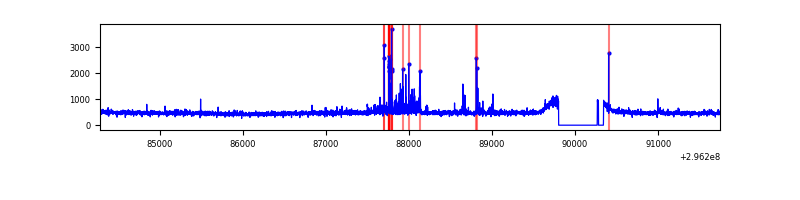 |
| C | 7461 | 6937 | 38 | 38 | 0.51% | 0.55% | 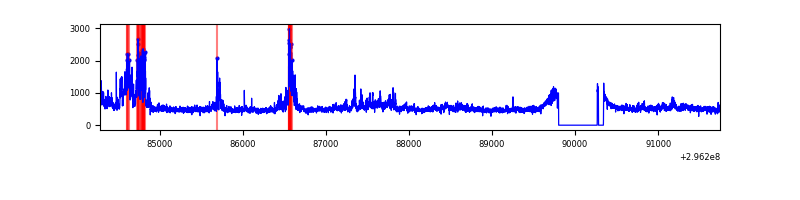 |
| D | 7461 | 6936 | 133 | 133 | 1.78% | 1.92% | 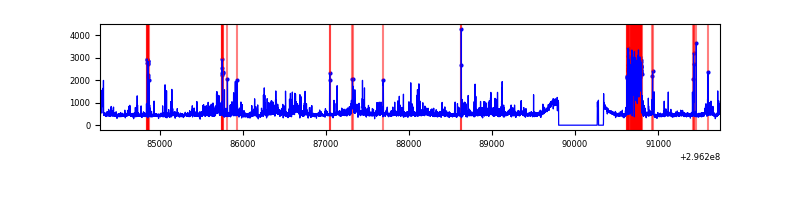 |
Top three noisy pixels from each quadrant. If the there are fewer than three noisy pixels in the level2.evt file, extra rows are filled as -1
| Pixel properties | Quadrant properties | ||||||
|---|---|---|---|---|---|---|---|
| Quadrant | DetID | PixID | Counts | Sigma | Mean | Median | Sigma |
| A | 6 | 16 | 38058 | 218.78 | 842 | 826 | 170.2 |
| A | 13 | 254 | 7549 | 39.51 | 842 | 826 | 170.2 |
| A | 0 | 226 | 7390 | 38.57 | 842 | 826 | 170.2 |
| B | 7 | 220 | 132773 | 820.13 | 841 | 820 | 160.9 |
| B | 12 | 111 | 19590 | 116.66 | 841 | 820 | 160.9 |
| B | 0 | 197 | 18378 | 109.13 | 841 | 820 | 160.9 |
| C | 3 | 233 | 814376 | 4277.07 | 809 | 812 | 190.2 |
| C | 14 | 238 | 124373 | 649.59 | 809 | 812 | 190.2 |
| C | 13 | 61 | 5614 | 25.25 | 809 | 812 | 190.2 |
| D | 1 | 52 | 986705 | 4988.13 | 815 | 791 | 197.7 |
| D | 2 | 16 | 38671 | 191.65 | 815 | 791 | 197.7 |
| D | 7 | 238 | 34616 | 171.13 | 815 | 791 | 197.7 |
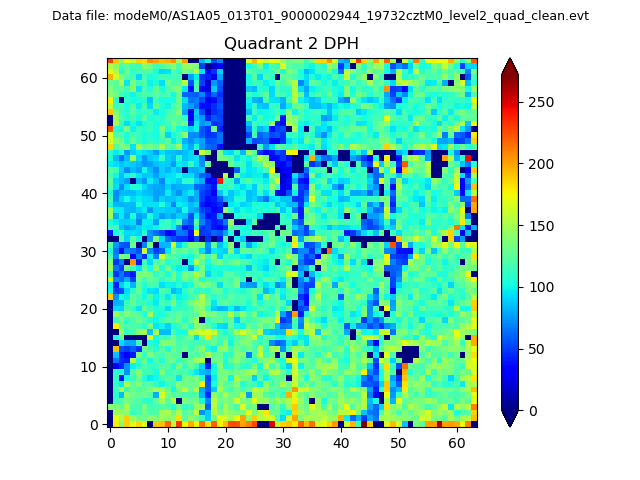
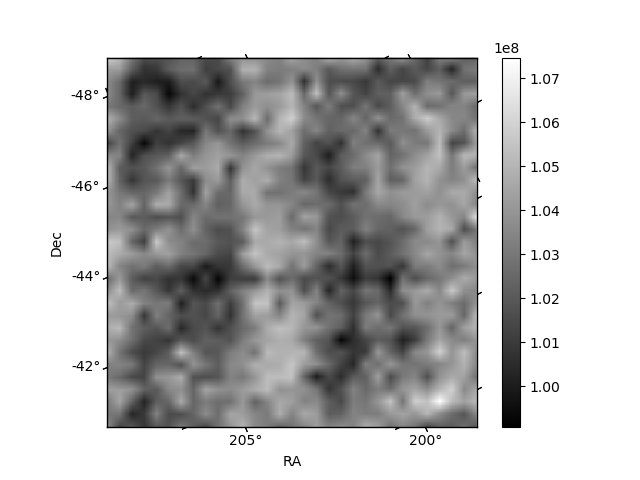
Histogram calculated using DETX and DETY for each event in the final _common_clean file
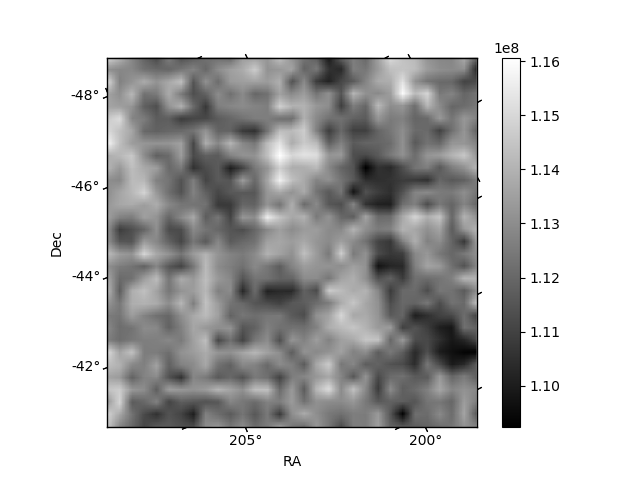
| Quadrant A | 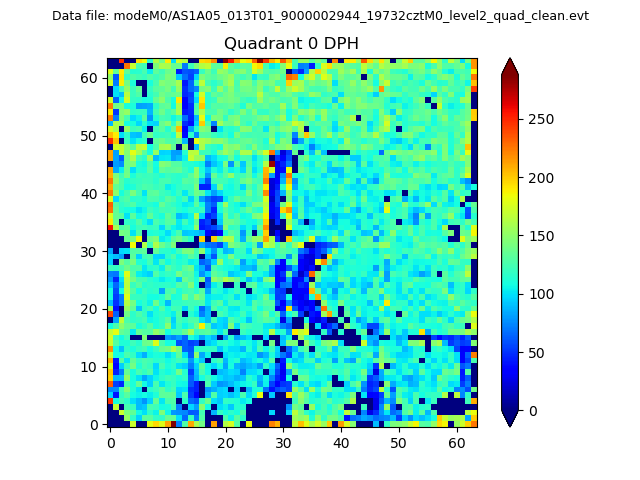 |
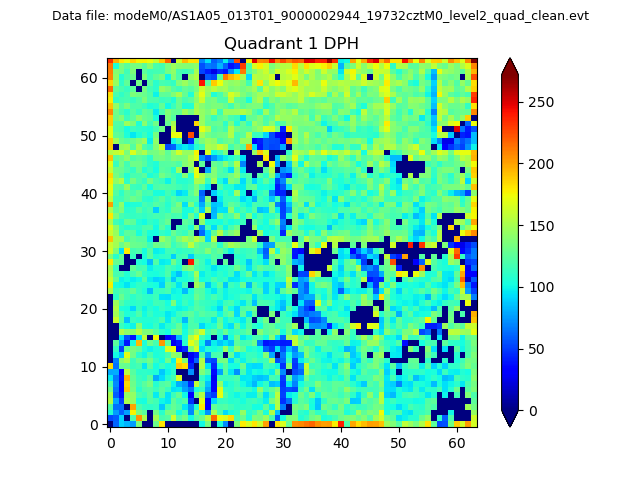 |
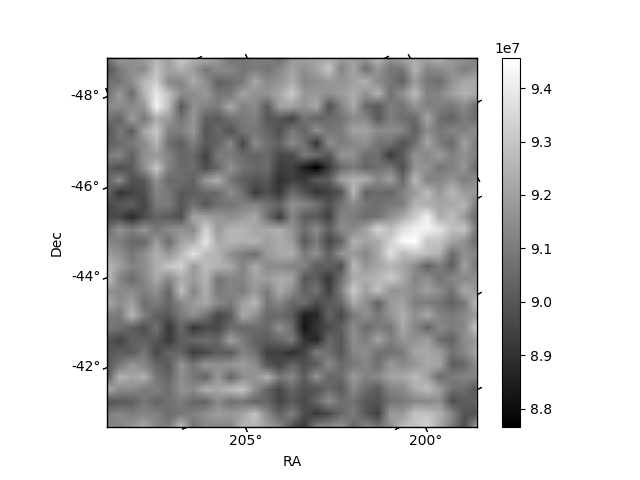
Quadrant B |
|---|---|---|---|
| Quadrant D | 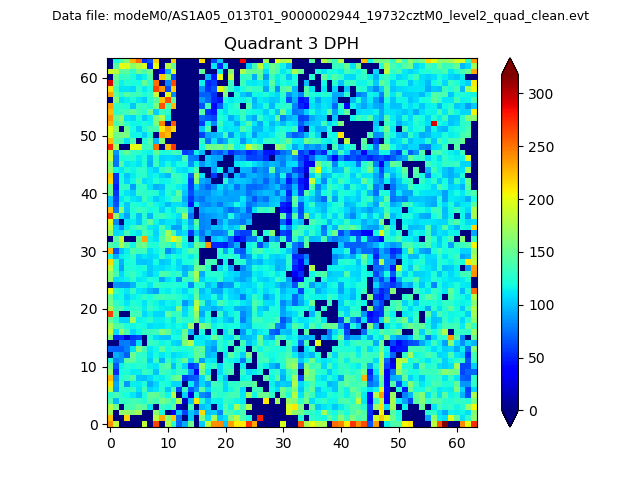 |
 |
Quadrant C |
| Plot type | Count rate plots | Images |
|---|---|---|
| Comparison with Poisson distribution Blue bars denote a histogram of data divided into 1 sec bins. Red curve is a Poisson curve with rate = median count rate of data. |
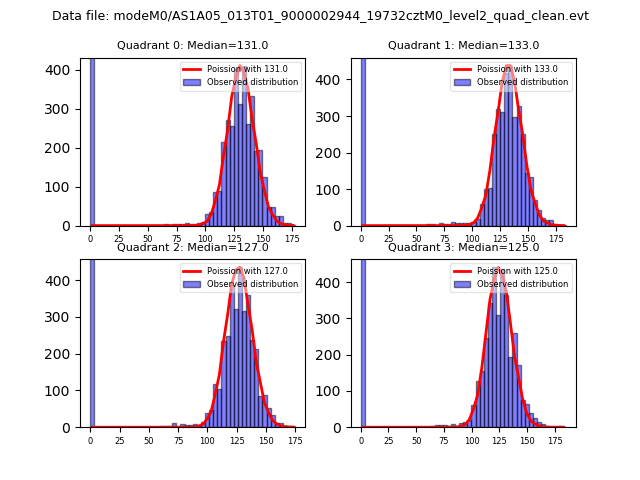 |
 |
| Quadrant-wise count rates Data is divided into 100 sec bins |
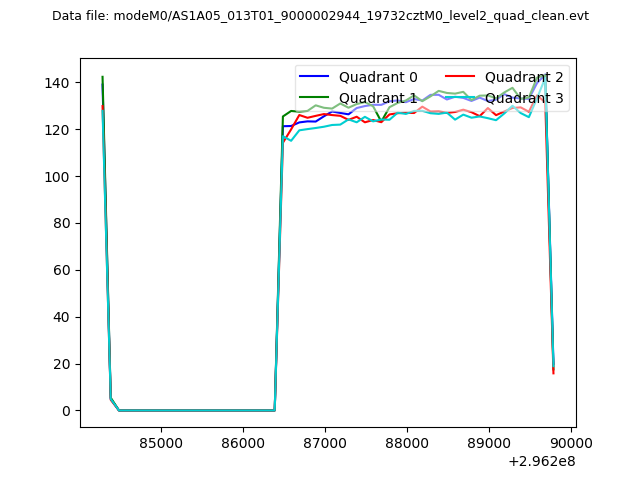 |
|
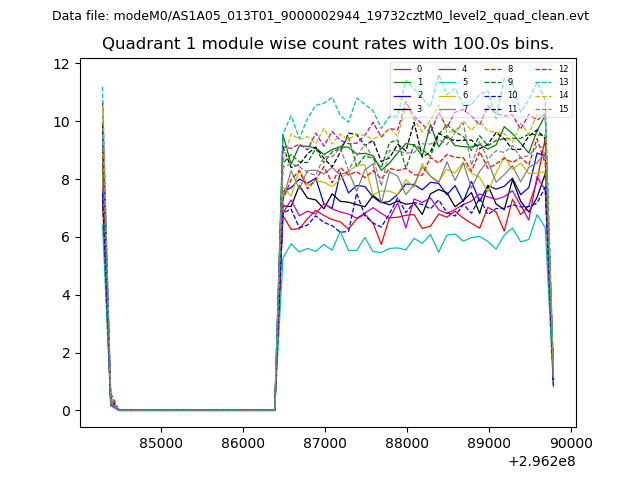
| Module-wise count rates for Quadrant A Data is divided into 100 sec bins |
 |
 |
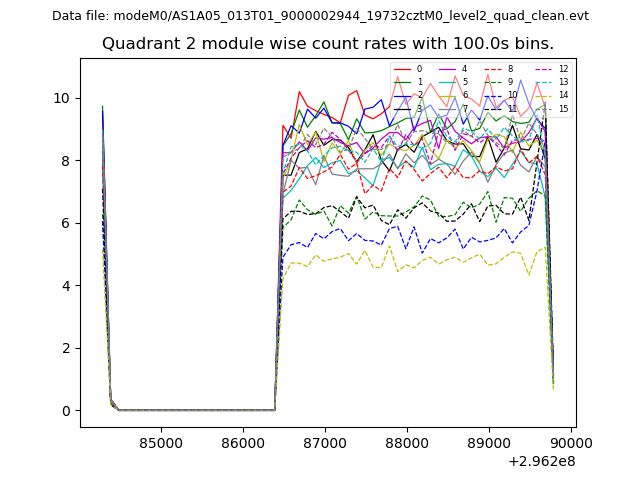
| Module-wise count rates for Quadrant B Data is divided into 100 sec bins |
 |
 |
| Module-wise count rates for Quadrant C Data is divided into 100 sec bins |
 |
 |
| Module-wise count rates for Quadrant D Data is divided into 100 sec bins |
 |
 |
| Parameter | Plot |
|---|---|
| CZT HV Monitor | 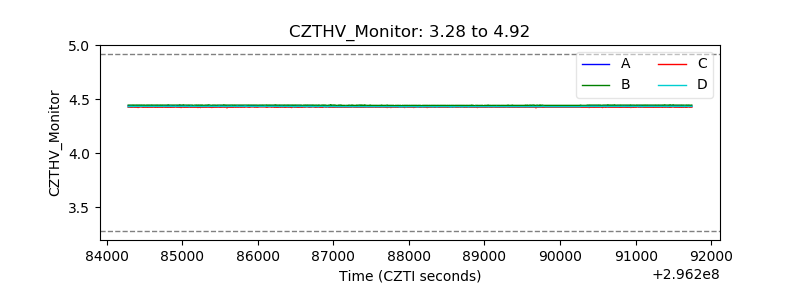 |
| D_VDD | 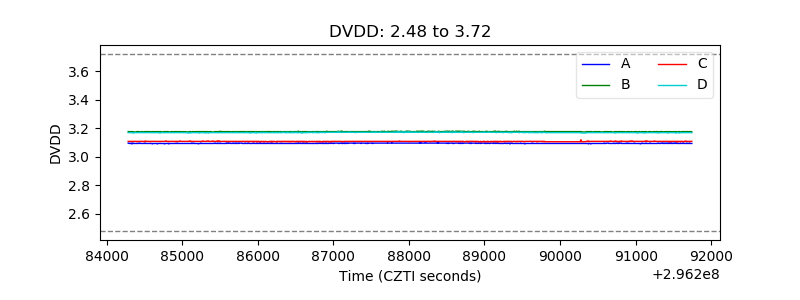 |
| Temperature 1 | 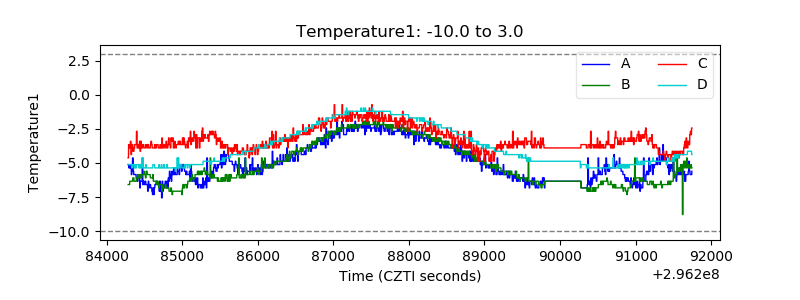 |
| Veto HV Monitor | 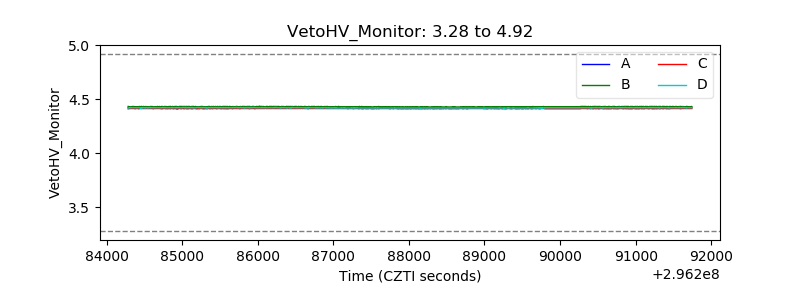 |
| Veto LLD | 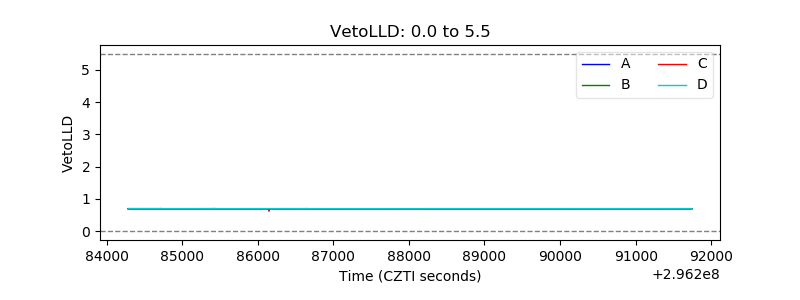 |
| Alpha Counter | 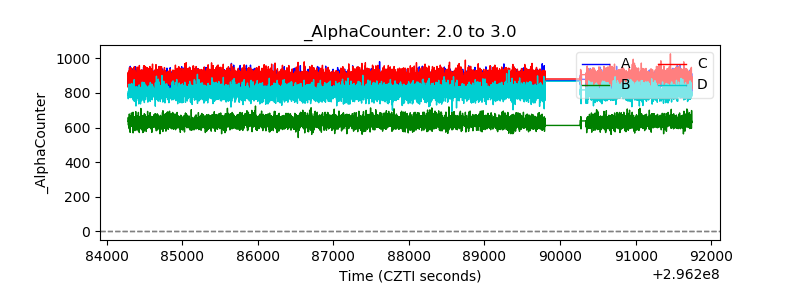 |
| _CPM_Rate | 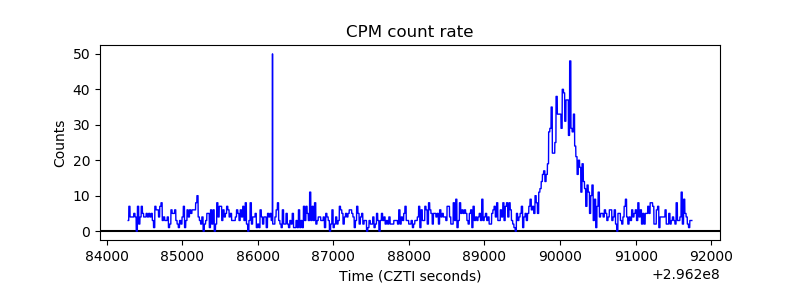 |
| CZT Counter | 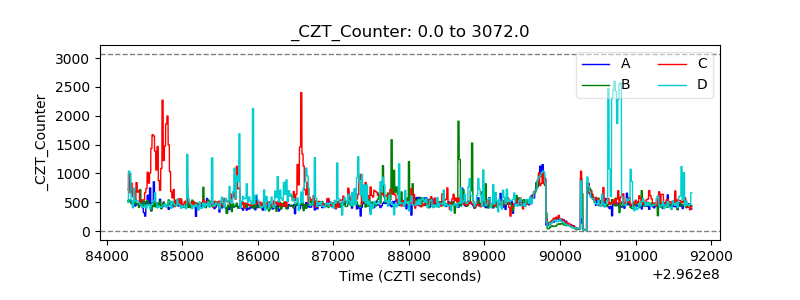 |
| +2.5 Volts monitor | 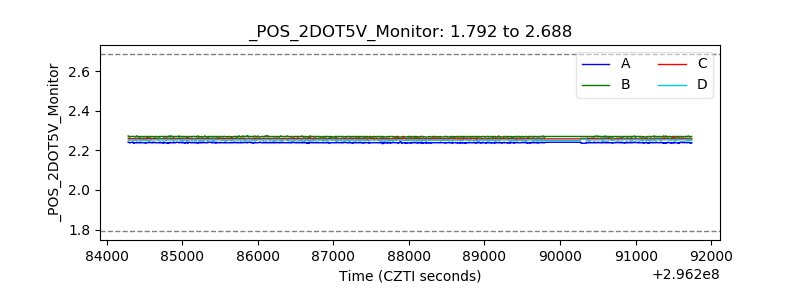 |
| +5 Volts monitor |  |
| _ROLL_ROT |  |
| _Roll_DEC | 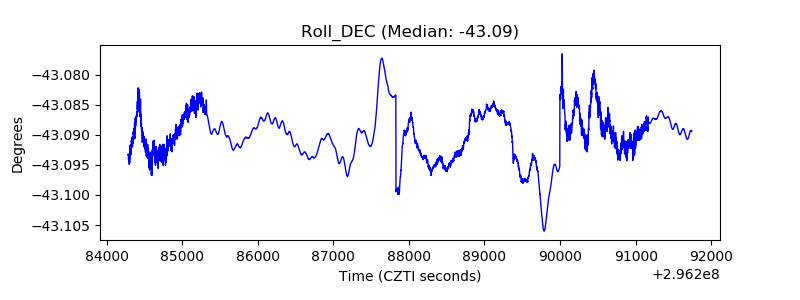 |
| _Roll_RA | 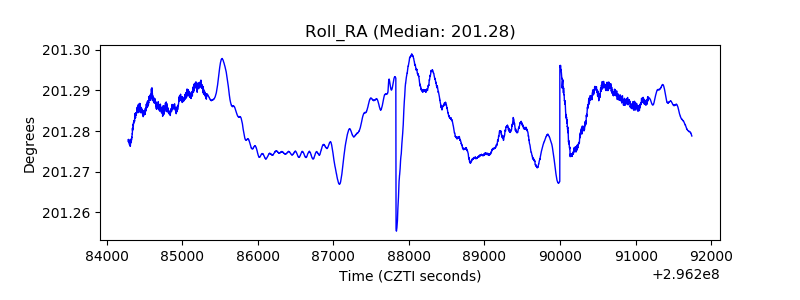 |
| Veto Counter |  |