| Param | Original file | Final file |
|---|---|---|
| Filename | modeM0/AS1A05_013T01_9000002944_19733cztM0_level2.evt | modeM0/AS1A05_013T01_9000002944_19733cztM0_level2_quad_clean.evt |
| Size (bytes) | 626,664,960 | 91,972,800 |
| Size | 597.6 MB | 87.7 MB |
| Events in quadrant A | 4,111,111 | 562,481 |
| Events in quadrant B | 4,362,444 | 569,274 |
| Events in quadrant C | 4,336,577 | 543,330 |
| Events in quadrant D | 5,595,328 | 523,397 |
| Mode SS | |||
|---|---|---|---|
| Quadrant | BADHDUFLAG | Total packets | Discarded packets |
| A | 0 | 174 | 0 |
| B | 0 | 174 | 0 |
| C | 0 | 174 | 0 |
| D | 0 | 174 | 0 |
| Mode M0 | |||
|---|---|---|---|
| Quadrant | BADHDUFLAG | Total packets | Discarded packets |
| A | 0 | 17859 | 3 |
| B | 0 | 18336 | 3 |
| C | 0 | 18135 | 3 |
| D | 0 | 22266 | 3 |
| Mode M9 | |||
|---|---|---|---|
| Quadrant | BADHDUFLAG | Total packets | Discarded packets |
| A | 0 | 5 | 0 |
| B | 0 | 5 | 0 |
| C | 0 | 5 | 0 |
| D | 0 | 5 | 0 |
| Quadrant | Total seconds | Saturated seconds | Saturation percentage |
|---|---|---|---|
| A | 8441 | 370 | 4.383367% |
| B | 8441 | 412 | 4.880938% |
| C | 8441 | 452 | 5.354816% |
| D | 8442 | 722 | 8.552476% |
Noise dominated data is calculated using 1-second bins in cleaned event files. If a bin has >2000 counts, and if more than 50% of those come from <1% of pixels, then it is considered to be noise-dominated and hence unusable.
| Quadrant | # 1 sec bins | Bins with >0 counts | Bins with >2000 counts | High rate bins dominated by noise | Noise dominated (total time) | Noise dominated (detector-on time) | Marked lightcurve |
|---|---|---|---|---|---|---|---|
| A | 9001 | 8444 | 0 | 0 | 0.00% | 0.00% | 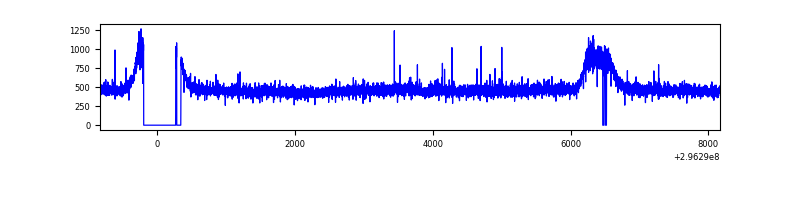 |
| B | 9001 | 8444 | 13 | 13 | 0.14% | 0.15% | 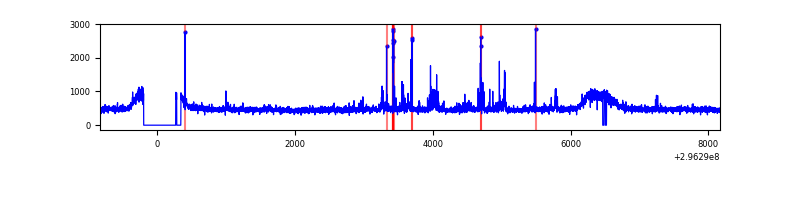 |
| C | 9001 | 8442 | 0 | 0 | 0.00% | 0.00% | 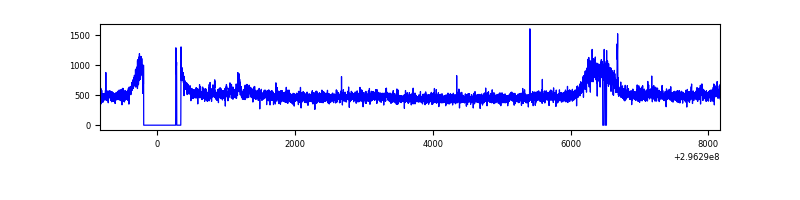 |
| D | 9002 | 8443 | 336 | 336 | 3.73% | 3.98% | 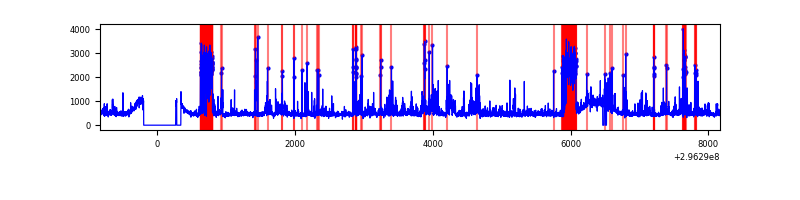 |
Top three noisy pixels from each quadrant. If the there are fewer than three noisy pixels in the level2.evt file, extra rows are filled as -1
| Pixel properties | Quadrant properties | ||||||
|---|---|---|---|---|---|---|---|
| Quadrant | DetID | PixID | Counts | Sigma | Mean | Median | Sigma |
| A | 0 | 226 | 9254 | 37.95 | 1062 | 1037 | 216.5 |
| A | 3 | 137 | 8928 | 36.44 | 1062 | 1037 | 216.5 |
| A | 9 | 143 | 8661 | 35.21 | 1062 | 1037 | 216.5 |
| B | 4 | 216 | 41287 | 194.94 | 1060 | 1029 | 206.5 |
| B | 7 | 220 | 37966 | 178.86 | 1060 | 1029 | 206.5 |
| B | 3 | 64 | 35258 | 165.75 | 1060 | 1029 | 206.5 |
| C | 3 | 233 | 174265 | 718.39 | 1021 | 1027 | 241.1 |
| C | 14 | 238 | 153162 | 630.88 | 1021 | 1027 | 241.1 |
| C | 7 | 247 | 16363 | 63.6 | 1021 | 1027 | 241.1 |
| D | 1 | 52 | 1406108 | 5574.11 | 1024 | 992 | 252.1 |
| D | 12 | 218 | 180136 | 710.67 | 1024 | 992 | 252.1 |
| D | 7 | 238 | 95362 | 374.37 | 1024 | 992 | 252.1 |
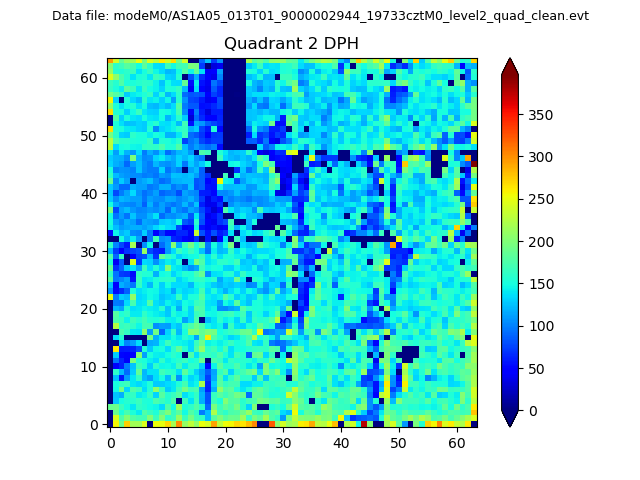
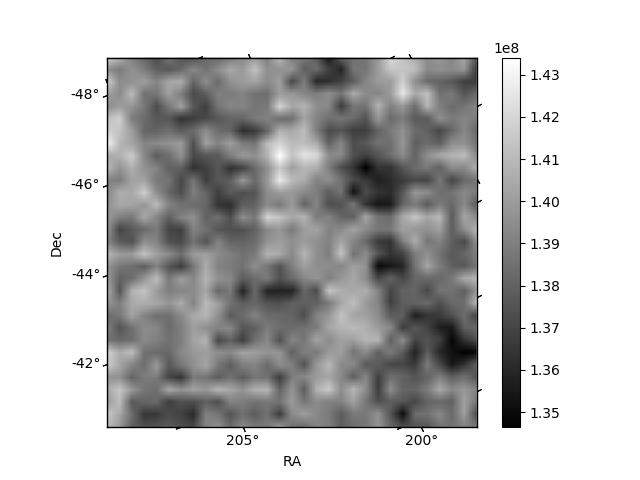
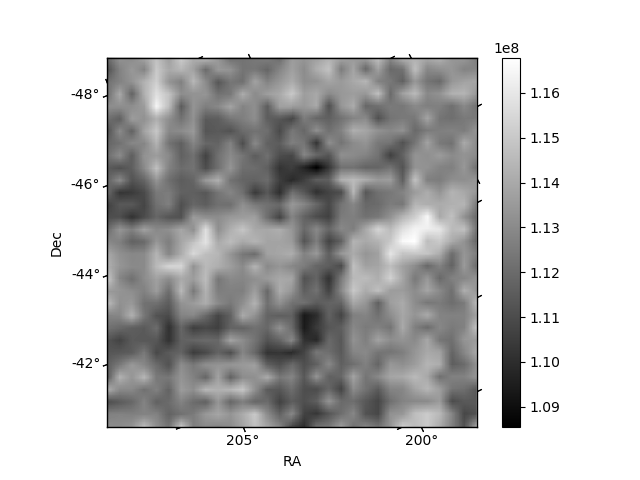
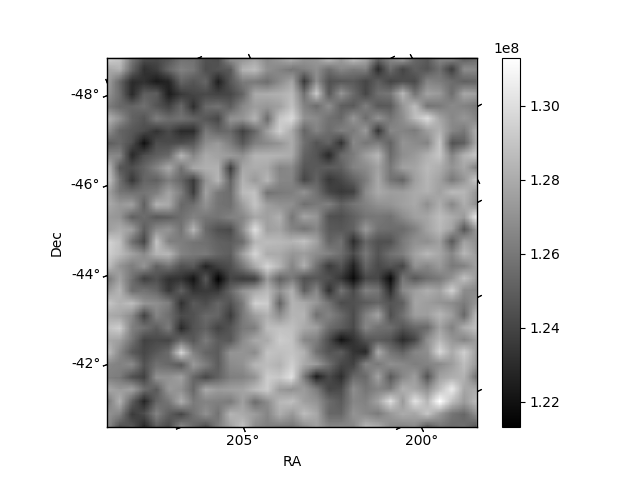
Histogram calculated using DETX and DETY for each event in the final _common_clean file
| Quadrant A | 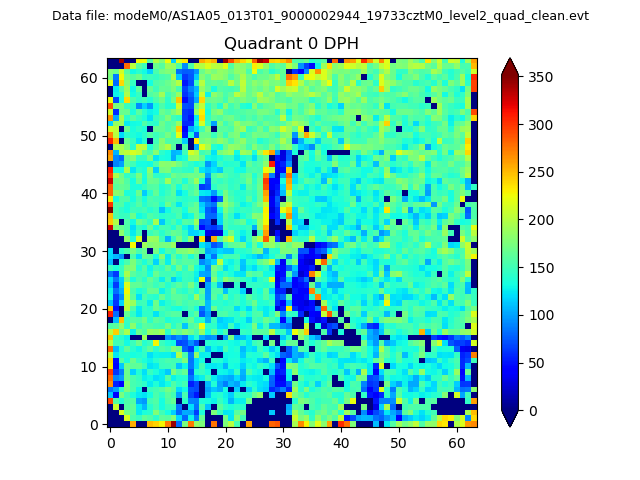 |
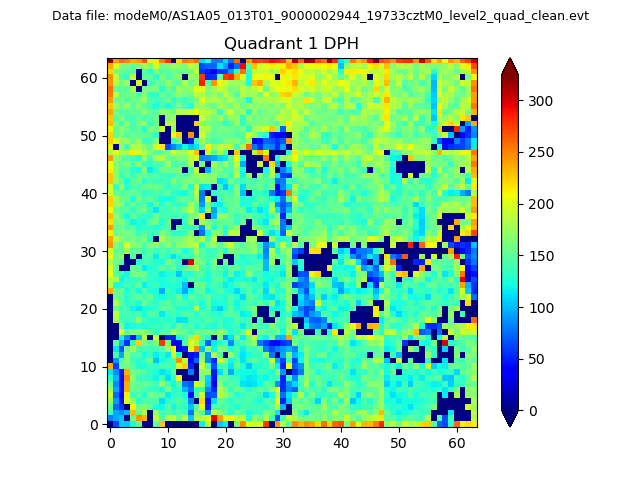 |
Quadrant B |
|---|---|---|---|
| Quadrant D | 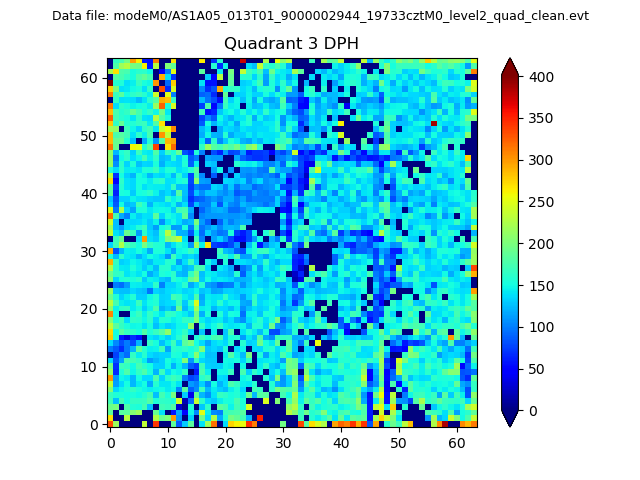 |
 |
Quadrant C |
| Plot type | Count rate plots | Images |
|---|---|---|
| Comparison with Poisson distribution Blue bars denote a histogram of data divided into 1 sec bins. Red curve is a Poisson curve with rate = median count rate of data. |
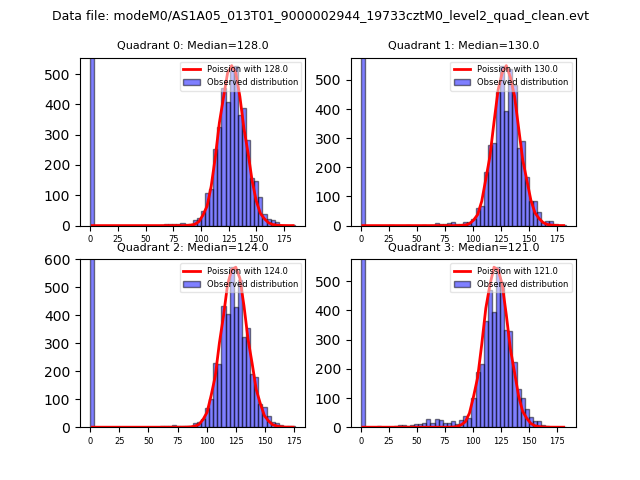 |
 |
| Quadrant-wise count rates Data is divided into 100 sec bins |
 |
|
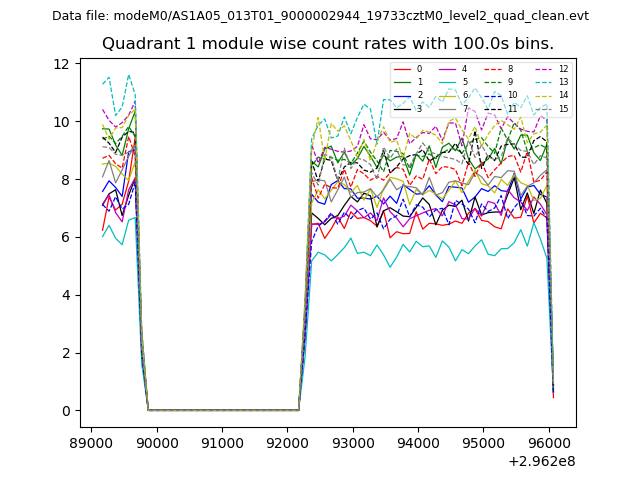
| Module-wise count rates for Quadrant A Data is divided into 100 sec bins |
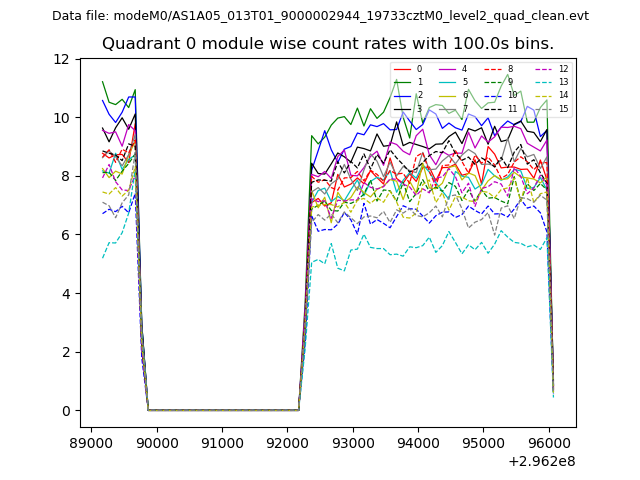 |
 |
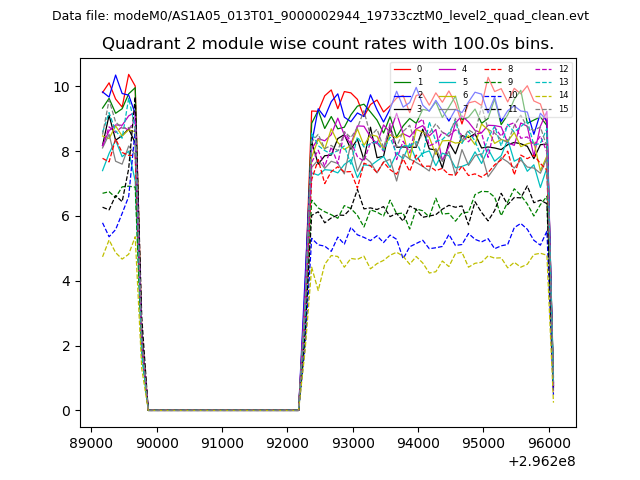
| Module-wise count rates for Quadrant B Data is divided into 100 sec bins |
 |
 |
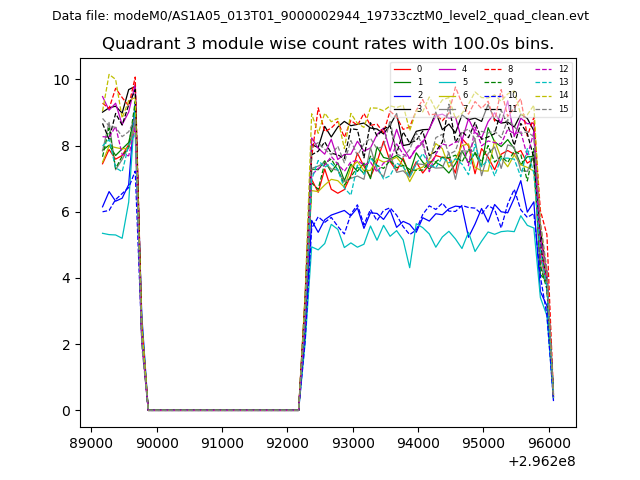
| Module-wise count rates for Quadrant C Data is divided into 100 sec bins |
 |
 |
| Module-wise count rates for Quadrant D Data is divided into 100 sec bins |
 |
 |
| Parameter | Plot |
|---|---|
| CZT HV Monitor | 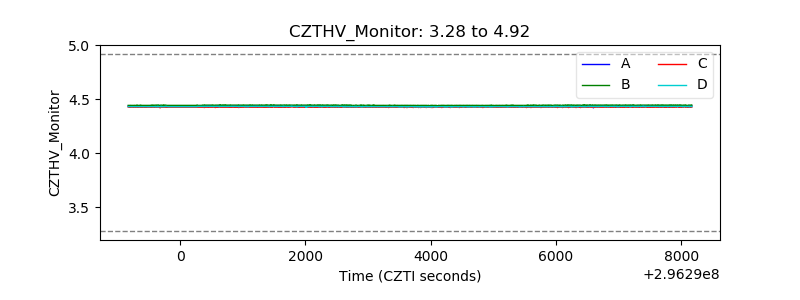 |
| D_VDD | 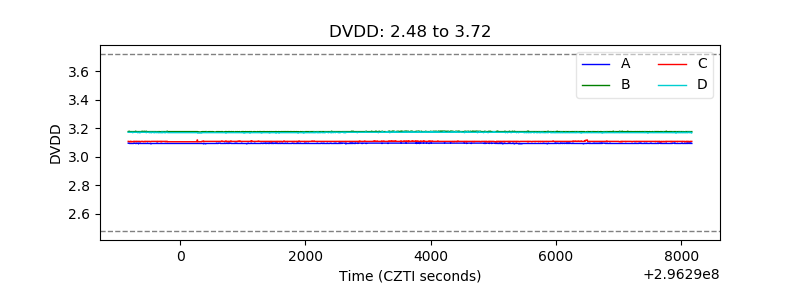 |
| Temperature 1 | 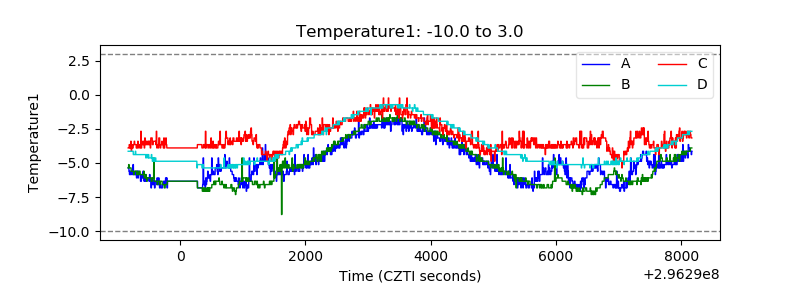 |
| Veto HV Monitor |  |
| Veto LLD | 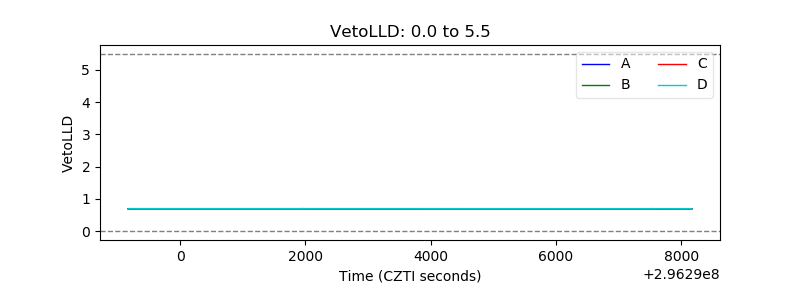 |
| Alpha Counter |  |
| _CPM_Rate | 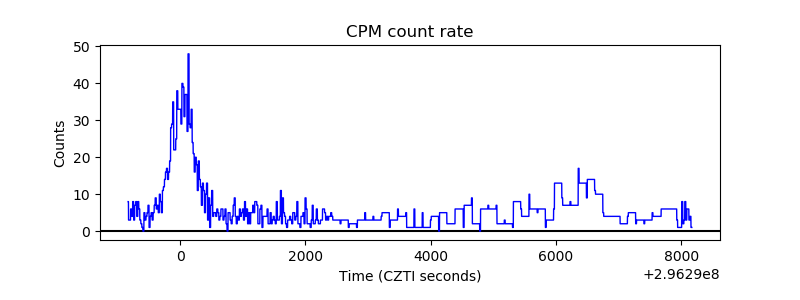 |
| CZT Counter | 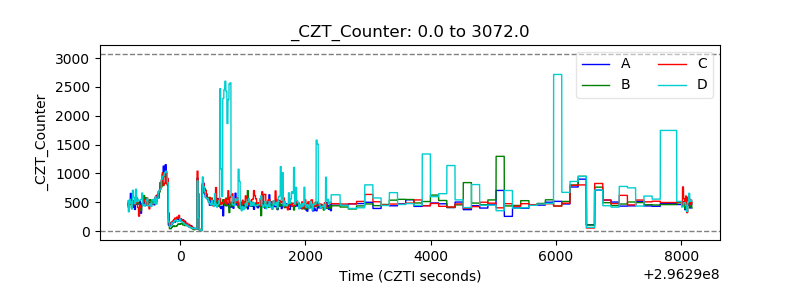 |
| +2.5 Volts monitor | 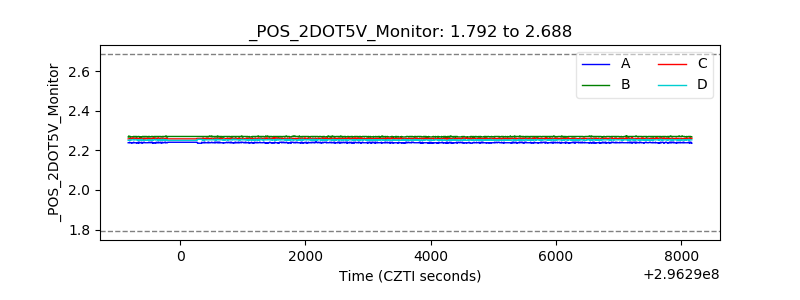 |
| +5 Volts monitor |  |
| _ROLL_ROT | 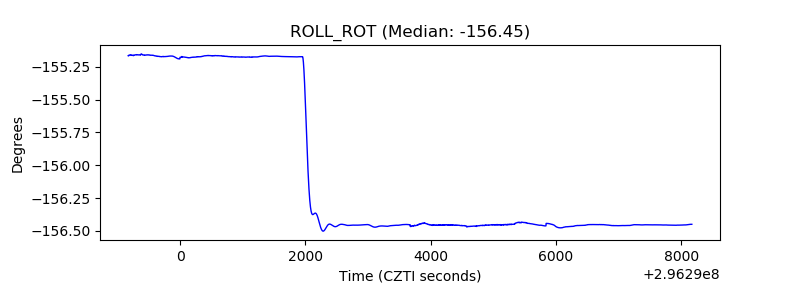 |
| _Roll_DEC | 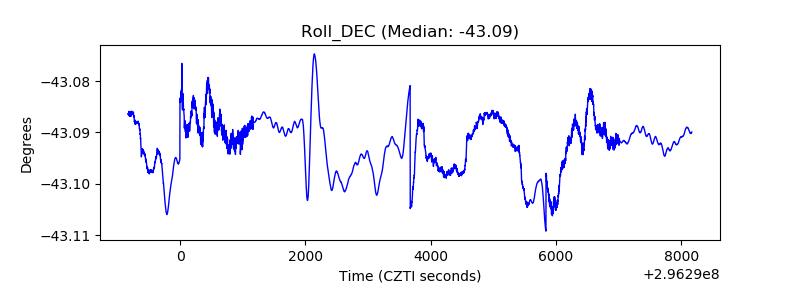 |
| _Roll_RA | 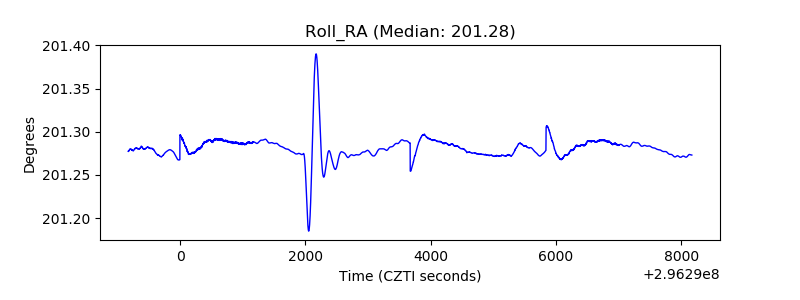 |
| Veto Counter | 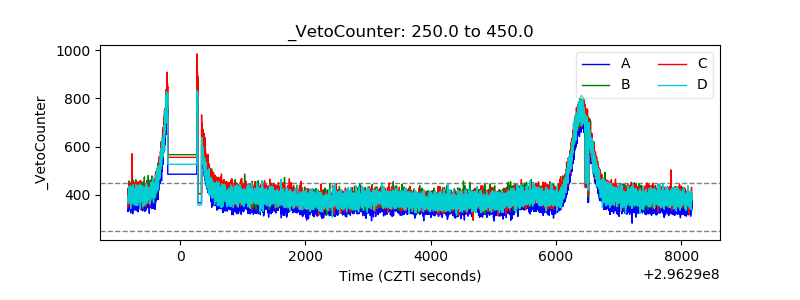 |