| Param | Original file | Final file |
|---|---|---|
| Filename | modeM0/AS1A05_013T01_9000002944_19734cztM0_level2.evt | modeM0/AS1A05_013T01_9000002944_19734cztM0_level2_quad_clean.evt |
| Size (bytes) | 651,746,880 | 90,221,760 |
| Size | 621.6 MB | 86.0 MB |
| Events in quadrant A | 4,361,734 | 548,959 |
| Events in quadrant B | 4,280,466 | 559,305 |
| Events in quadrant C | 5,081,982 | 528,198 |
| Events in quadrant D | 5,441,044 | 509,062 |
| Mode SS | |||
|---|---|---|---|
| Quadrant | BADHDUFLAG | Total packets | Discarded packets |
| A | 0 | 172 | 0 |
| B | 0 | 172 | 0 |
| C | 0 | 172 | 0 |
| D | 0 | 172 | 0 |
| Mode M0 | |||
|---|---|---|---|
| Quadrant | BADHDUFLAG | Total packets | Discarded packets |
| A | 0 | 18557 | 3 |
| B | 0 | 18070 | 3 |
| C | 0 | 20368 | 3 |
| D | 0 | 21855 | 3 |
| Mode M9 | |||
|---|---|---|---|
| Quadrant | BADHDUFLAG | Total packets | Discarded packets |
| A | 0 | 1 | 0 |
| B | 0 | 1 | 0 |
| C | 0 | 1 | 0 |
| D | 0 | 1 | 0 |
| Quadrant | Total seconds | Saturated seconds | Saturation percentage |
|---|---|---|---|
| A | 8438 | 556 | 6.589239% |
| B | 8438 | 518 | 6.138895% |
| C | 8437 | 560 | 6.637430% |
| D | 8438 | 756 | 8.959469% |
Noise dominated data is calculated using 1-second bins in cleaned event files. If a bin has >2000 counts, and if more than 50% of those come from <1% of pixels, then it is considered to be noise-dominated and hence unusable.
| Quadrant | # 1 sec bins | Bins with >0 counts | Bins with >2000 counts | High rate bins dominated by noise | Noise dominated (total time) | Noise dominated (detector-on time) | Marked lightcurve |
|---|---|---|---|---|---|---|---|
| A | 8608 | 8440 | 41 | 41 | 0.48% | 0.49% | 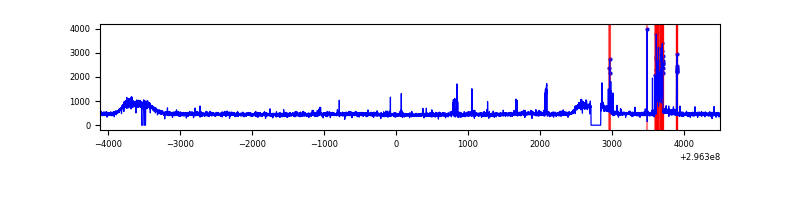 |
| B | 8608 | 8440 | 1 | 1 | 0.01% | 0.01% | 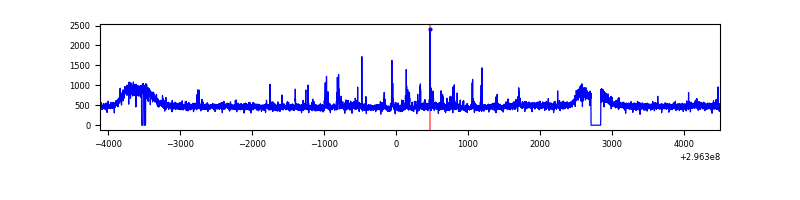 |
| C | 8607 | 8437 | 1 | 1 | 0.01% | 0.01% | 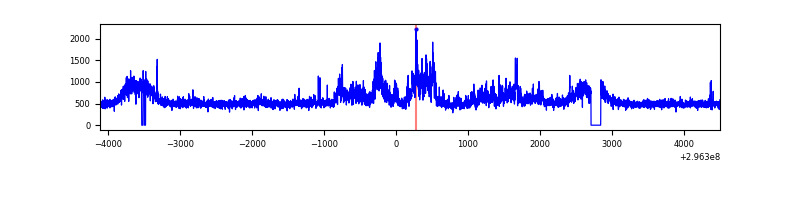 |
| D | 8608 | 8439 | 251 | 251 | 2.92% | 2.97% | 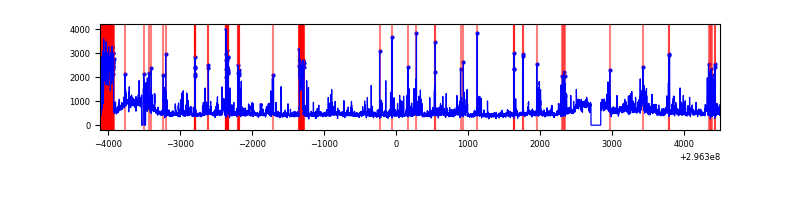 |
Top three noisy pixels from each quadrant. If the there are fewer than three noisy pixels in the level2.evt file, extra rows are filled as -1
| Pixel properties | Quadrant properties | ||||||
|---|---|---|---|---|---|---|---|
| Quadrant | DetID | PixID | Counts | Sigma | Mean | Median | Sigma |
| A | 0 | 254 | 243982 | 1123.33 | 1062 | 1037 | 216.3 |
| A | 9 | 143 | 25806 | 114.53 | 1062 | 1037 | 216.3 |
| A | 0 | 226 | 9388 | 38.61 | 1062 | 1037 | 216.3 |
| B | 4 | 216 | 52255 | 247.52 | 1061 | 1029 | 207.0 |
| B | 0 | 197 | 25651 | 118.97 | 1061 | 1029 | 207.0 |
| B | 12 | 111 | 25505 | 118.26 | 1061 | 1029 | 207.0 |
| C | 3 | 233 | 912585 | 3785.18 | 1022 | 1024 | 240.8 |
| C | 14 | 238 | 154572 | 637.59 | 1022 | 1024 | 240.8 |
| C | 7 | 247 | 22033 | 87.24 | 1022 | 1024 | 240.8 |
| D | 1 | 52 | 1238902 | 4888.18 | 1029 | 996 | 253.2 |
| D | 7 | 238 | 192699 | 756.99 | 1029 | 996 | 253.2 |
| D | 12 | 218 | 56057 | 217.42 | 1029 | 996 | 253.2 |
Histogram calculated using DETX and DETY for each event in the final _common_clean file
| Quadrant A |  |
 |
Quadrant B |
|---|---|---|---|
| Quadrant D | 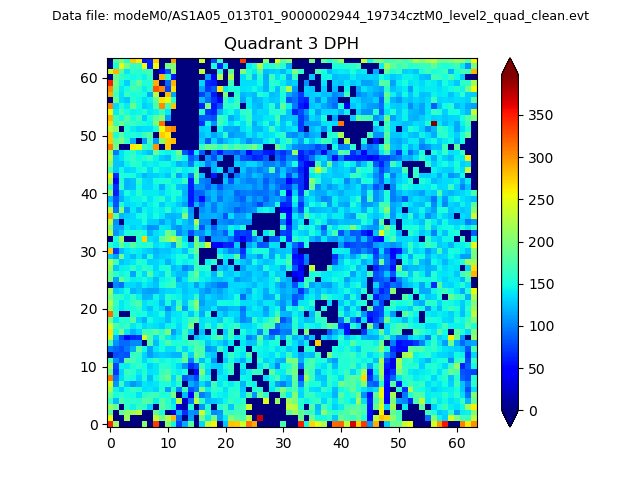 |
 |
Quadrant C |
| Plot type | Count rate plots | Images |
|---|---|---|
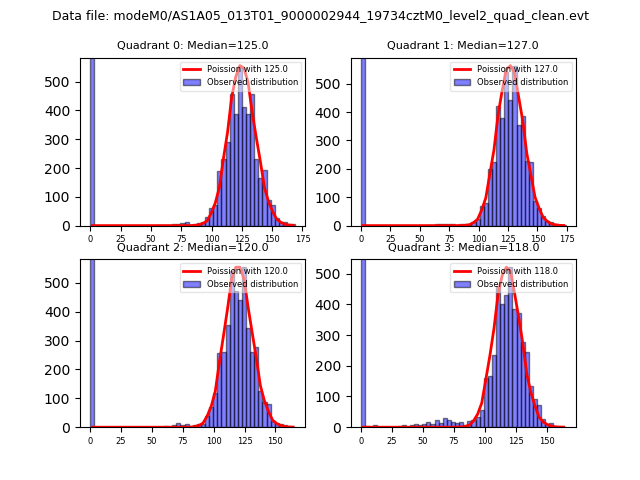
| Comparison with Poisson distribution Blue bars denote a histogram of data divided into 1 sec bins. Red curve is a Poisson curve with rate = median count rate of data. |
 |
 |
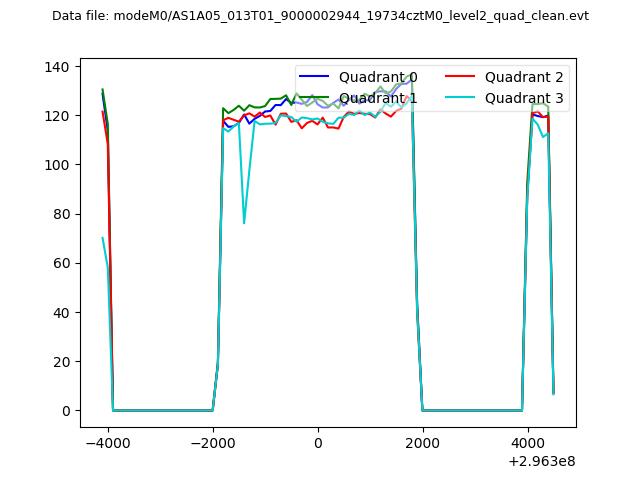
| Quadrant-wise count rates Data is divided into 100 sec bins |
 |
|
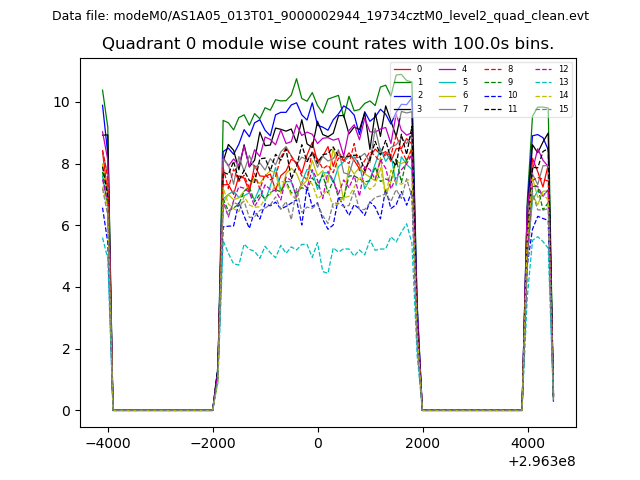
| Module-wise count rates for Quadrant A Data is divided into 100 sec bins |
 |
 |
| Module-wise count rates for Quadrant B Data is divided into 100 sec bins |
 |
 |
| Module-wise count rates for Quadrant C Data is divided into 100 sec bins |
 |
 |
| Module-wise count rates for Quadrant D Data is divided into 100 sec bins |
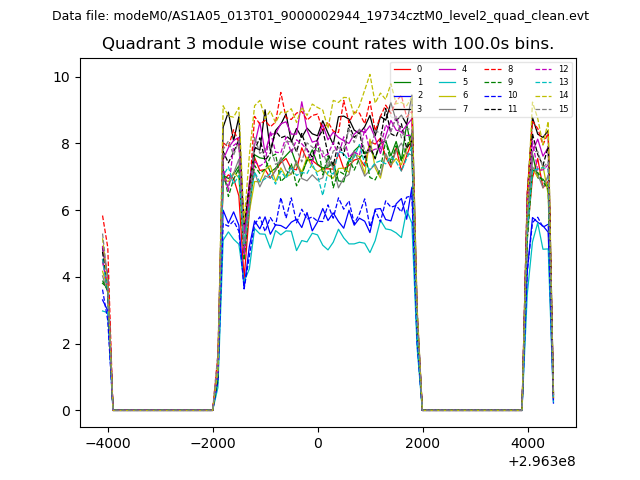 |
 |
| Parameter | Plot |
|---|---|
| CZT HV Monitor |  |
| D_VDD | 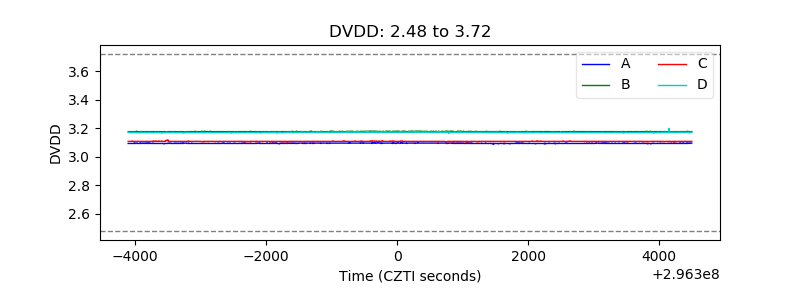 |
| Temperature 1 | 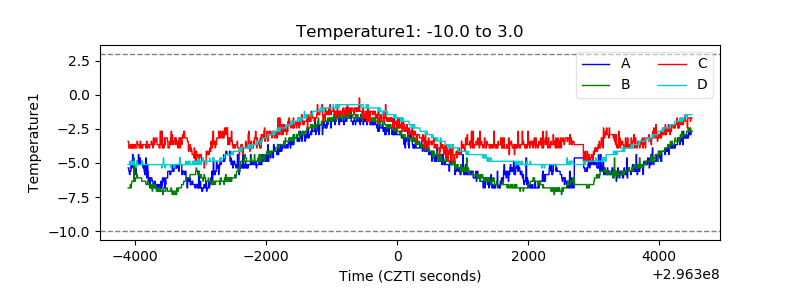 |
| Veto HV Monitor | 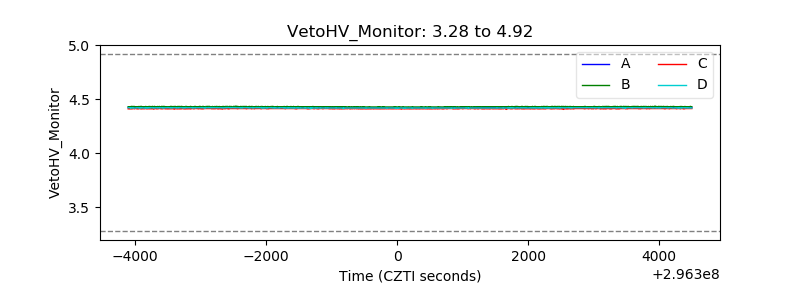 |
| Veto LLD | 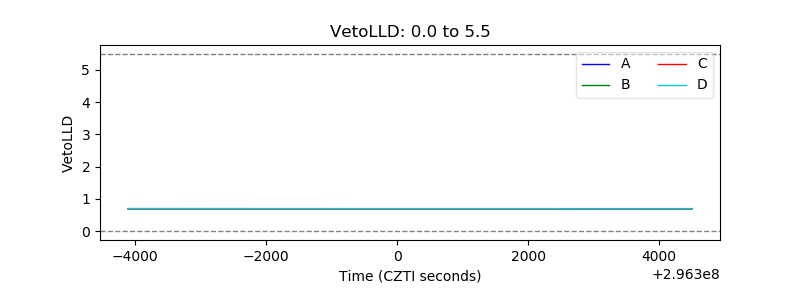 |
| Alpha Counter | 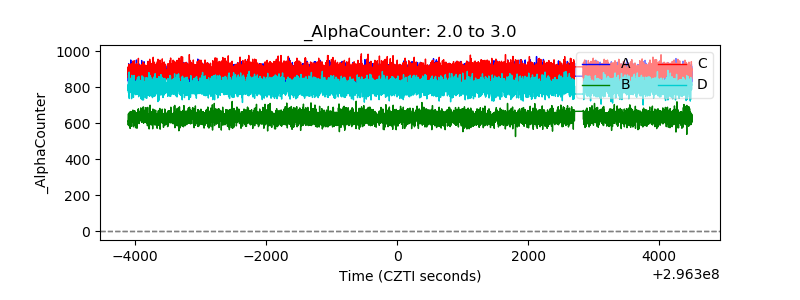 |
| _CPM_Rate | 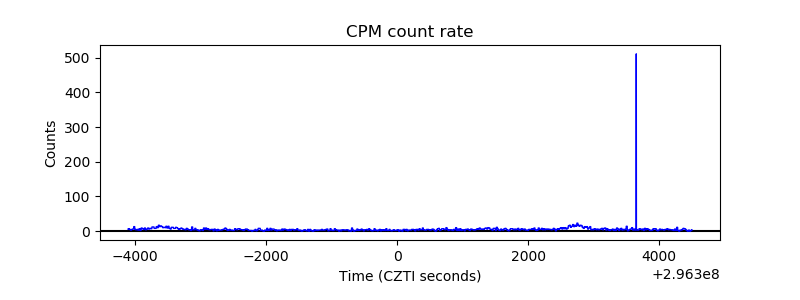 |
| CZT Counter | 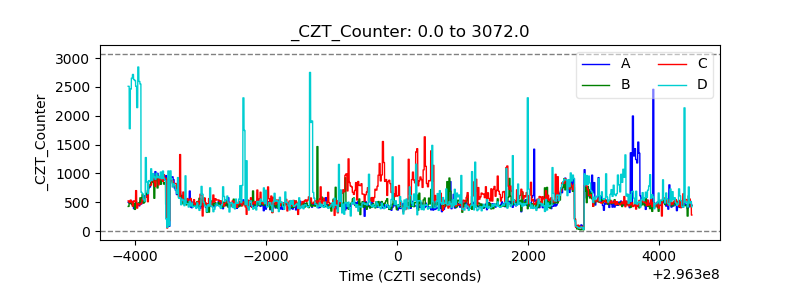 |
| +2.5 Volts monitor |  |
| +5 Volts monitor | 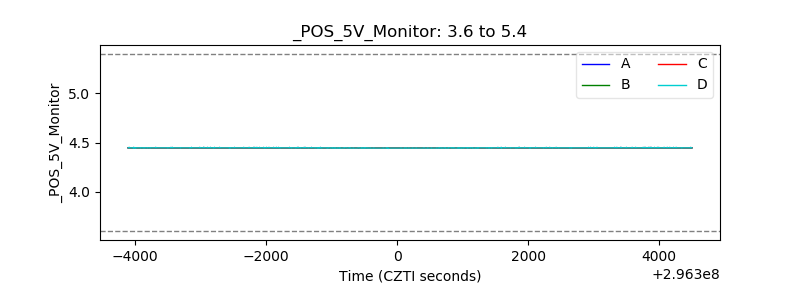 |
| _ROLL_ROT | 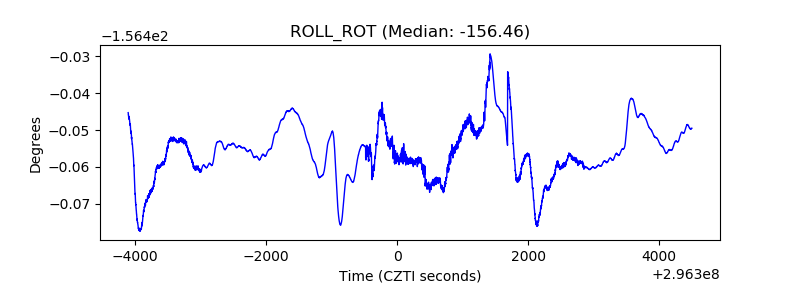 |
| _Roll_DEC | 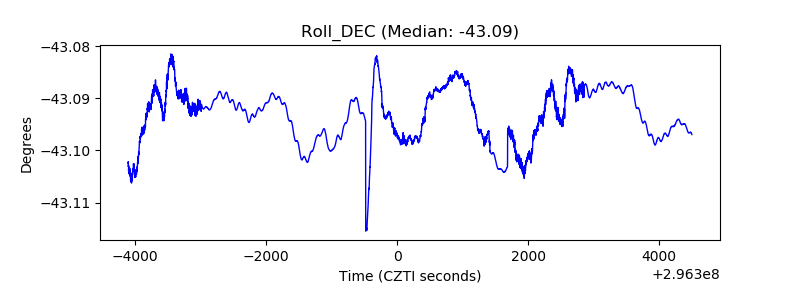 |
| _Roll_RA | 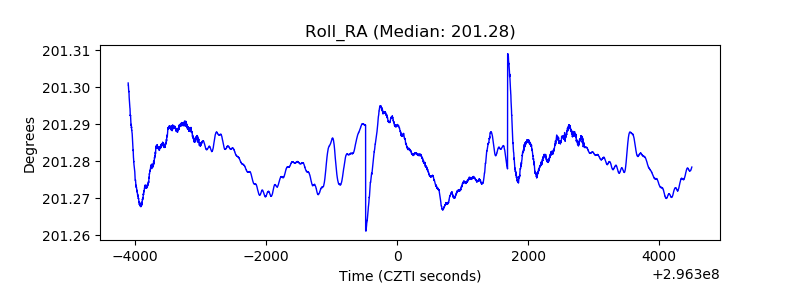 |
| Veto Counter | 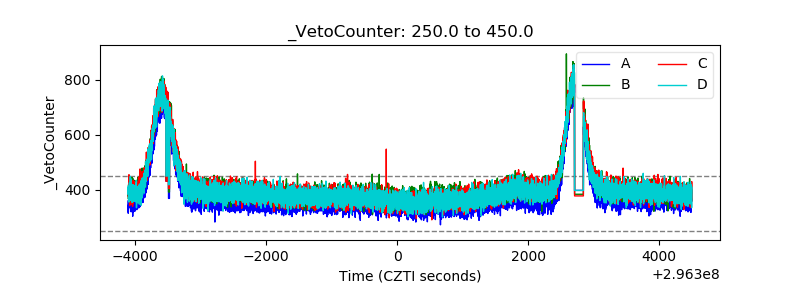 |