| Param | Original file | Final file |
|---|---|---|
| Filename | modeM0/AS1A05_013T01_9000002944_19737cztM0_level2.evt | modeM0/AS1A05_013T01_9000002944_19737cztM0_level2_quad_clean.evt |
| Size (bytes) | 409,717,440 | 67,262,400 |
| Size | 390.7 MB | 64.1 MB |
| Events in quadrant A | 2,645,307 | 430,481 |
| Events in quadrant B | 2,677,010 | 433,843 |
| Events in quadrant C | 2,577,433 | 414,314 |
| Events in quadrant D | 4,149,803 | 388,841 |
| Mode SS | |||
|---|---|---|---|
| Quadrant | BADHDUFLAG | Total packets | Discarded packets |
| A | 0 | 108 | 0 |
| B | 0 | 108 | 0 |
| C | 0 | 108 | 0 |
| D | 0 | 108 | 0 |
| Mode M0 | |||
|---|---|---|---|
| Quadrant | BADHDUFLAG | Total packets | Discarded packets |
| A | 0 | 11477 | 1 |
| B | 0 | 11383 | 1 |
| C | 0 | 11077 | 1 |
| D | 0 | 15881 | 1 |
| Mode M9 | |||
|---|---|---|---|
| Quadrant | BADHDUFLAG | Total packets | Discarded packets |
| A | 0 | 1 | 0 |
| B | 0 | 1 | 0 |
| C | 0 | 1 | 0 |
| D | 0 | 1 | 0 |
| Quadrant | Total seconds | Saturated seconds | Saturation percentage |
|---|---|---|---|
| A | 5266 | 274 | 5.203190% |
| B | 5267 | 249 | 4.727549% |
| C | 5267 | 245 | 4.651604% |
| D | 5267 | 527 | 10.005696% |
Noise dominated data is calculated using 1-second bins in cleaned event files. If a bin has >2000 counts, and if more than 50% of those come from <1% of pixels, then it is considered to be noise-dominated and hence unusable.
| Quadrant | # 1 sec bins | Bins with >0 counts | Bins with >2000 counts | High rate bins dominated by noise | Noise dominated (total time) | Noise dominated (detector-on time) | Marked lightcurve |
|---|---|---|---|---|---|---|---|
| A | 5401 | 5266 | 41 | 41 | 0.76% | 0.78% | 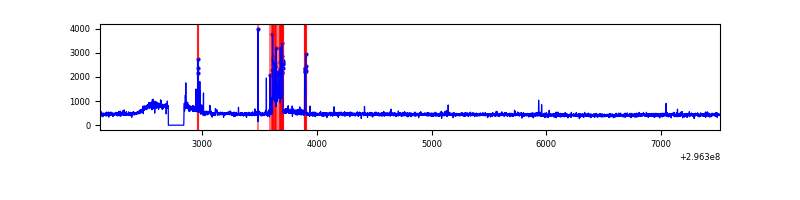 |
| B | 5402 | 5267 | 7 | 7 | 0.13% | 0.13% | 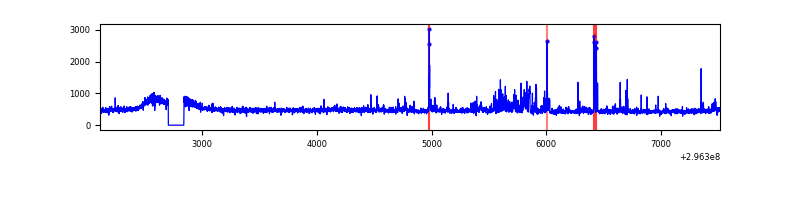 |
| C | 5402 | 5267 | 0 | 0 | 0.00% | 0.00% | 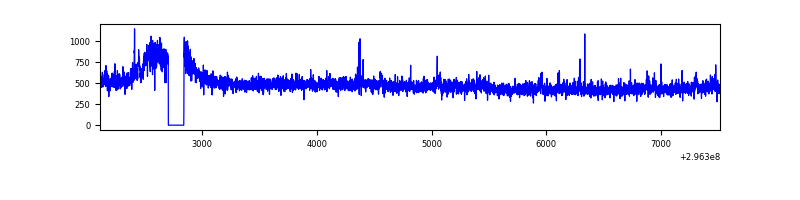 |
| D | 5402 | 5267 | 298 | 298 | 5.52% | 5.66% | 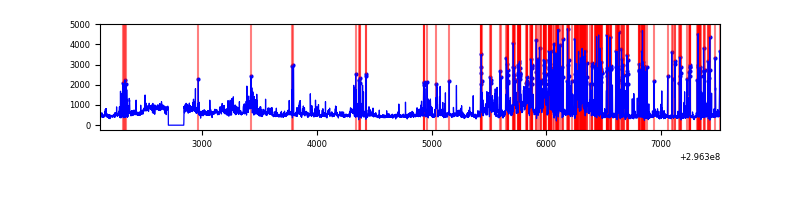 |
Top three noisy pixels from each quadrant. If the there are fewer than three noisy pixels in the level2.evt file, extra rows are filled as -1
| Pixel properties | Quadrant properties | ||||||
|---|---|---|---|---|---|---|---|
| Quadrant | DetID | PixID | Counts | Sigma | Mean | Median | Sigma |
| A | 0 | 254 | 188059 | 1428.21 | 632 | 616 | 131.2 |
| A | 9 | 143 | 21637 | 160.17 | 632 | 616 | 131.2 |
| A | 0 | 226 | 5553 | 37.62 | 632 | 616 | 131.2 |
| B | 4 | 216 | 101732 | 823.55 | 632 | 614 | 122.8 |
| B | 7 | 220 | 47213 | 379.52 | 632 | 614 | 122.8 |
| B | 0 | 197 | 15688 | 122.77 | 632 | 614 | 122.8 |
| C | 3 | 233 | 112929 | 785.25 | 606 | 608 | 143.0 |
| C | 14 | 238 | 93976 | 652.74 | 606 | 608 | 143.0 |
| C | 7 | 247 | 9615 | 62.97 | 606 | 608 | 143.0 |
| D | 1 | 52 | 1253303 | 8350.76 | 607 | 586 | 150.0 |
| D | 9 | 1 | 225000 | 1495.97 | 607 | 586 | 150.0 |
| D | 12 | 218 | 171495 | 1139.3 | 607 | 586 | 150.0 |
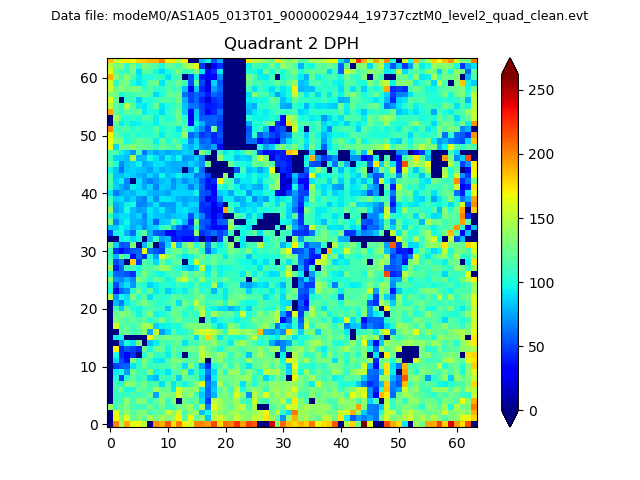
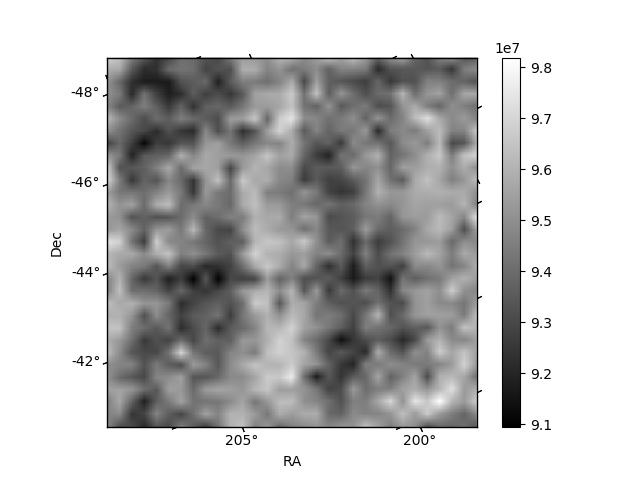
Histogram calculated using DETX and DETY for each event in the final _common_clean file
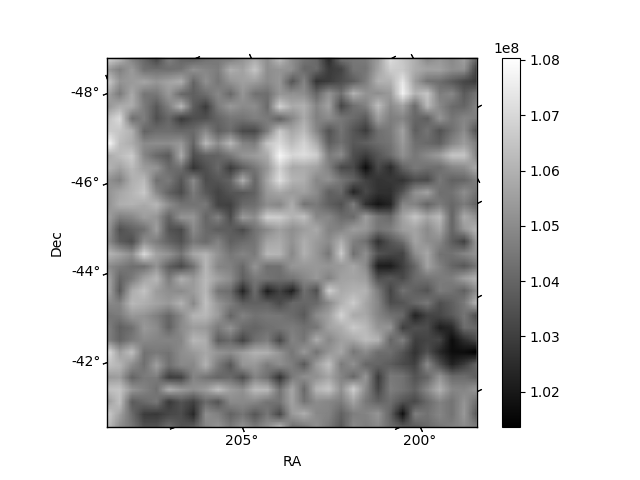
| Quadrant A | 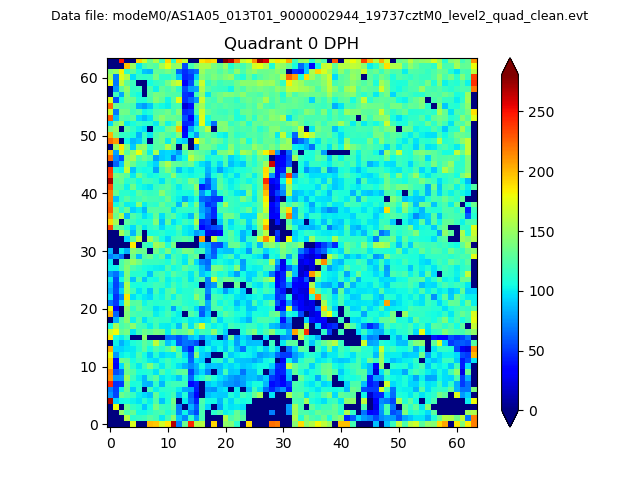 |
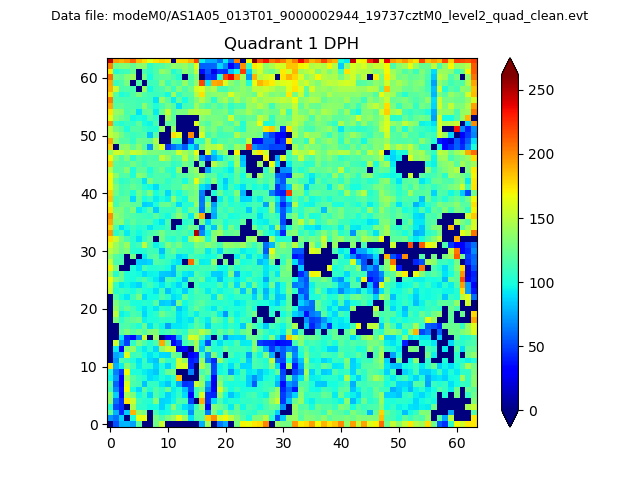 |
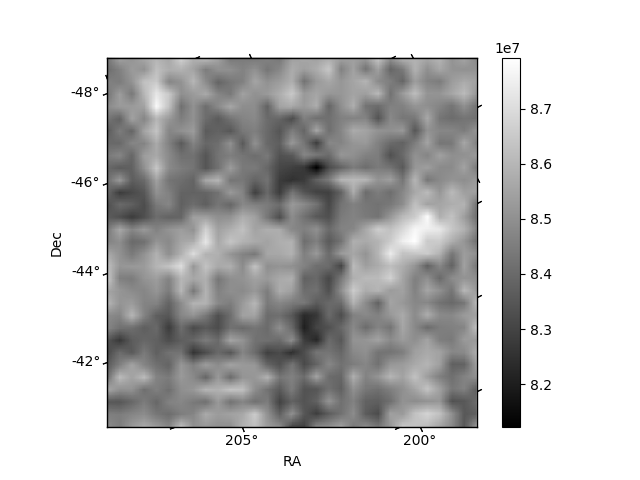
Quadrant B |
|---|---|---|---|
| Quadrant D | 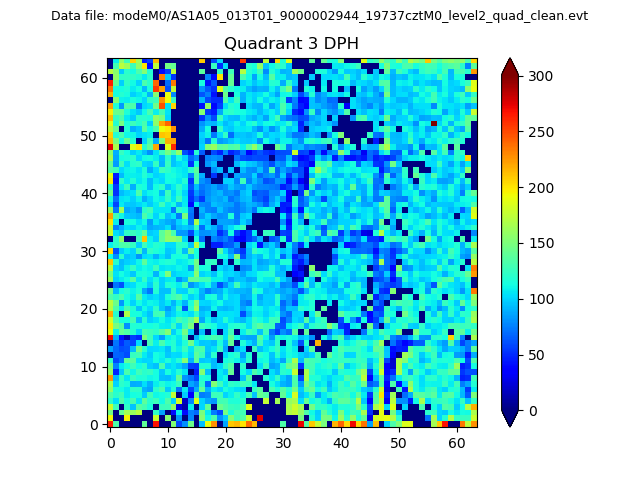 |
 |
Quadrant C |
| Plot type | Count rate plots | Images |
|---|---|---|
| Comparison with Poisson distribution Blue bars denote a histogram of data divided into 1 sec bins. Red curve is a Poisson curve with rate = median count rate of data. |
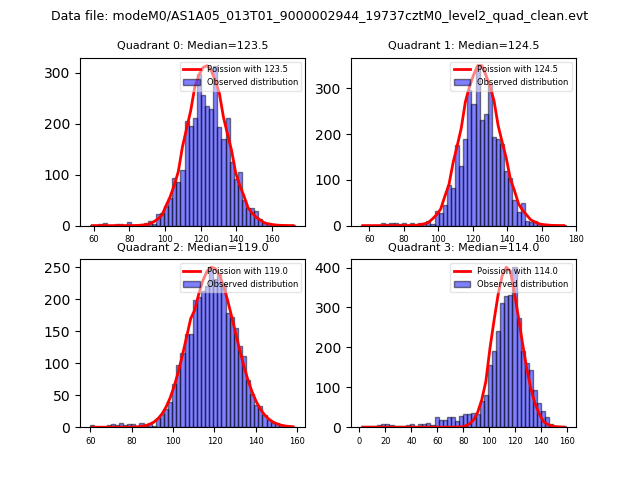 |
 |
| Quadrant-wise count rates Data is divided into 100 sec bins |
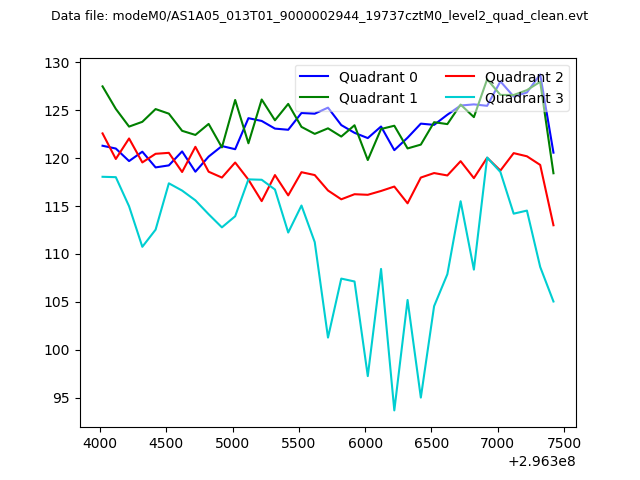 |
|
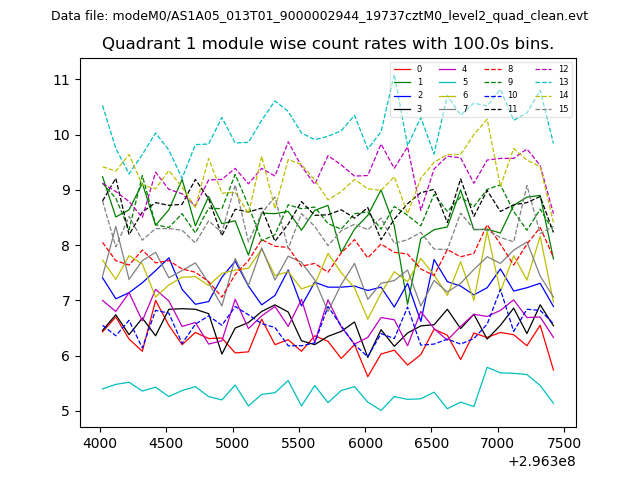
| Module-wise count rates for Quadrant A Data is divided into 100 sec bins |
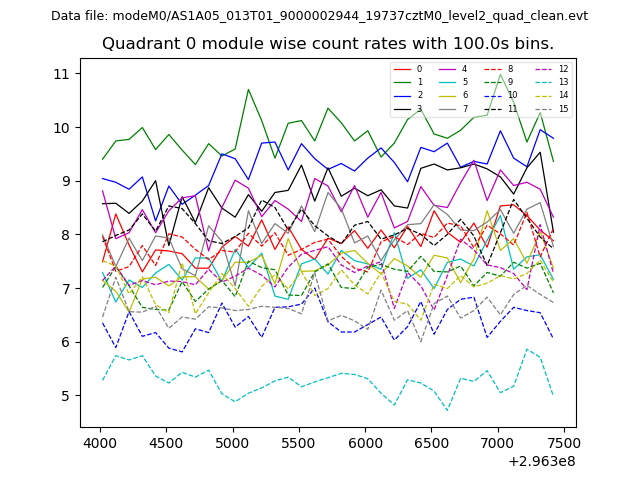 |
 |
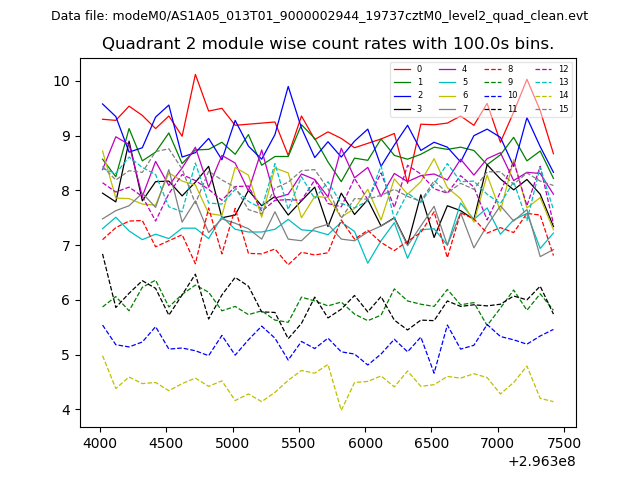
| Module-wise count rates for Quadrant B Data is divided into 100 sec bins |
 |
 |
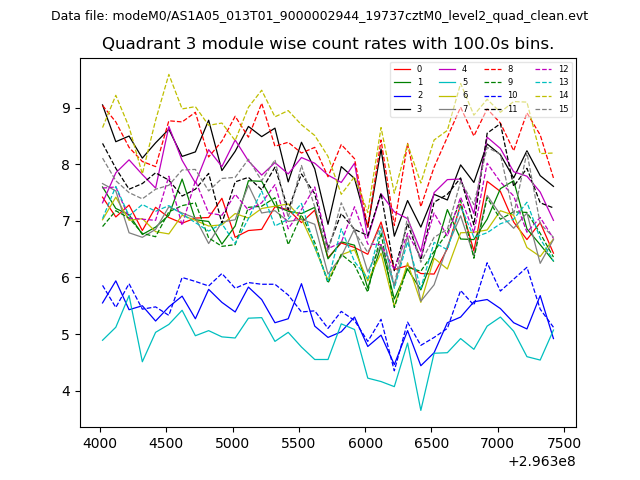
| Module-wise count rates for Quadrant C Data is divided into 100 sec bins |
 |
 |
| Module-wise count rates for Quadrant D Data is divided into 100 sec bins |
 |
 |
| Parameter | Plot |
|---|---|
| CZT HV Monitor | 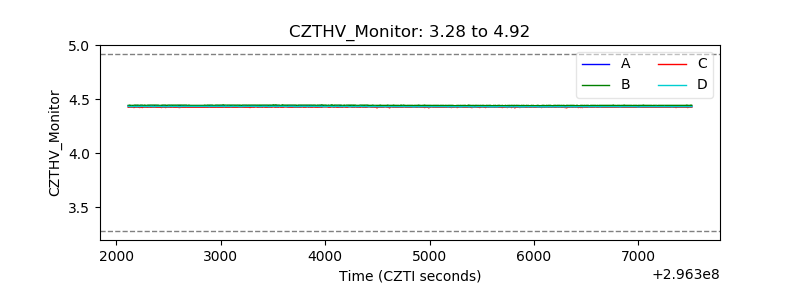 |
| D_VDD | 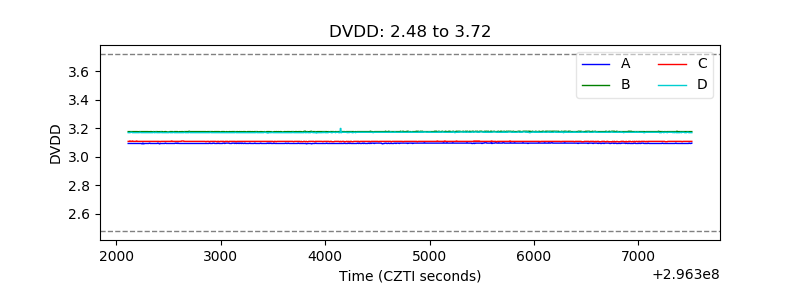 |
| Temperature 1 | 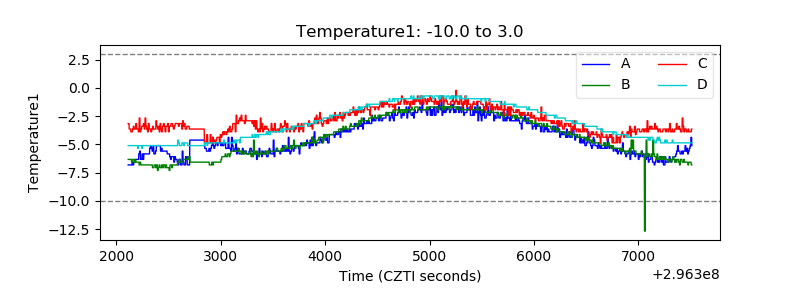 |
| Veto HV Monitor |  |
| Veto LLD | 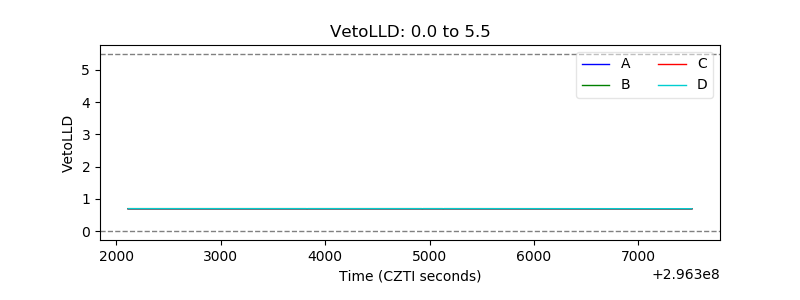 |
| Alpha Counter | 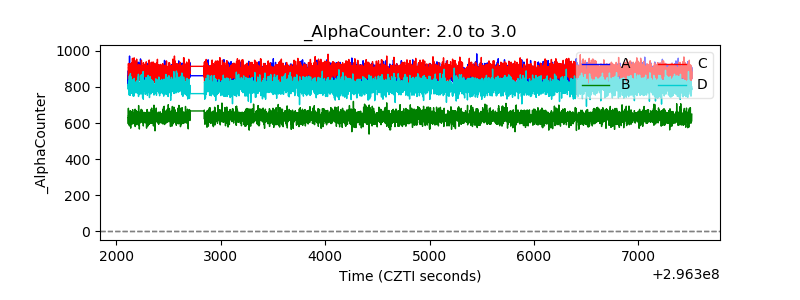 |
| _CPM_Rate | 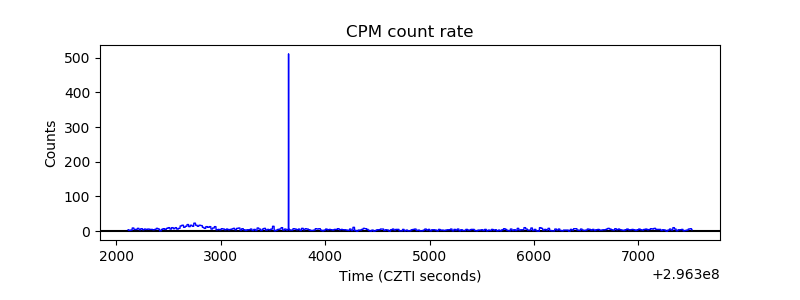 |
| CZT Counter |  |
| +2.5 Volts monitor |  |
| +5 Volts monitor |  |
| _ROLL_ROT | 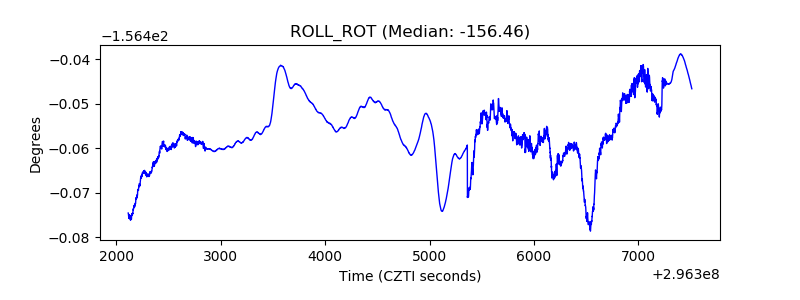 |
| _Roll_DEC | 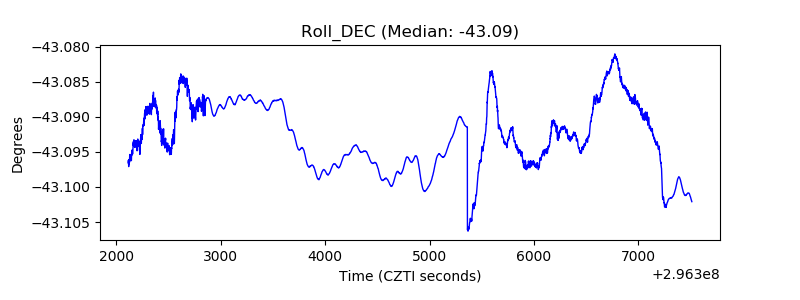 |
| _Roll_RA | 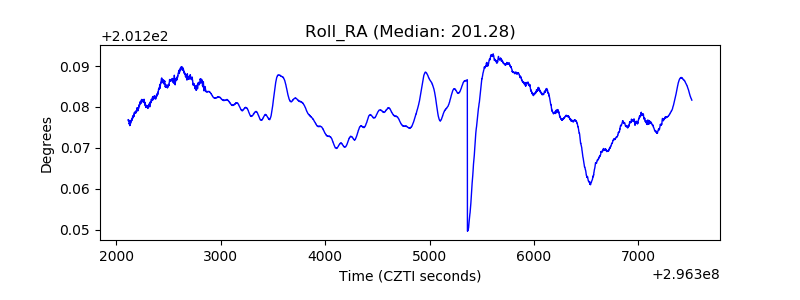 |
| Veto Counter | 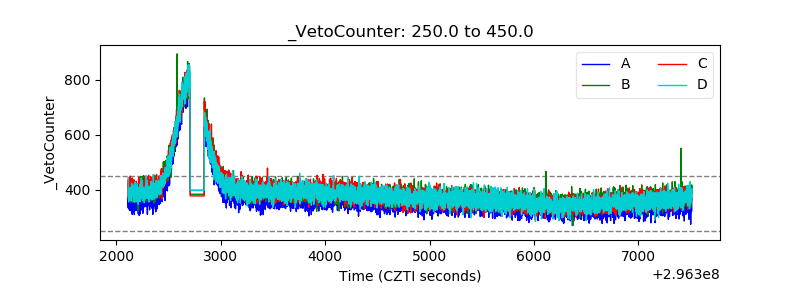 |