| Param | Original file | Final file |
|---|---|---|
| Filename | modeM0/AS1A05_075T03_9000002940cztM0_level2.fits | modeM0/AS1A05_075T03_9000002940cztM0_level2_quad_clean.evt |
| Size (bytes) | 127,805,760 | 127,333,440 |
| Size | 121.9 MB | 121.4 MB |
| Events in quadrant A | 770,508 | 767,648 |
| Events in quadrant B | 745,778 | 763,983 |
| Events in quadrant C | 752,870 | 721,076 |
| Events in quadrant D | 641,838 | 643,645 |
| Mode M0 | |||
|---|---|---|---|
| Quadrant | BADHDUFLAG | Total packets | Discarded packets |
| A | 0 | 28957 | 0 |
| B | 0 | 29093 | 0 |
| C | 0 | 28550 | 0 |
| D | 0 | 37400 | 0 |
| Mode M9 | |||
|---|---|---|---|
| Quadrant | BADHDUFLAG | Total packets | Discarded packets |
| A | 0 | 8 | 0 |
| B | 0 | 8 | 0 |
| C | 0 | 8 | 0 |
| D | 0 | 8 | 0 |
| Mode SS | |||
|---|---|---|---|
| Quadrant | BADHDUFLAG | Total packets | Discarded packets |
| A | 0 | 284 | 0 |
| B | 0 | 284 | 0 |
| C | 0 | 284 | 0 |
| D | 0 | 284 | 0 |
| Quadrant | Total seconds | Saturated seconds | Saturation percentage |
|---|---|---|---|
| A | 13892 | 183 | 1.317305% |
| B | 13892 | 216 | 1.554852% |
| C | 13892 | 240 | 1.727613% |
| D | 13892 | 868 | 6.248200% |
Noise dominated data is calculated using 1-second bins in cleaned event files. If a bin has >2000 counts, and if more than 50% of those come from <1% of pixels, then it is considered to be noise-dominated and hence unusable.
| Quadrant | # 1 sec bins | Bins with >0 counts | Bins with >2000 counts | High rate bins dominated by noise | Noise dominated (total time) | Noise dominated (detector-on time) | Marked lightcurve |
|---|---|---|---|---|---|---|---|
| A | 14667 | 13890 | 0 | 0 | 0.00% | 0.00% | 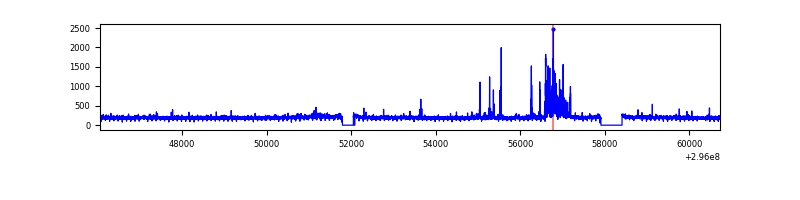 |
| B | 14667 | 13889 | 0 | 0 | 0.00% | 0.00% | 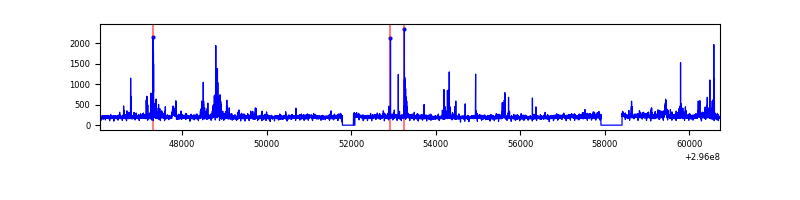 |
| C | 14667 | 13891 | 0 | 0 | 0.00% | 0.00% | 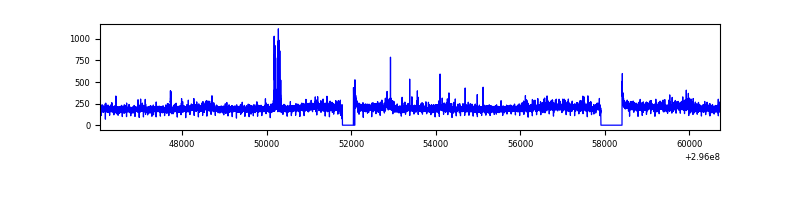 |
| D | 14667 | 13881 | 0 | 0 | 0.00% | 0.00% | 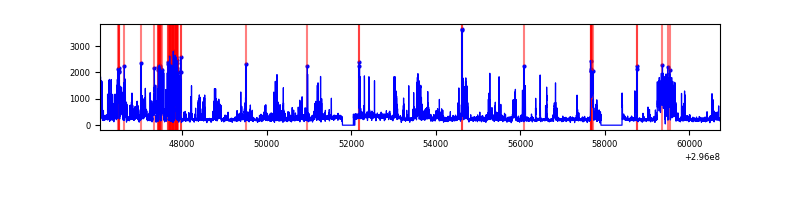 |
Top three noisy pixels from each quadrant. If the there are fewer than three noisy pixels in the level2.evt file, extra rows are filled as -1
| Pixel properties | Quadrant properties | ||||||
|---|---|---|---|---|---|---|---|
| Quadrant | DetID | PixID | Counts | Sigma | Mean | Median | Sigma |
| A | 0 | 29 | 746 | 10.6 | 200 | 187 | 52.7 |
| A | 7 | 110 | 604 | 7.91 | 200 | 187 | 52.7 |
| A | 9 | 19 | 594 | 7.72 | 200 | 187 | 52.7 |
| B | 2 | 9 | 567 | 9.29 | 196 | 186 | 41.0 |
| B | 2 | 8 | 528 | 8.33 | 196 | 186 | 41.0 |
| B | 3 | 17 | 526 | 8.29 | 196 | 186 | 41.0 |
| C | 3 | 158 | 549 | 6.91 | 198 | 185 | 52.7 |
| C | 12 | 241 | 536 | 6.66 | 198 | 185 | 52.7 |
| C | 12 | 250 | 534 | 6.62 | 198 | 185 | 52.7 |
| D | 3 | 14 | 502 | 6.66 | 183 | 167 | 50.3 |
| D | 6 | 67 | 454 | 5.71 | 183 | 167 | 50.3 |
| D | 7 | 5 | 453 | 5.69 | 183 | 167 | 50.3 |
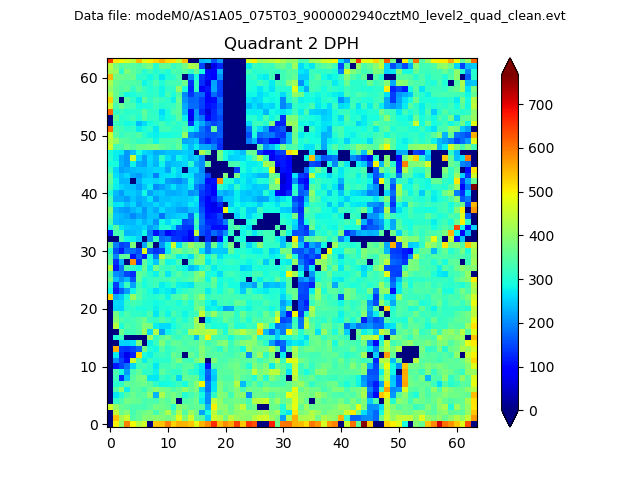
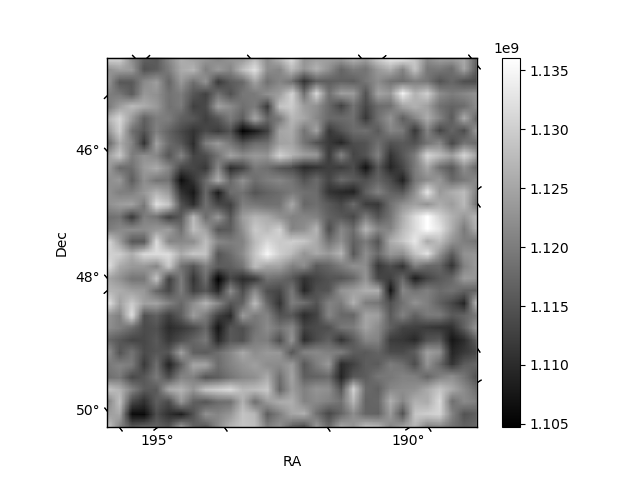
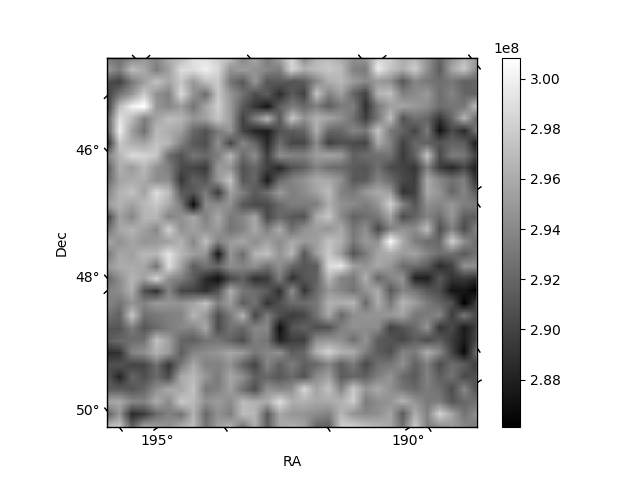
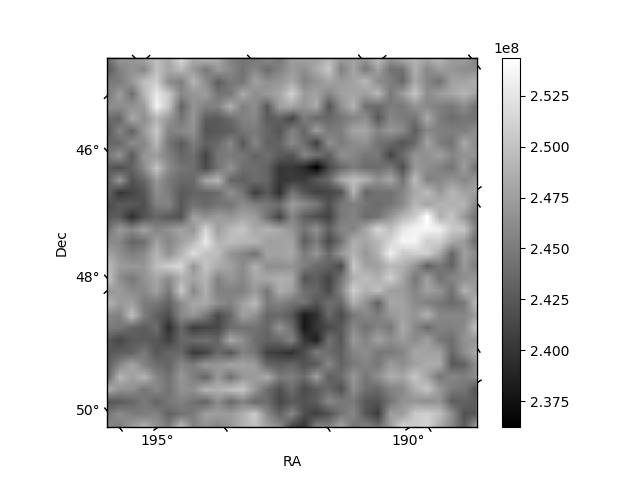
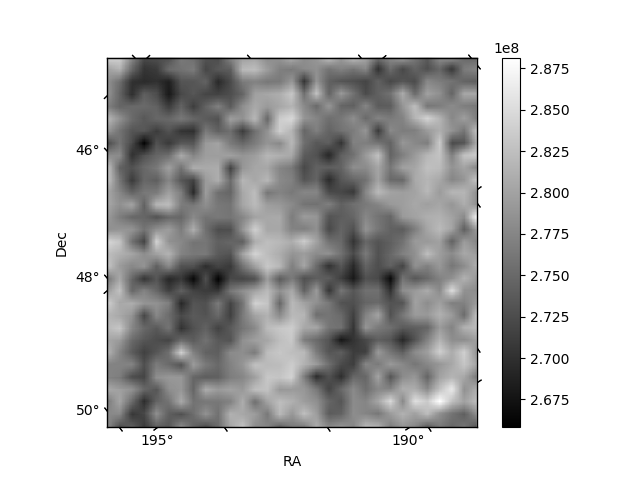
Histogram calculated using DETX and DETY for each event in the final _common_clean file
| Quadrant A | 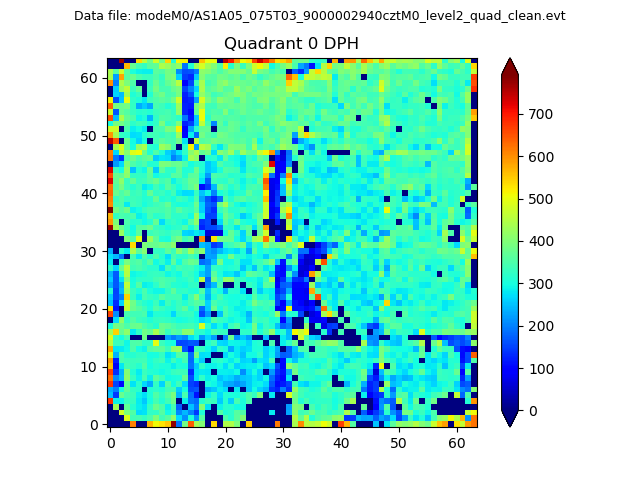 |
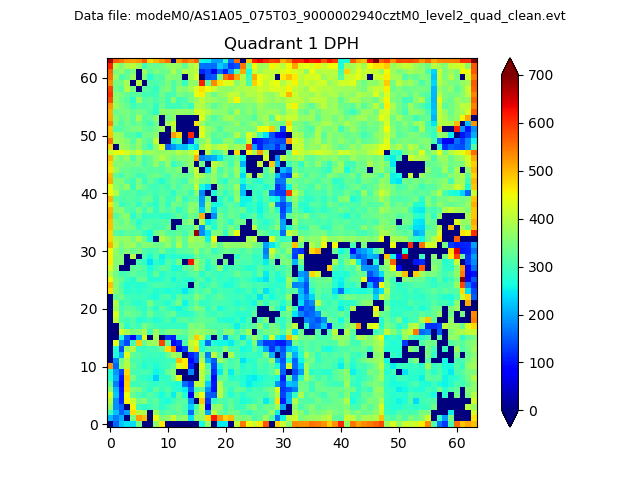 |
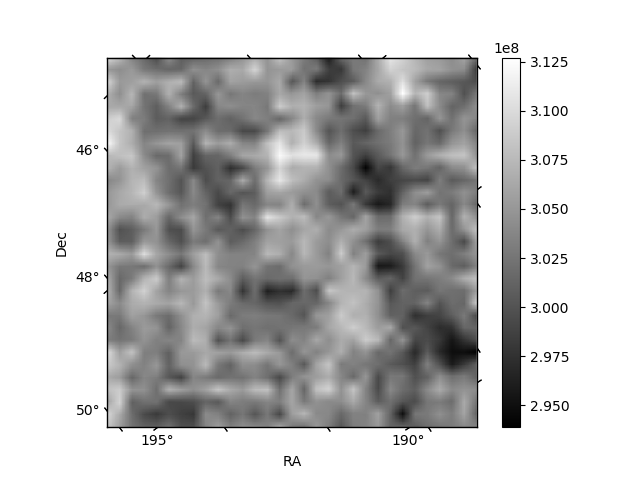
Quadrant B |
|---|---|---|---|
| Quadrant D | 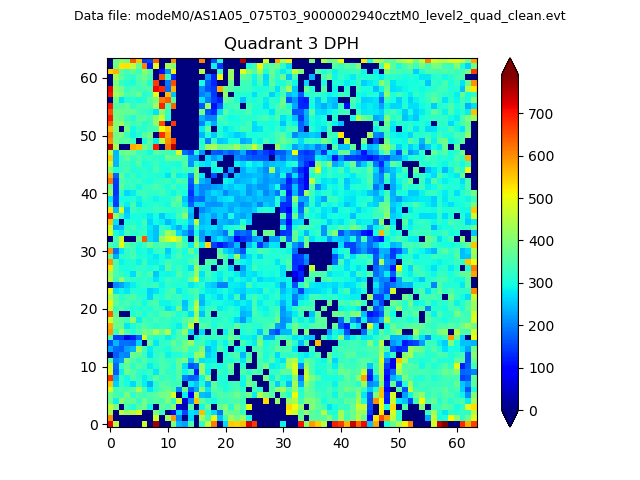 |
 |
Quadrant C |
| Plot type | Count rate plots | Images |
|---|---|---|
| Comparison with Poisson distribution Blue bars denote a histogram of data divided into 1 sec bins. Red curve is a Poisson curve with rate = median count rate of data. |
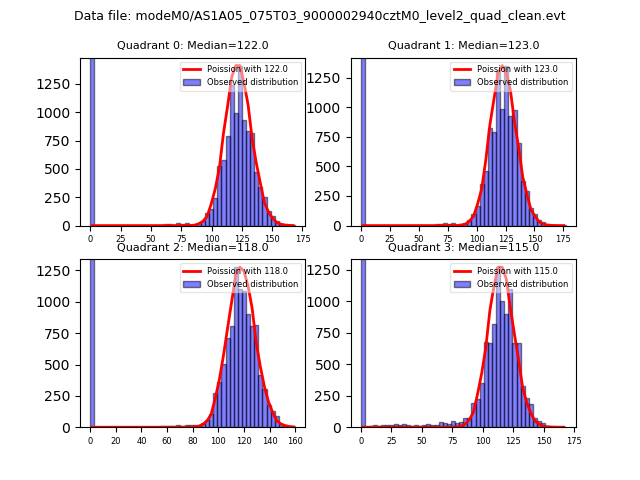 |
 |
| Quadrant-wise count rates Data is divided into 100 sec bins |
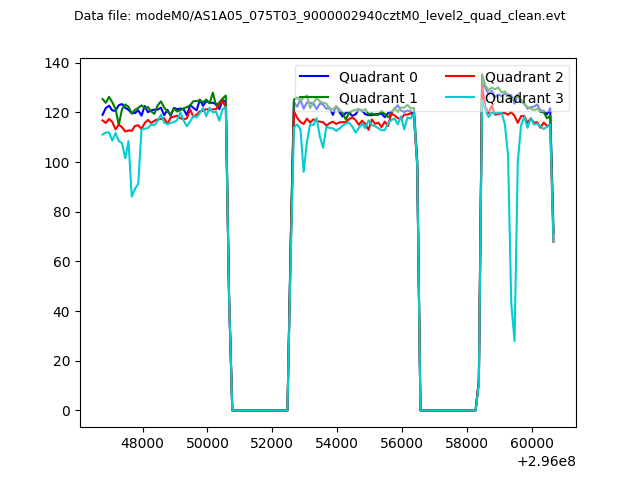 |
|
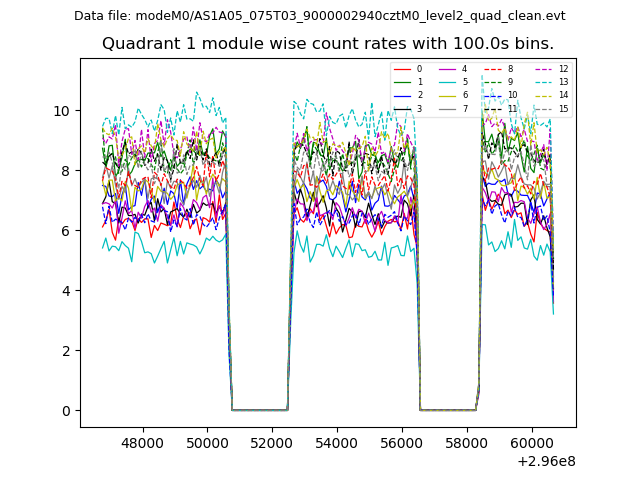
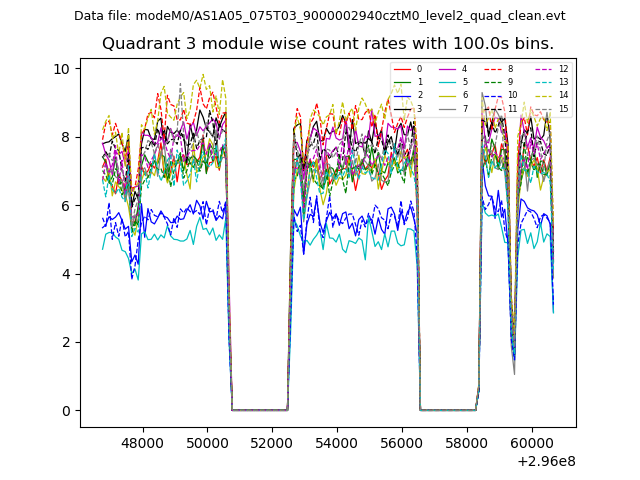
| Module-wise count rates for Quadrant A Data is divided into 100 sec bins |
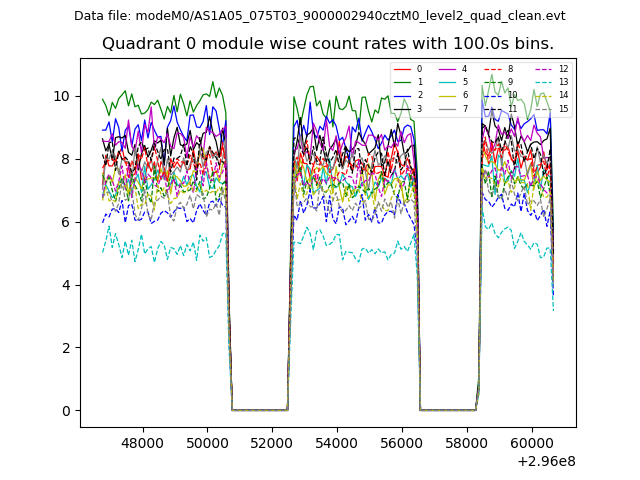 |
 |
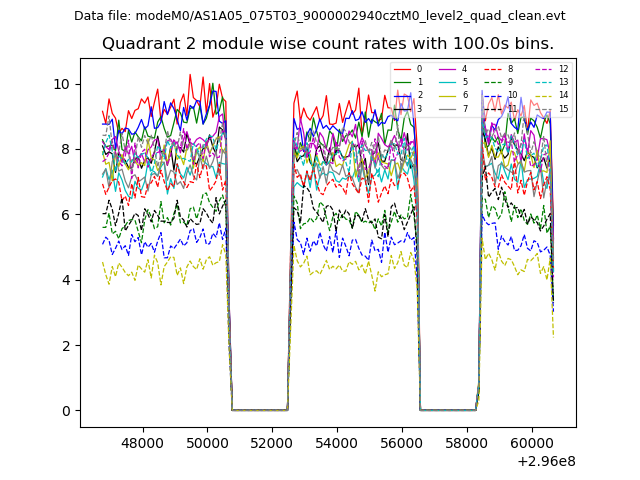
| Module-wise count rates for Quadrant B Data is divided into 100 sec bins |
 |
 |
| Module-wise count rates for Quadrant C Data is divided into 100 sec bins |
 |
 |
| Module-wise count rates for Quadrant D Data is divided into 100 sec bins |
 |
 |
| Parameter | Plot |
|---|---|
| CZT HV Monitor | 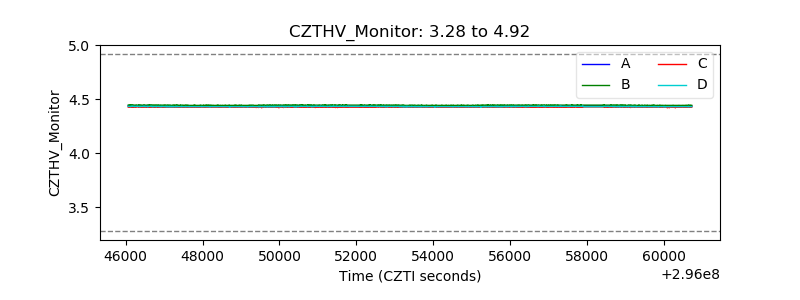 |
| D_VDD | 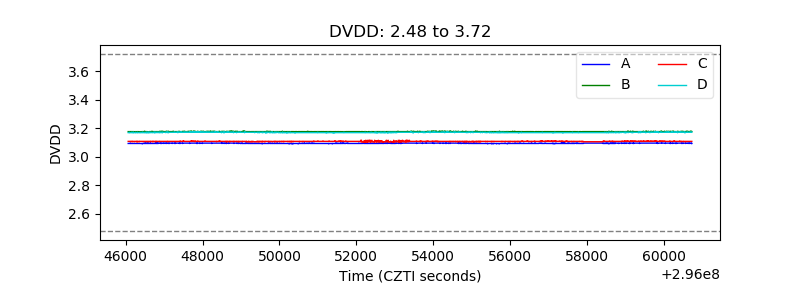 |
| Temperature 1 | 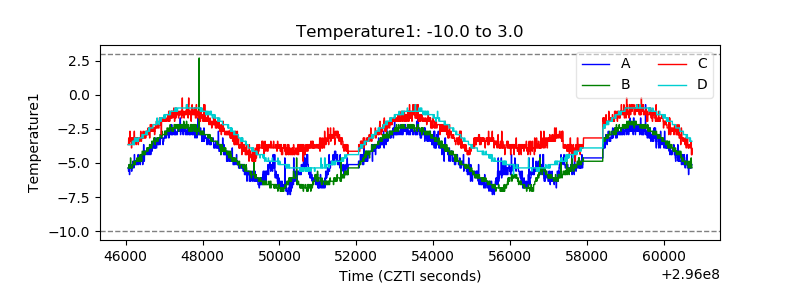 |
| Veto HV Monitor | 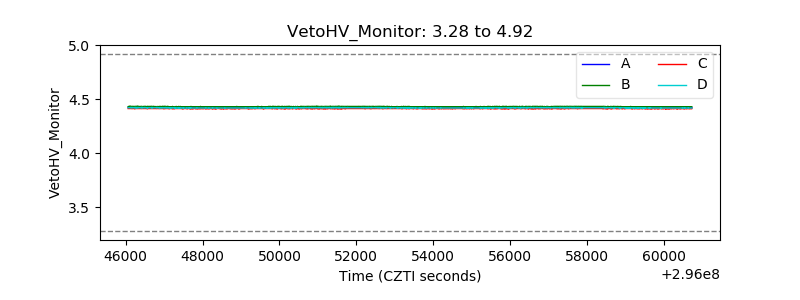 |
| Veto LLD | 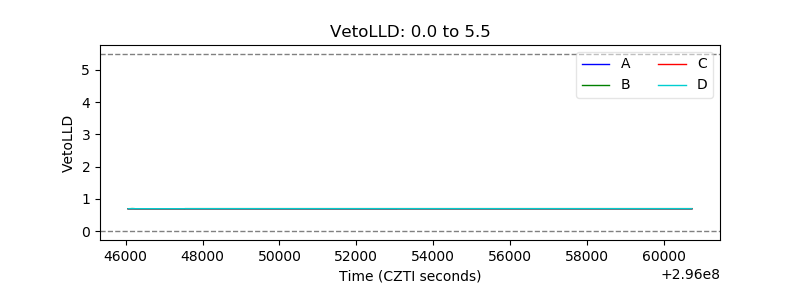 |
| Alpha Counter | 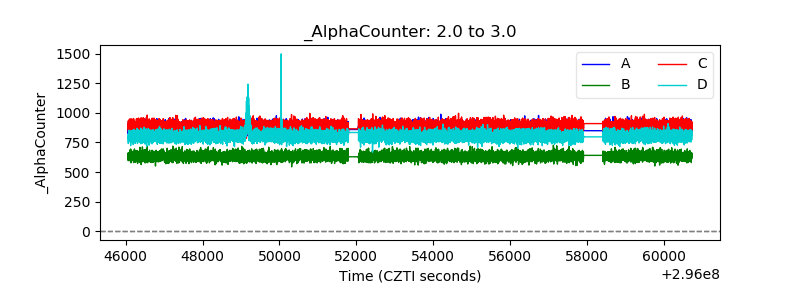 |
| _CPM_Rate | 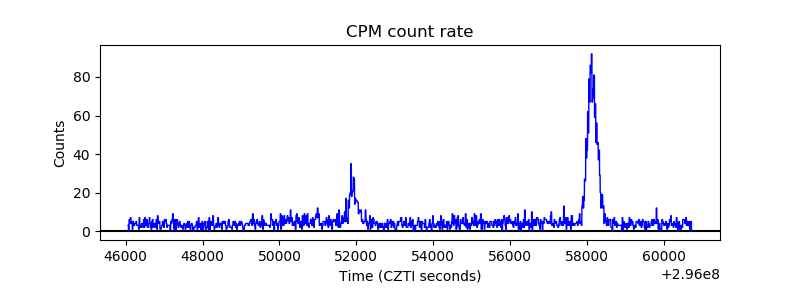 |
| CZT Counter | 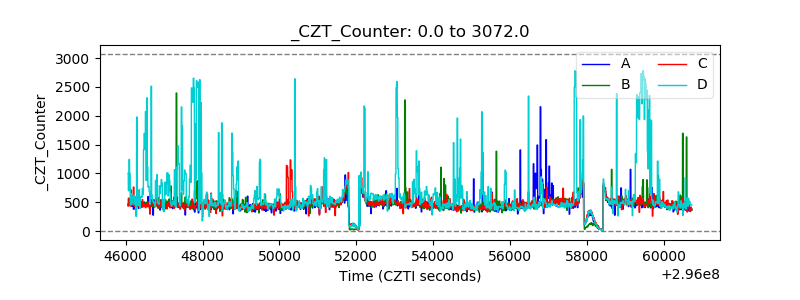 |
| +2.5 Volts monitor | 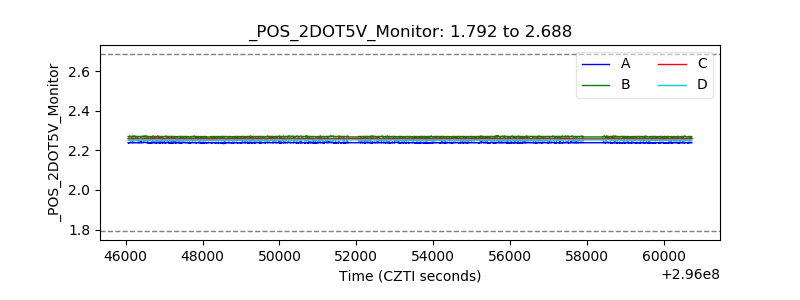 |
| +5 Volts monitor | 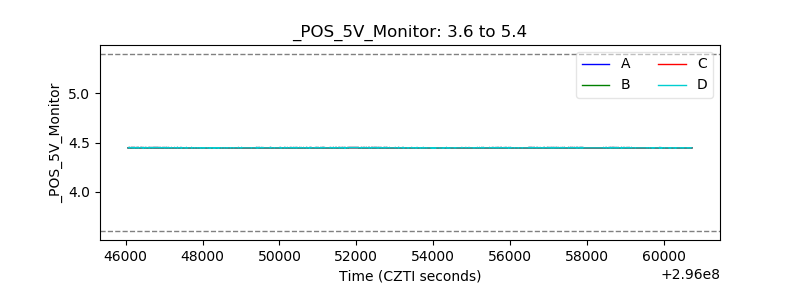 |
| _ROLL_ROT | 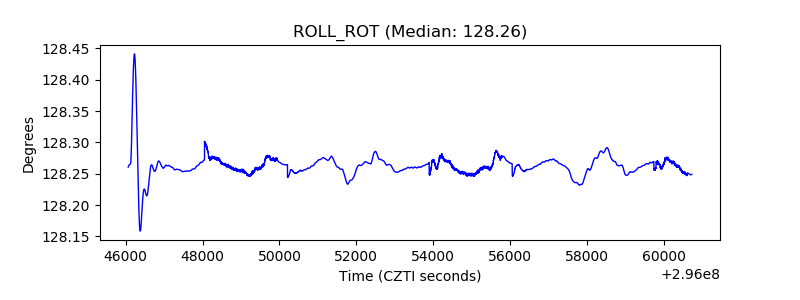 |
| _Roll_DEC | 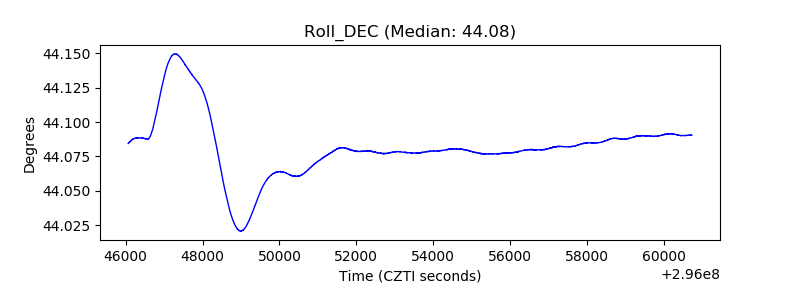 |
| _Roll_RA | 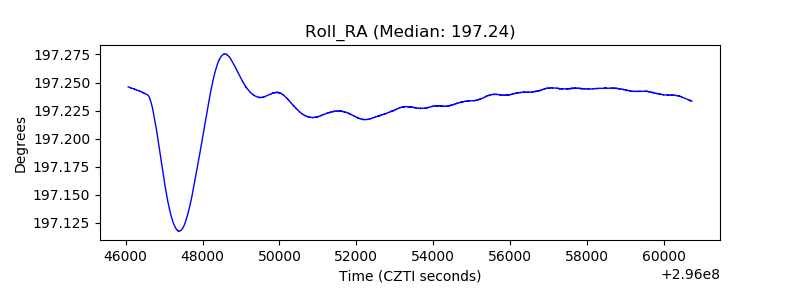 |
| Veto Counter | 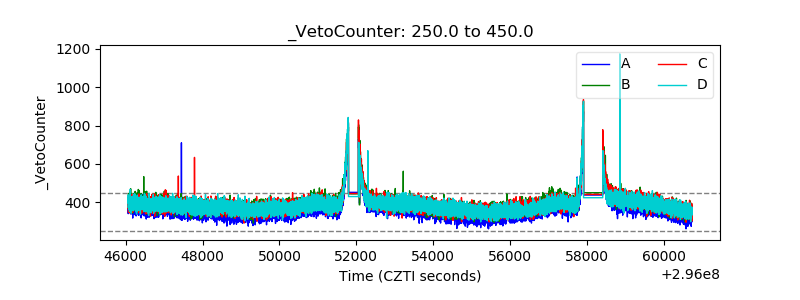 |