| Param | Original file | Final file |
|---|---|---|
| Filename | modeM0/AS1A05_075T03_9000002940_19690cztM0_level2.evt | modeM0/AS1A05_075T03_9000002940_19690cztM0_level2_quad_clean.evt |
| Size (bytes) | 104,777,280 | 13,351,680 |
| Size | 99.9 MB | 12.7 MB |
| Events in quadrant A | 631,798 | 78,122 |
| Events in quadrant B | 682,647 | 78,673 |
| Events in quadrant C | 623,849 | 74,115 |
| Events in quadrant D | 1,140,164 | 71,583 |
| Mode M0 | |||
|---|---|---|---|
| Quadrant | BADHDUFLAG | Total packets | Discarded packets |
| A | 0 | 2707 | 0 |
| B | 0 | 2830 | 0 |
| C | 0 | 2705 | 0 |
| D | 0 | 4293 | 0 |
| Mode SS | |||
|---|---|---|---|
| Quadrant | BADHDUFLAG | Total packets | Discarded packets |
| A | 0 | 28 | 0 |
| B | 0 | 28 | 0 |
| C | 0 | 28 | 0 |
| D | 0 | 28 | 0 |
| Quadrant | Total seconds | Saturated seconds | Saturation percentage |
|---|---|---|---|
| A | 1349 | 1 | 0.074129% |
| B | 1349 | 17 | 1.260193% |
| C | 1348 | 9 | 0.667656% |
| D | 1348 | 62 | 4.599407% |
Noise dominated data is calculated using 1-second bins in cleaned event files. If a bin has >2000 counts, and if more than 50% of those come from <1% of pixels, then it is considered to be noise-dominated and hence unusable.
| Quadrant | # 1 sec bins | Bins with >0 counts | Bins with >2000 counts | High rate bins dominated by noise | Noise dominated (total time) | Noise dominated (detector-on time) | Marked lightcurve |
|---|---|---|---|---|---|---|---|
| A | 1349 | 1349 | 0 | 0 | 0.00% | 0.00% | 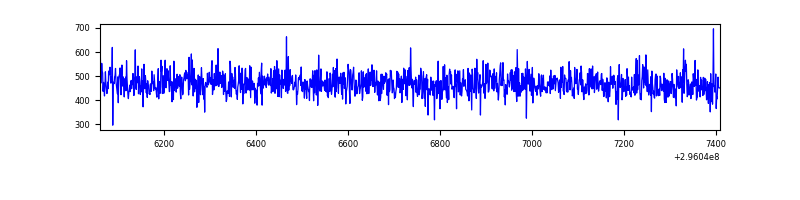 |
| B | 1349 | 1349 | 10 | 10 | 0.74% | 0.74% | 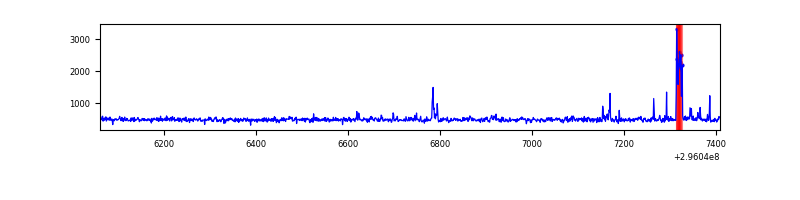 |
| C | 1348 | 1348 | 0 | 0 | 0.00% | 0.00% | 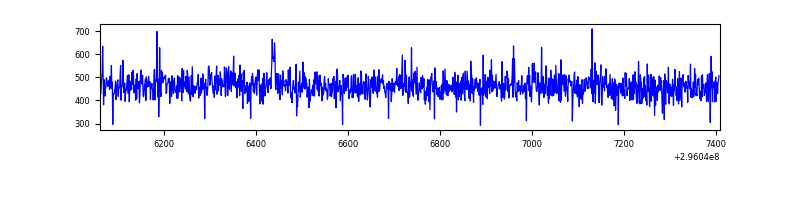 |
| D | 1348 | 1348 | 48 | 48 | 3.56% | 3.56% | 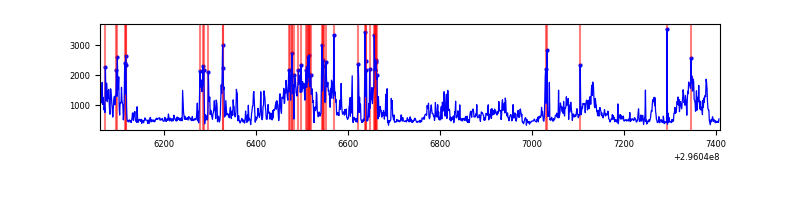 |
Top three noisy pixels from each quadrant. If the there are fewer than three noisy pixels in the level2.evt file, extra rows are filled as -1
| Pixel properties | Quadrant properties | ||||||
|---|---|---|---|---|---|---|---|
| Quadrant | DetID | PixID | Counts | Sigma | Mean | Median | Sigma |
| A | 0 | 226 | 1391 | 34.54 | 164 | 160 | 35.6 |
| A | 3 | 137 | 1382 | 34.29 | 164 | 160 | 35.6 |
| A | 12 | 194 | 1137 | 27.42 | 164 | 160 | 35.6 |
| B | 7 | 220 | 31645 | 946.86 | 160 | 156 | 33.3 |
| B | 0 | 189 | 13870 | 412.38 | 160 | 156 | 33.3 |
| B | 0 | 198 | 4973 | 144.85 | 160 | 156 | 33.3 |
| C | 14 | 238 | 24837 | 663.84 | 152 | 152 | 37.2 |
| C | 8 | 208 | 2105 | 52.51 | 152 | 152 | 37.2 |
| C | 3 | 233 | 1700 | 41.62 | 152 | 152 | 37.2 |
| D | 1 | 52 | 303003 | 7636.92 | 153 | 148 | 39.7 |
| D | 7 | 238 | 243516 | 6136.87 | 153 | 148 | 39.7 |
| D | 2 | 16 | 8404 | 208.19 | 153 | 148 | 39.7 |
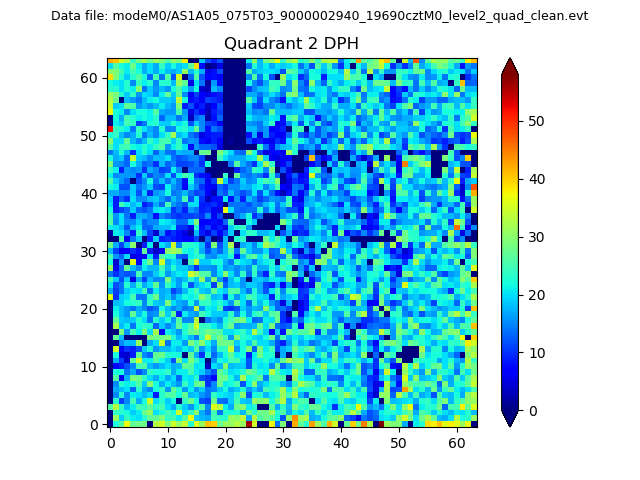
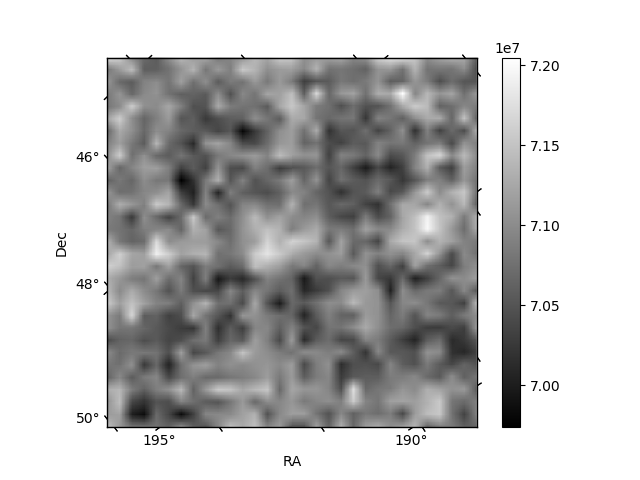
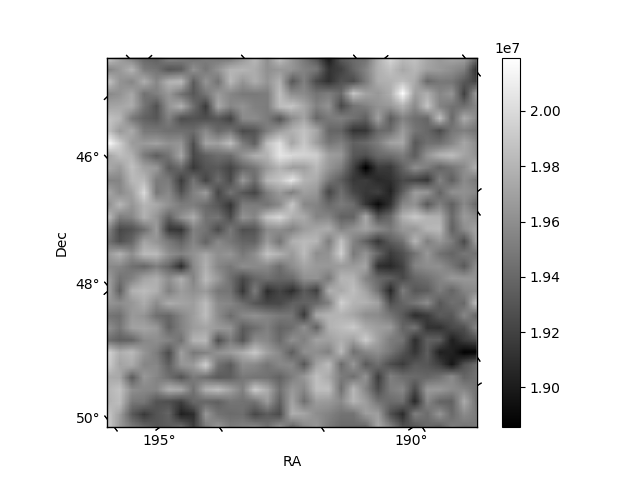
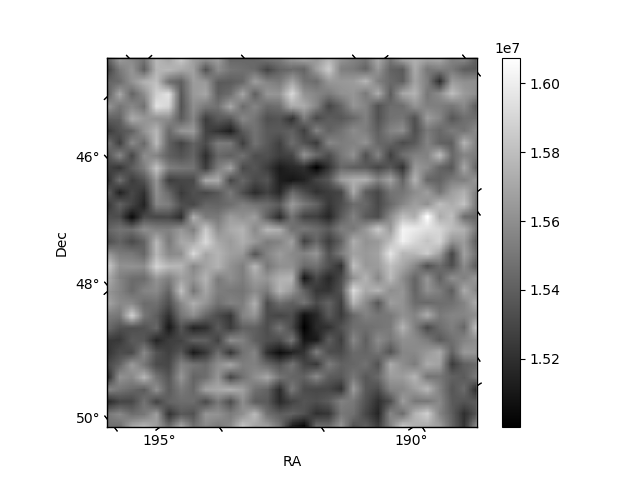
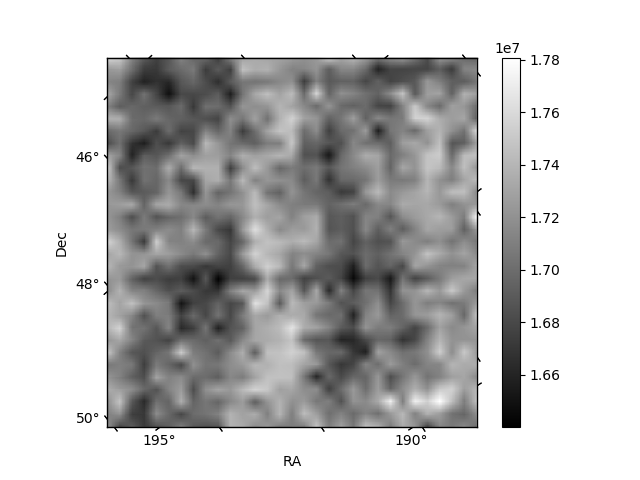
Histogram calculated using DETX and DETY for each event in the final _common_clean file
| Quadrant A |  |
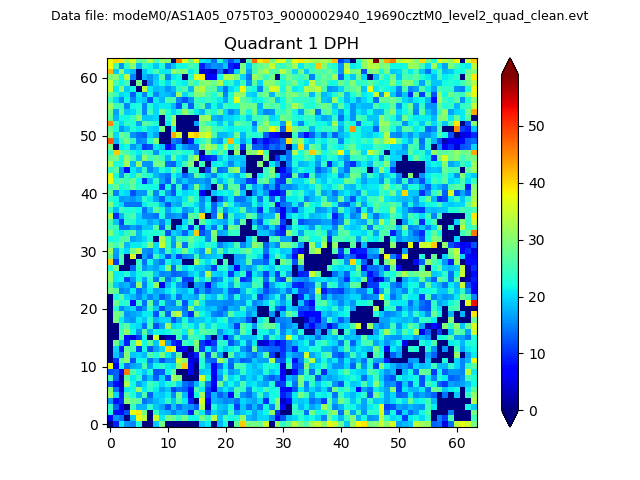 |
Quadrant B |
|---|---|---|---|
| Quadrant D | 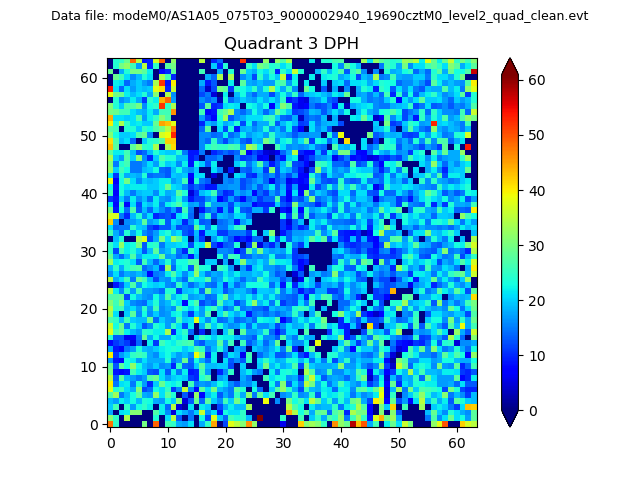 |
 |
Quadrant C |
| Plot type | Count rate plots | Images |
|---|---|---|
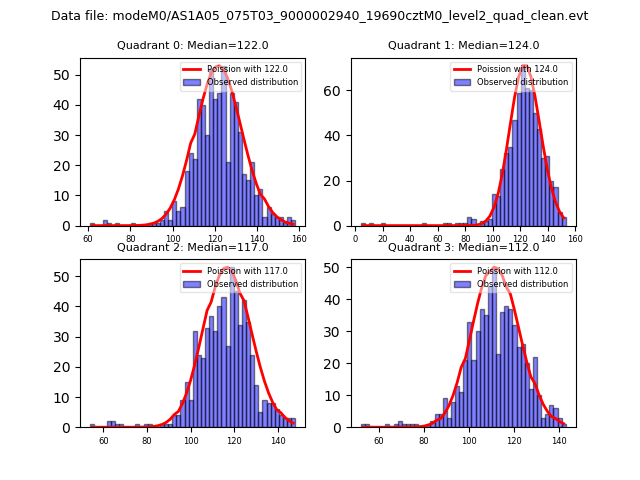
| Comparison with Poisson distribution Blue bars denote a histogram of data divided into 1 sec bins. Red curve is a Poisson curve with rate = median count rate of data. |
 |
 |
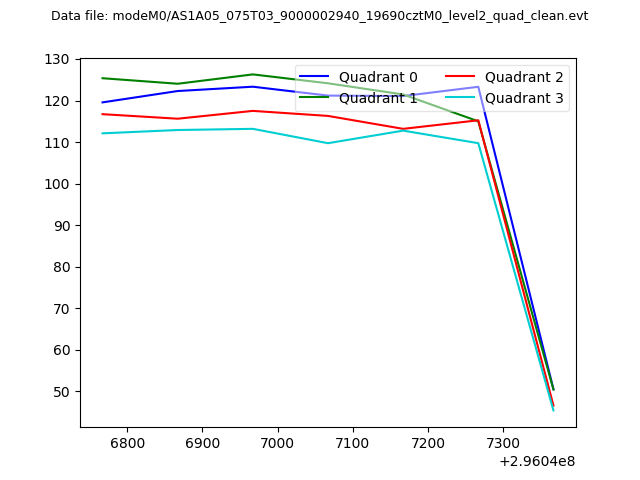
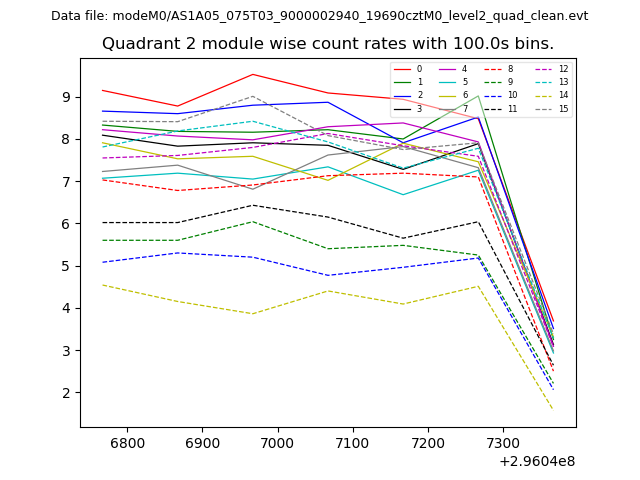
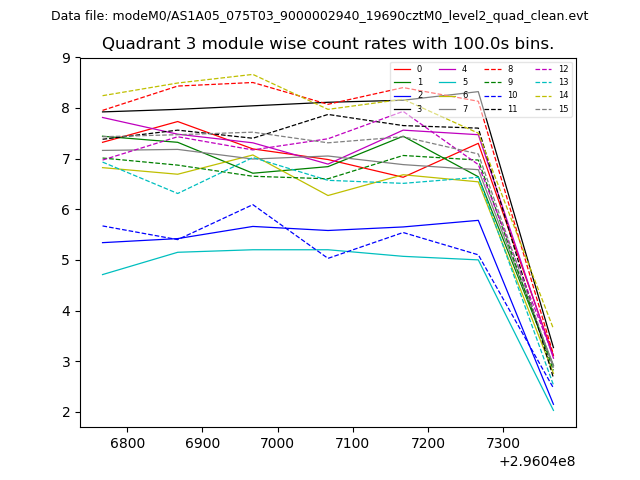
| Quadrant-wise count rates Data is divided into 100 sec bins |
 |
|
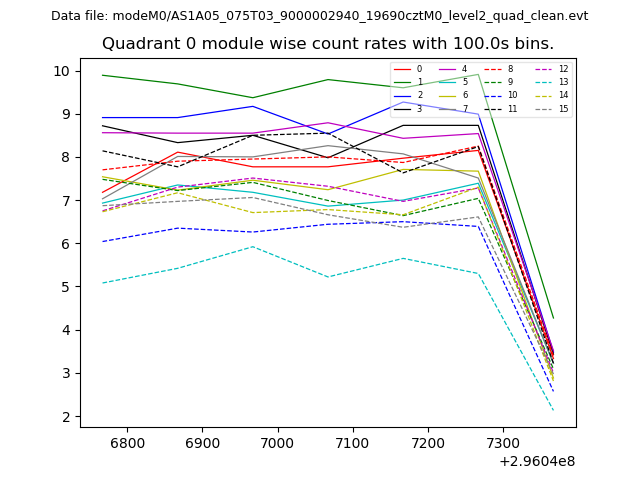
| Module-wise count rates for Quadrant A Data is divided into 100 sec bins |
 |
 |
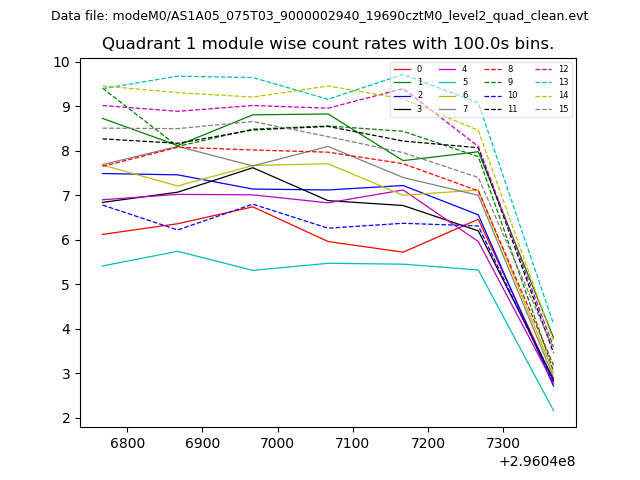
| Module-wise count rates for Quadrant B Data is divided into 100 sec bins |
 |
 |
| Module-wise count rates for Quadrant C Data is divided into 100 sec bins |
 |
 |
| Module-wise count rates for Quadrant D Data is divided into 100 sec bins |
 |
 |
| Parameter | Plot |
|---|---|
| CZT HV Monitor | 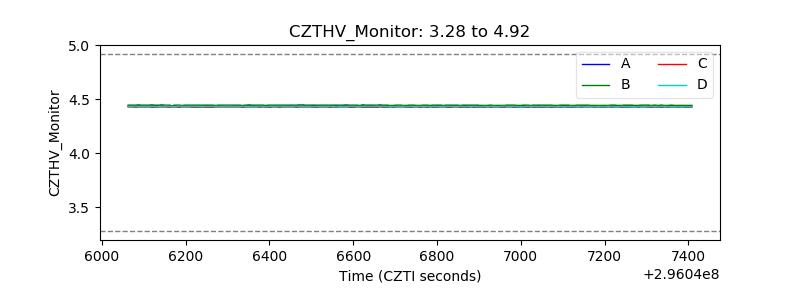 |
| D_VDD | 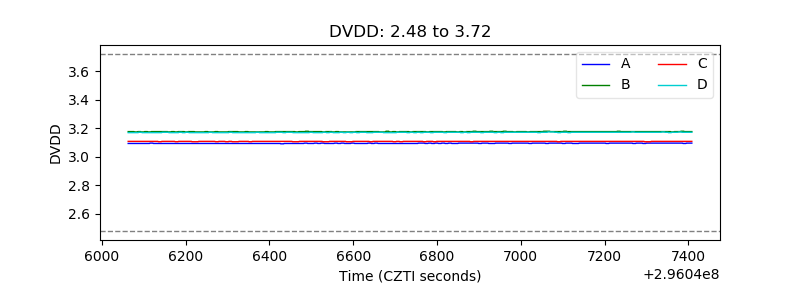 |
| Temperature 1 | 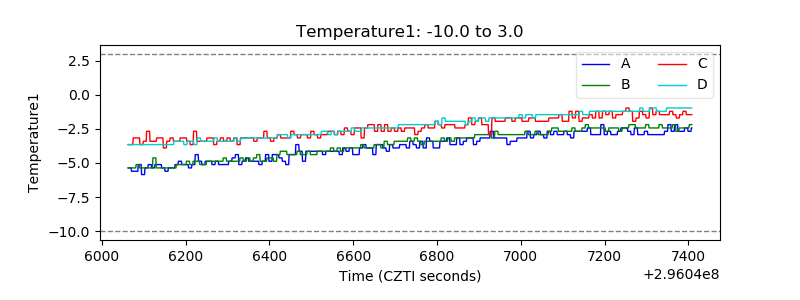 |
| Veto HV Monitor | 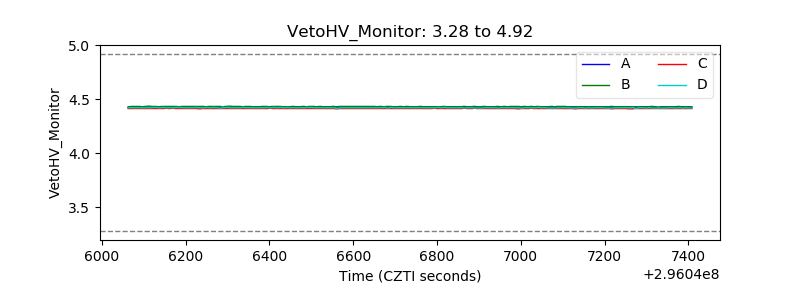 |
| Veto LLD | 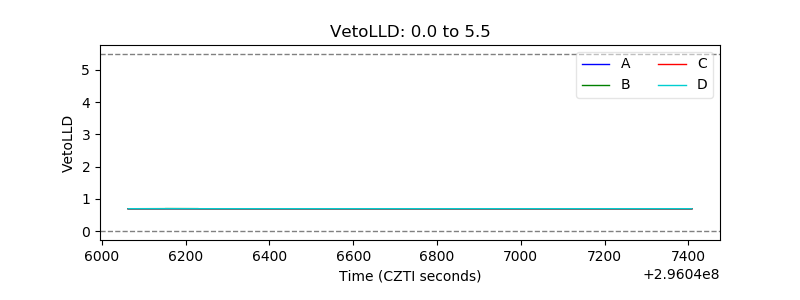 |
| Alpha Counter | 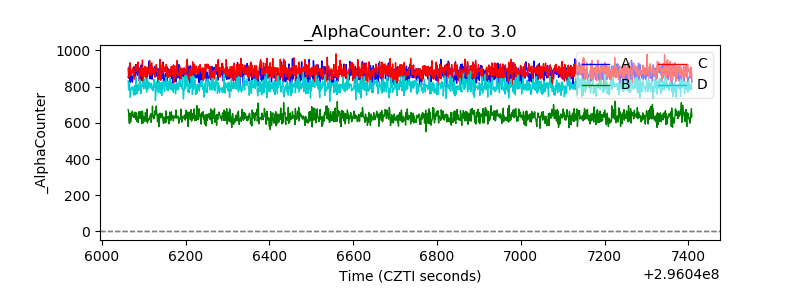 |
| _CPM_Rate | 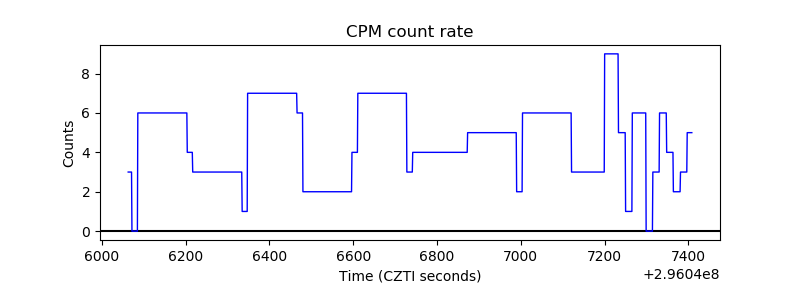 |
| CZT Counter | 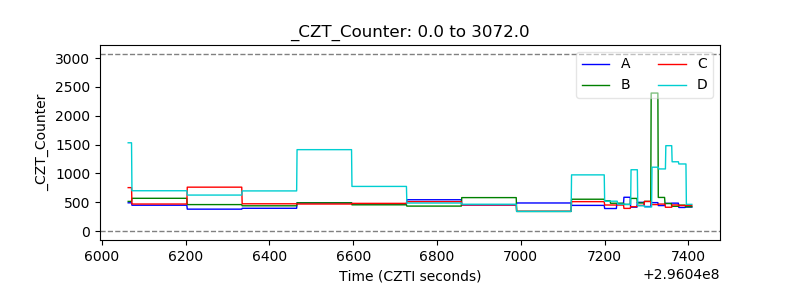 |
| +2.5 Volts monitor |  |
| +5 Volts monitor |  |
| _ROLL_ROT | 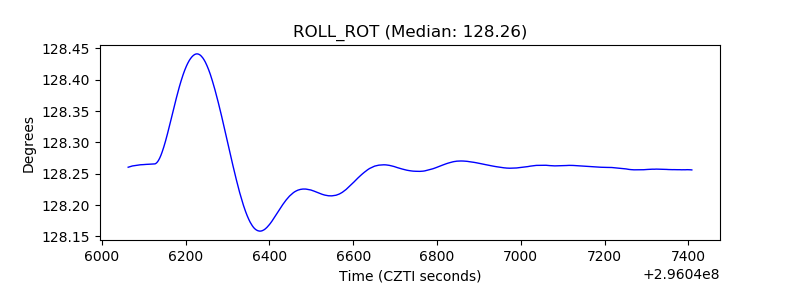 |
| _Roll_DEC | 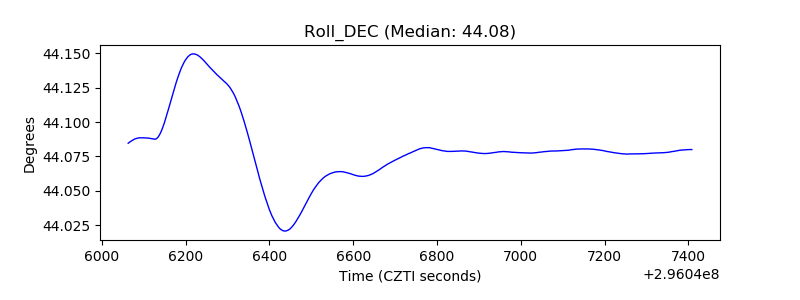 |
| _Roll_RA | 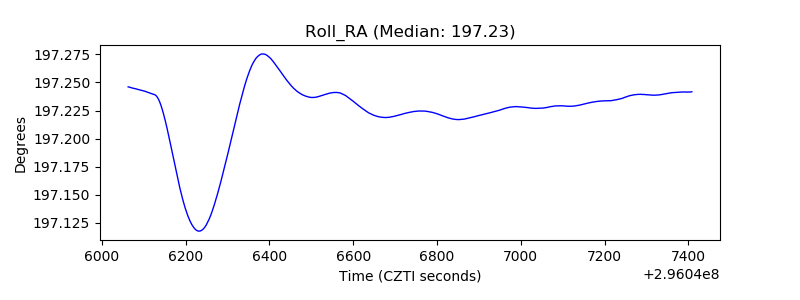 |
| Veto Counter | 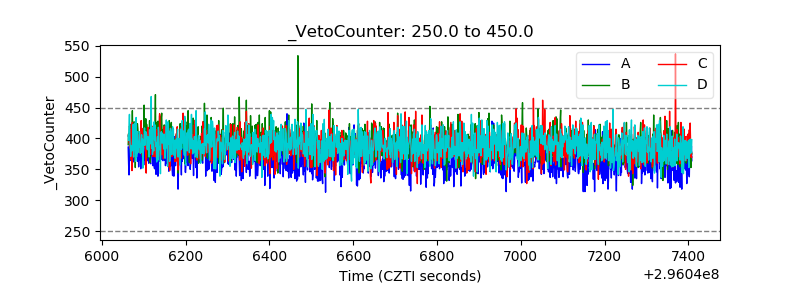 |