| Param | Original file | Final file |
|---|---|---|
| Filename | modeM0/AS1A05_075T03_9000002940_19691cztM0_level2.evt | modeM0/AS1A05_075T03_9000002940_19691cztM0_level2_quad_clean.evt |
| Size (bytes) | 534,559,680 | 95,581,440 |
| Size | 509.8 MB | 91.2 MB |
| Events in quadrant A | 3,395,687 | 611,261 |
| Events in quadrant B | 3,600,163 | 617,926 |
| Events in quadrant C | 3,522,280 | 586,386 |
| Events in quadrant D | 5,172,320 | 567,543 |
| Mode M0 | |||
|---|---|---|---|
| Quadrant | BADHDUFLAG | Total packets | Discarded packets |
| A | 0 | 15007 | 0 |
| B | 0 | 15413 | 0 |
| C | 0 | 15134 | 0 |
| D | 0 | 20327 | 0 |
| Mode M9 | |||
|---|---|---|---|
| Quadrant | BADHDUFLAG | Total packets | Discarded packets |
| A | 0 | 3 | 0 |
| B | 0 | 3 | 0 |
| C | 0 | 3 | 0 |
| D | 0 | 3 | 0 |
| Mode SS | |||
|---|---|---|---|
| Quadrant | BADHDUFLAG | Total packets | Discarded packets |
| A | 0 | 150 | 0 |
| B | 0 | 150 | 0 |
| C | 0 | 150 | 0 |
| D | 0 | 150 | 0 |
| Quadrant | Total seconds | Saturated seconds | Saturation percentage |
|---|---|---|---|
| A | 7348 | 119 | 1.619488% |
| B | 7348 | 141 | 1.918889% |
| C | 7348 | 149 | 2.027763% |
| D | 7348 | 435 | 5.919978% |
Noise dominated data is calculated using 1-second bins in cleaned event files. If a bin has >2000 counts, and if more than 50% of those come from <1% of pixels, then it is considered to be noise-dominated and hence unusable.
| Quadrant | # 1 sec bins | Bins with >0 counts | Bins with >2000 counts | High rate bins dominated by noise | Noise dominated (total time) | Noise dominated (detector-on time) | Marked lightcurve |
|---|---|---|---|---|---|---|---|
| A | 7623 | 7349 | 0 | 0 | 0.00% | 0.00% | 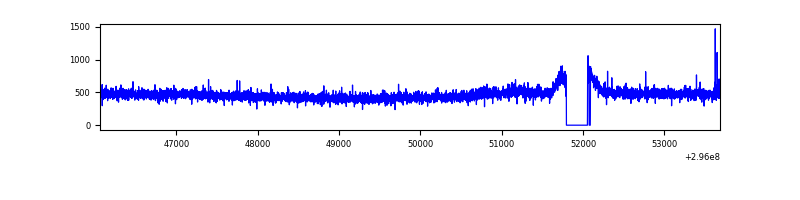 |
| B | 7623 | 7349 | 15 | 15 | 0.20% | 0.20% | 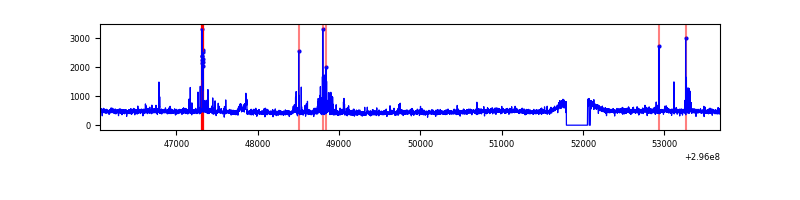 |
| C | 7623 | 7350 | 0 | 0 | 0.00% | 0.00% | 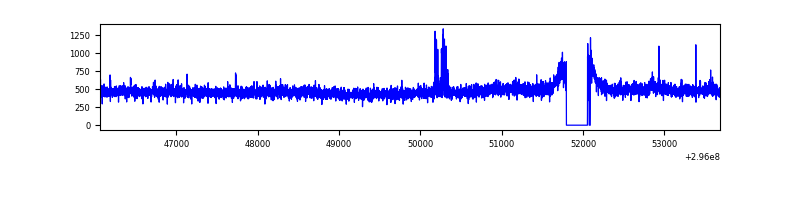 |
| D | 7623 | 7349 | 302 | 302 | 3.96% | 4.11% | 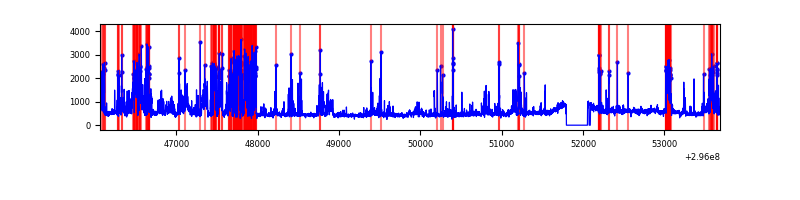 |
Top three noisy pixels from each quadrant. If the there are fewer than three noisy pixels in the level2.evt file, extra rows are filled as -1
| Pixel properties | Quadrant properties | ||||||
|---|---|---|---|---|---|---|---|
| Quadrant | DetID | PixID | Counts | Sigma | Mean | Median | Sigma |
| A | 13 | 210 | 23307 | 126.81 | 874 | 853 | 177.1 |
| A | 0 | 226 | 7606 | 38.14 | 874 | 853 | 177.1 |
| A | 3 | 137 | 7312 | 36.48 | 874 | 853 | 177.1 |
| B | 7 | 220 | 61926 | 370.8 | 866 | 843 | 164.7 |
| B | 4 | 216 | 34558 | 204.66 | 866 | 843 | 164.7 |
| B | 0 | 197 | 29104 | 171.56 | 866 | 843 | 164.7 |
| C | 14 | 238 | 131335 | 663.18 | 834 | 838 | 196.8 |
| C | 3 | 233 | 84318 | 424.24 | 834 | 838 | 196.8 |
| C | 7 | 247 | 43042 | 214.48 | 834 | 838 | 196.8 |
| D | 1 | 52 | 902288 | 4408.52 | 837 | 811 | 204.5 |
| D | 7 | 238 | 789426 | 3856.59 | 837 | 811 | 204.5 |
| D | 1 | 20 | 170790 | 831.25 | 837 | 811 | 204.5 |
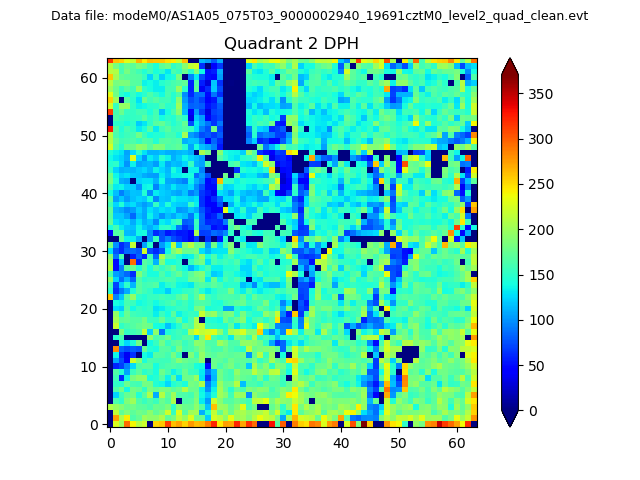
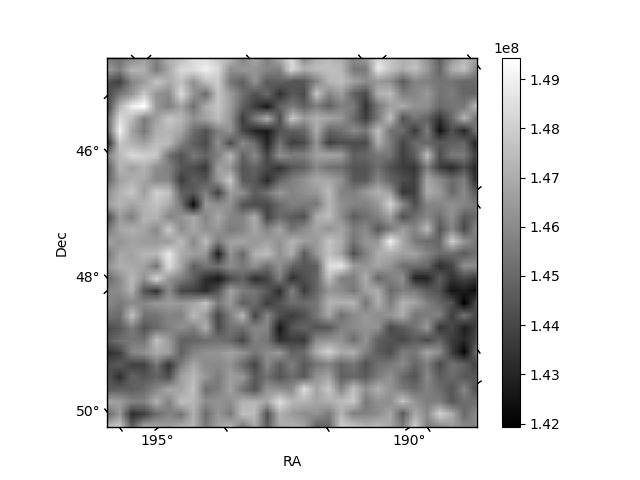
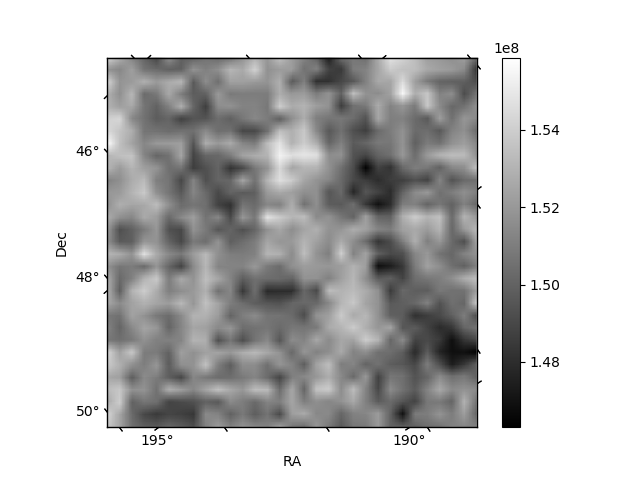
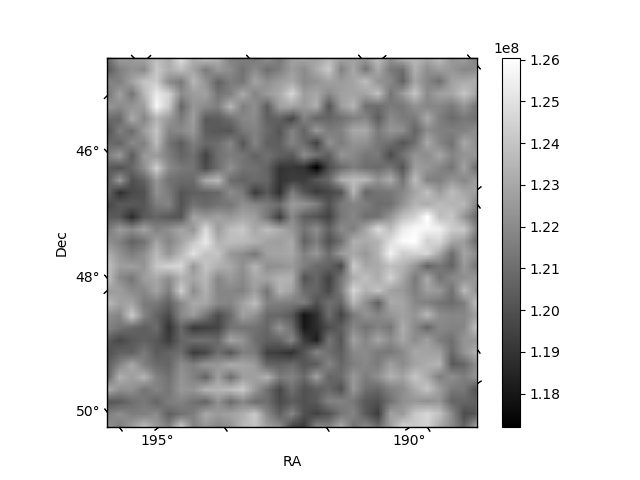
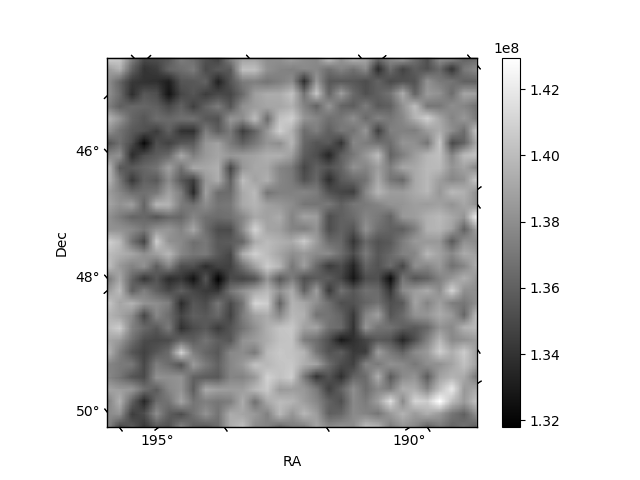
Histogram calculated using DETX and DETY for each event in the final _common_clean file
| Quadrant A | 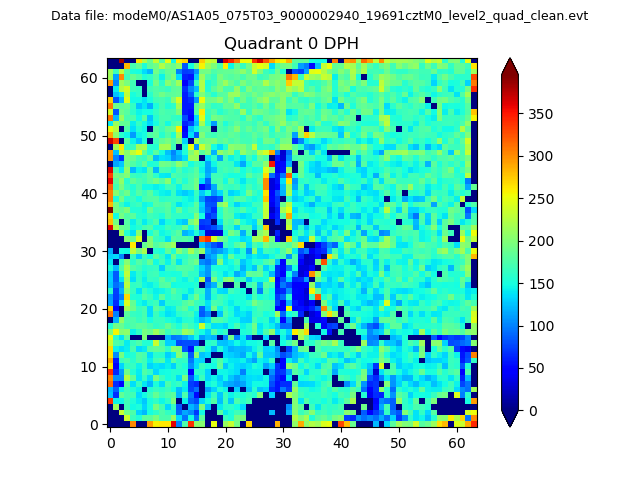 |
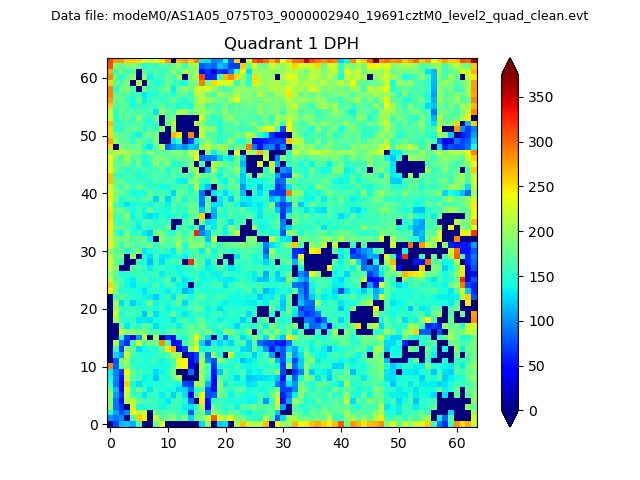 |
Quadrant B |
|---|---|---|---|
| Quadrant D | 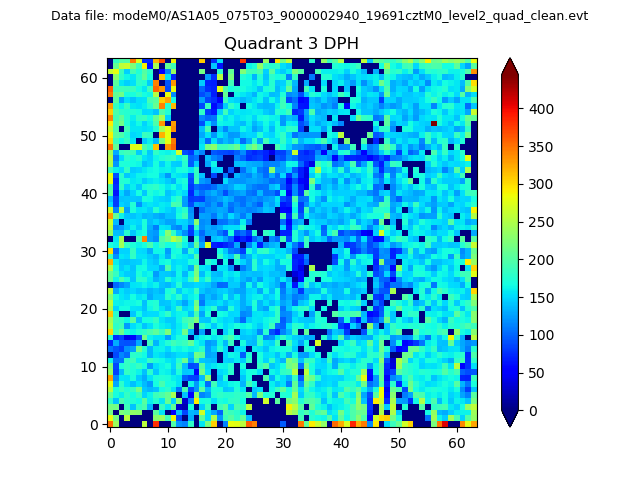 |
 |
Quadrant C |
| Plot type | Count rate plots | Images |
|---|---|---|
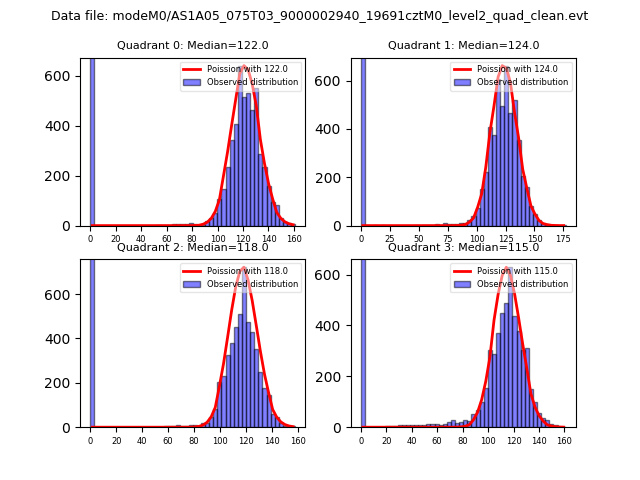
| Comparison with Poisson distribution Blue bars denote a histogram of data divided into 1 sec bins. Red curve is a Poisson curve with rate = median count rate of data. |
 |
 |
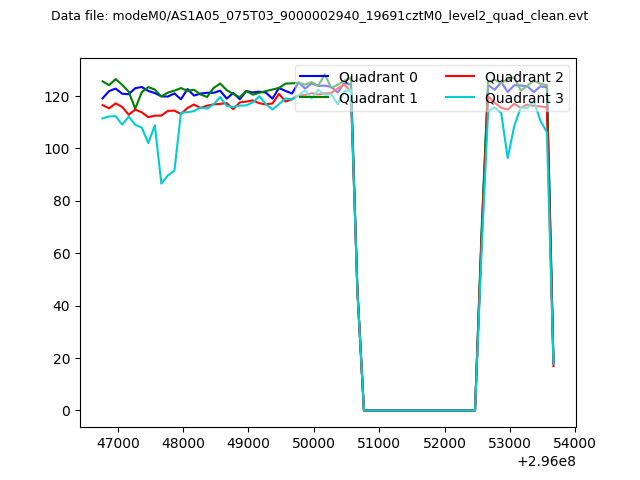
| Quadrant-wise count rates Data is divided into 100 sec bins |
 |
|
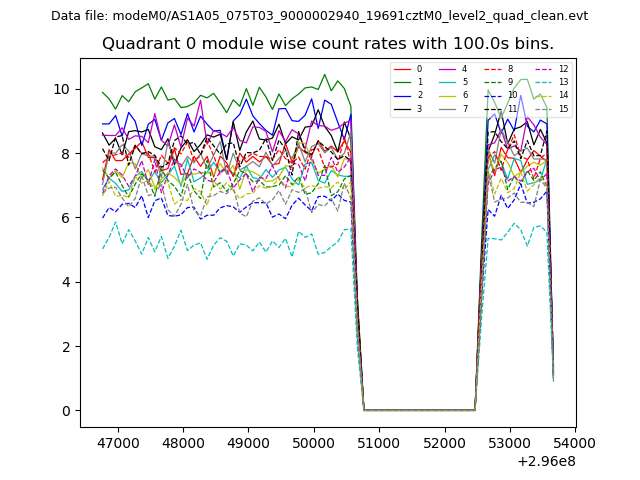
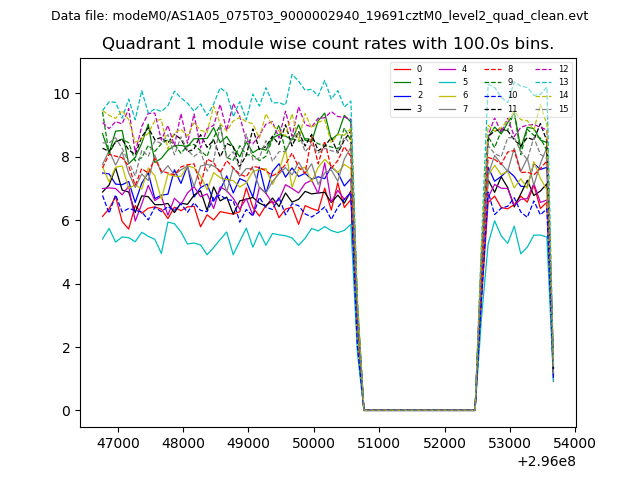
| Module-wise count rates for Quadrant A Data is divided into 100 sec bins |
 |
 |
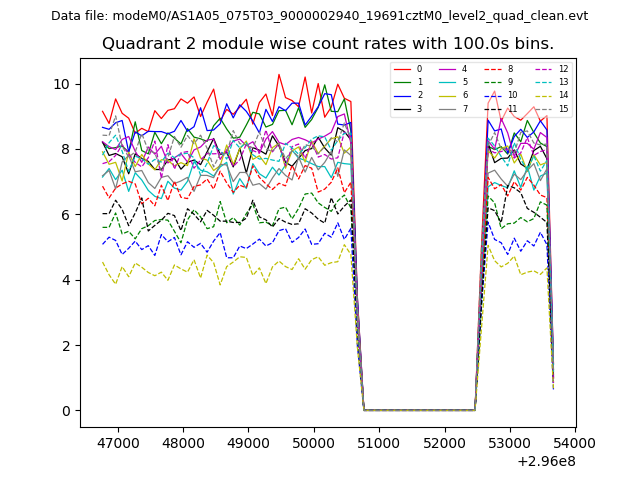
| Module-wise count rates for Quadrant B Data is divided into 100 sec bins |
 |
 |
| Module-wise count rates for Quadrant C Data is divided into 100 sec bins |
 |
 |
| Module-wise count rates for Quadrant D Data is divided into 100 sec bins |
 |
 |
| Parameter | Plot |
|---|---|
| CZT HV Monitor | 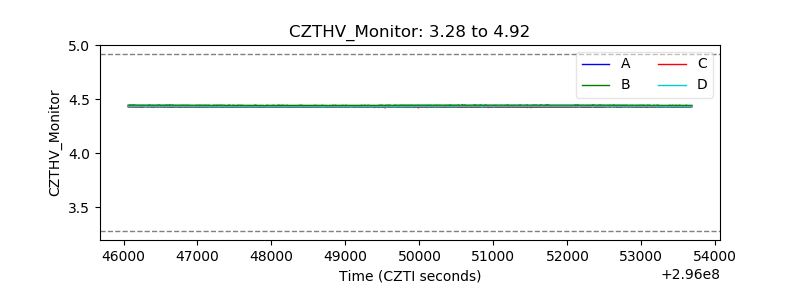 |
| D_VDD | 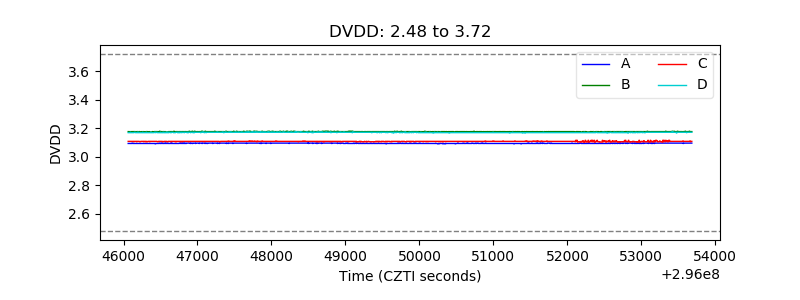 |
| Temperature 1 | 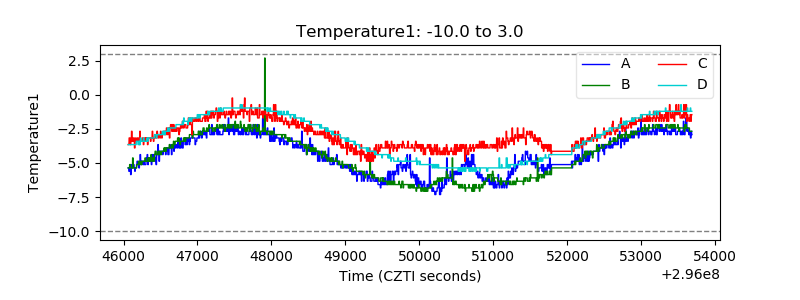 |
| Veto HV Monitor | 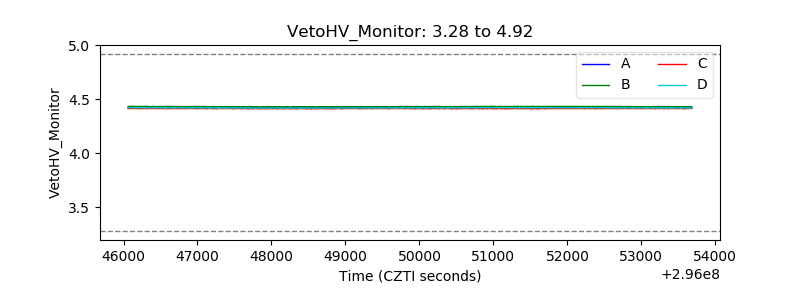 |
| Veto LLD | 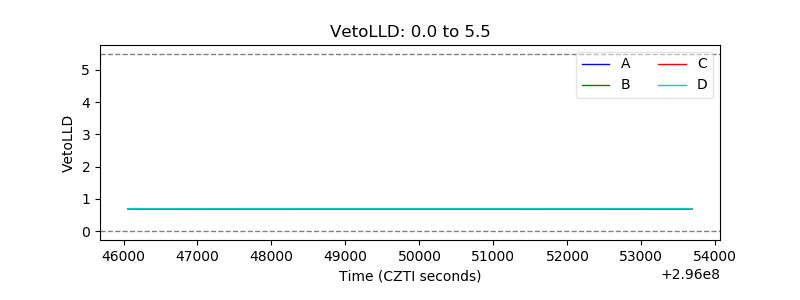 |
| Alpha Counter | 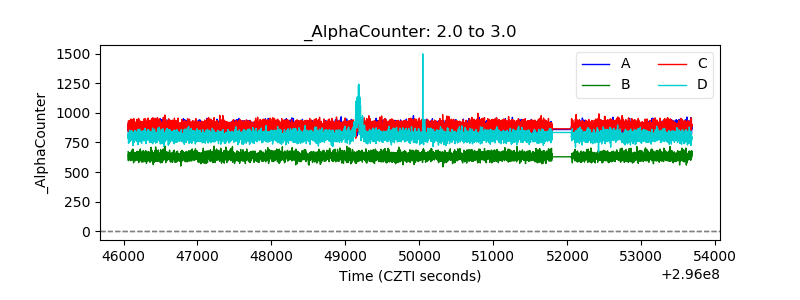 |
| _CPM_Rate | 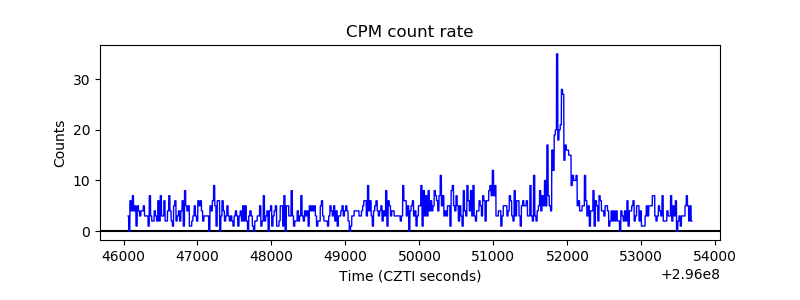 |
| CZT Counter | 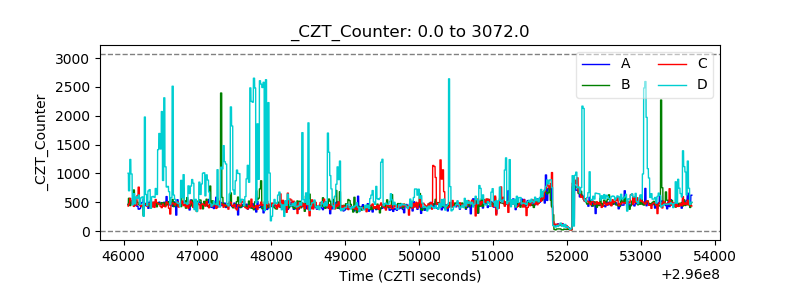 |
| +2.5 Volts monitor |  |
| +5 Volts monitor |  |
| _ROLL_ROT |  |
| _Roll_DEC | 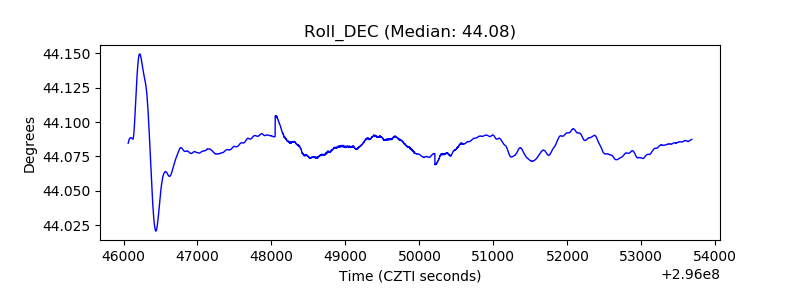 |
| _Roll_RA | 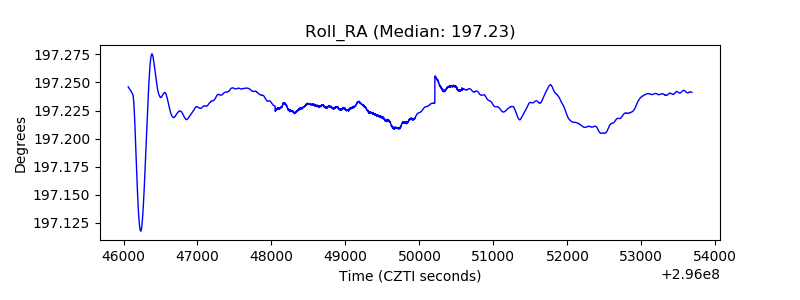 |
| Veto Counter | 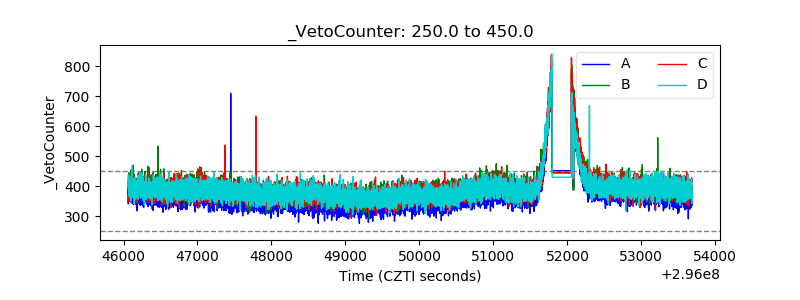 |