| Param | Original file | Final file |
|---|---|---|
| Filename | modeM0/AS1A05_075T03_9000002940_19693cztM0_level2.evt | modeM0/AS1A05_075T03_9000002940_19693cztM0_level2_quad_clean.evt |
| Size (bytes) | 589,708,800 | 116,009,280 |
| Size | 562.4 MB | 110.6 MB |
| Events in quadrant A | 3,960,618 | 761,088 |
| Events in quadrant B | 3,983,919 | 763,186 |
| Events in quadrant C | 3,937,974 | 728,171 |
| Events in quadrant D | 5,424,151 | 695,007 |
| Mode M0 | |||
|---|---|---|---|
| Quadrant | BADHDUFLAG | Total packets | Discarded packets |
| A | 0 | 17292 | 1 |
| B | 0 | 17091 | 1 |
| C | 0 | 16782 | 1 |
| D | 0 | 21607 | 1 |
| Mode M9 | |||
|---|---|---|---|
| Quadrant | BADHDUFLAG | Total packets | Discarded packets |
| A | 0 | 6 | 0 |
| B | 0 | 6 | 0 |
| C | 0 | 6 | 0 |
| D | 0 | 6 | 0 |
| Mode SS | |||
|---|---|---|---|
| Quadrant | BADHDUFLAG | Total packets | Discarded packets |
| A | 0 | 166 | 0 |
| B | 0 | 166 | 0 |
| C | 0 | 166 | 0 |
| D | 0 | 166 | 0 |
| Quadrant | Total seconds | Saturated seconds | Saturation percentage |
|---|---|---|---|
| A | 8146 | 85 | 1.043457% |
| B | 8146 | 104 | 1.276700% |
| C | 8146 | 121 | 1.485392% |
| D | 8146 | 528 | 6.481709% |
Noise dominated data is calculated using 1-second bins in cleaned event files. If a bin has >2000 counts, and if more than 50% of those come from <1% of pixels, then it is considered to be noise-dominated and hence unusable.
| Quadrant | # 1 sec bins | Bins with >0 counts | Bins with >2000 counts | High rate bins dominated by noise | Noise dominated (total time) | Noise dominated (detector-on time) | Marked lightcurve |
|---|---|---|---|---|---|---|---|
| A | 8661 | 8147 | 6 | 6 | 0.07% | 0.07% | 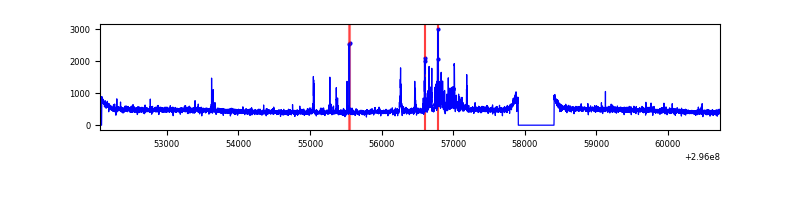 |
| B | 8661 | 8147 | 11 | 11 | 0.13% | 0.14% | 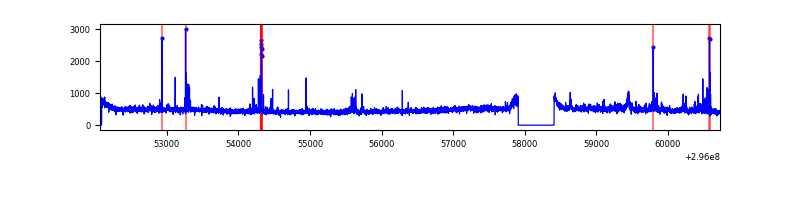 |
| C | 8661 | 8147 | 0 | 0 | 0.00% | 0.00% | 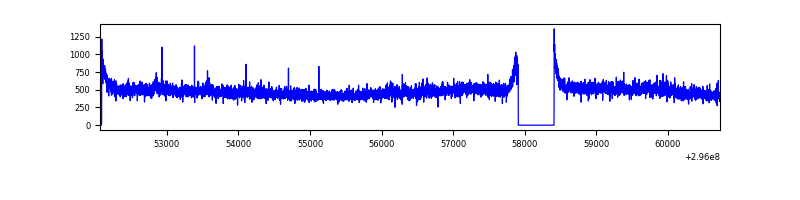 |
| D | 8661 | 8147 | 408 | 408 | 4.71% | 5.01% | 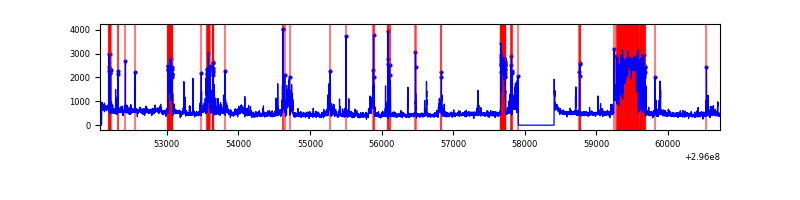 |
Top three noisy pixels from each quadrant. If the there are fewer than three noisy pixels in the level2.evt file, extra rows are filled as -1
| Pixel properties | Quadrant properties | ||||||
|---|---|---|---|---|---|---|---|
| Quadrant | DetID | PixID | Counts | Sigma | Mean | Median | Sigma |
| A | 5 | 16 | 234899 | 1187.3 | 966 | 945 | 197.0 |
| A | 0 | 226 | 8275 | 37.2 | 966 | 945 | 197.0 |
| A | 3 | 137 | 7973 | 35.67 | 966 | 945 | 197.0 |
| B | 7 | 220 | 82332 | 442.24 | 958 | 931 | 184.1 |
| B | 4 | 216 | 36149 | 191.33 | 958 | 931 | 184.1 |
| B | 0 | 198 | 31735 | 167.35 | 958 | 931 | 184.1 |
| C | 3 | 233 | 164731 | 753.67 | 926 | 931 | 217.3 |
| C | 14 | 238 | 144918 | 662.5 | 926 | 931 | 217.3 |
| C | 13 | 61 | 6415 | 25.23 | 926 | 931 | 217.3 |
| D | 7 | 238 | 1436396 | 6465.99 | 915 | 888 | 222.0 |
| D | 1 | 20 | 157783 | 706.71 | 915 | 888 | 222.0 |
| D | 1 | 52 | 148494 | 664.86 | 915 | 888 | 222.0 |
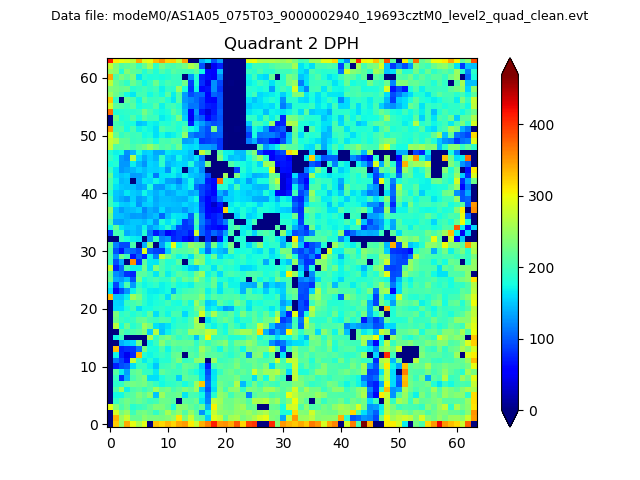
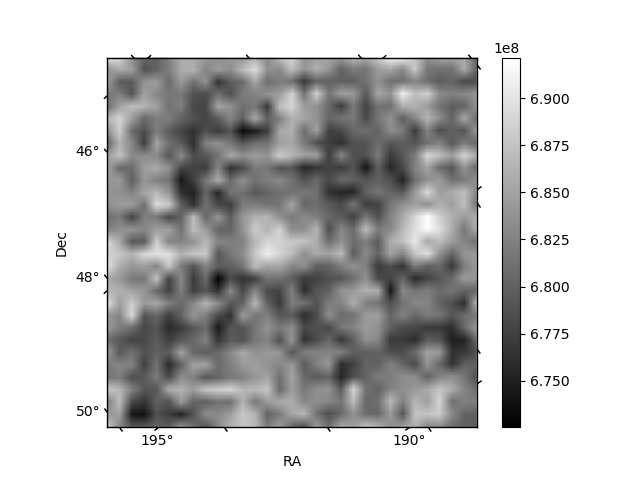
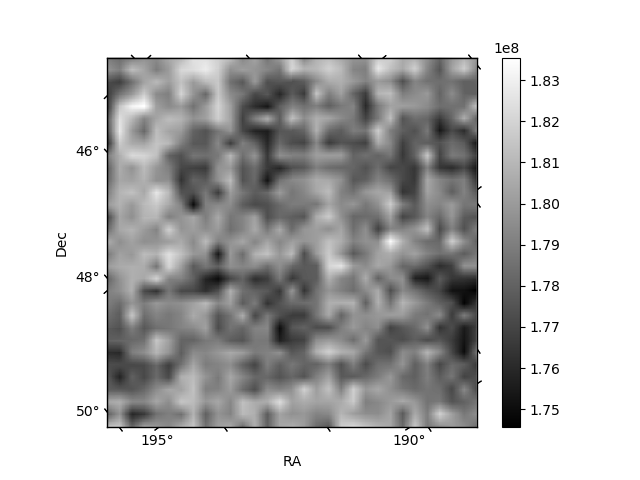
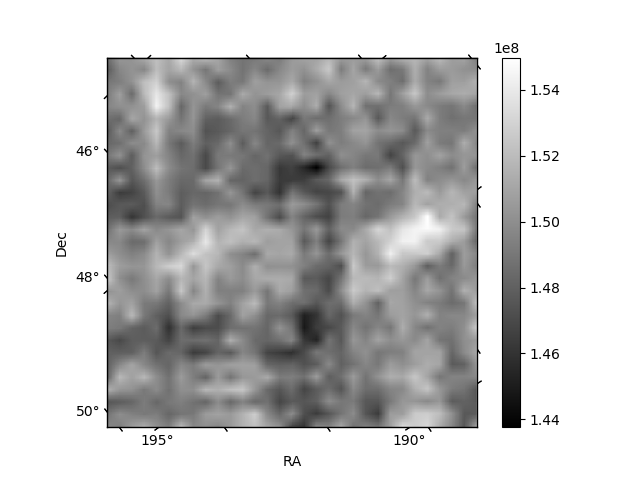
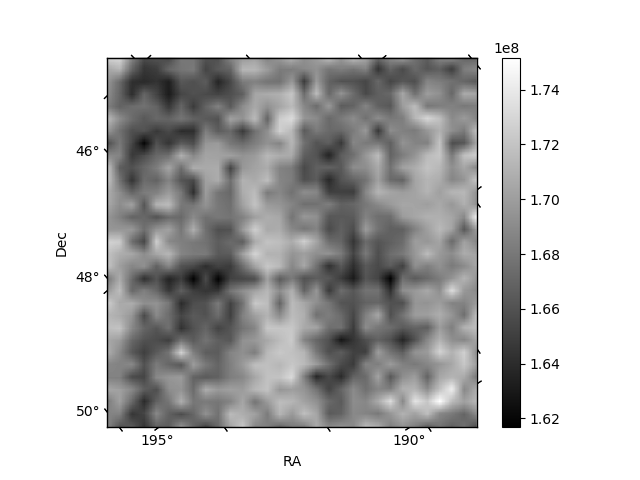
Histogram calculated using DETX and DETY for each event in the final _common_clean file
| Quadrant A | 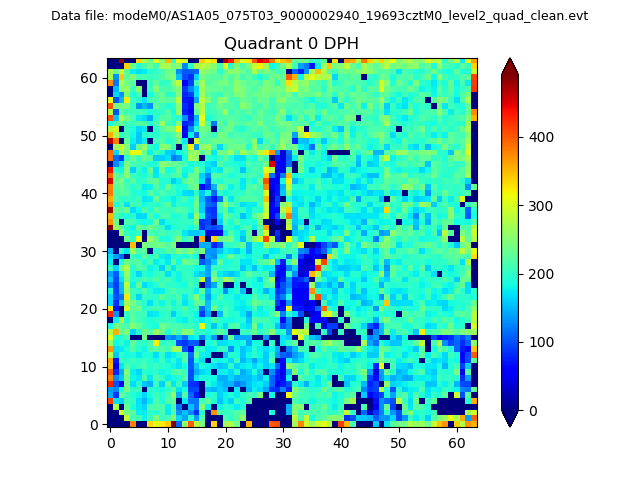 |
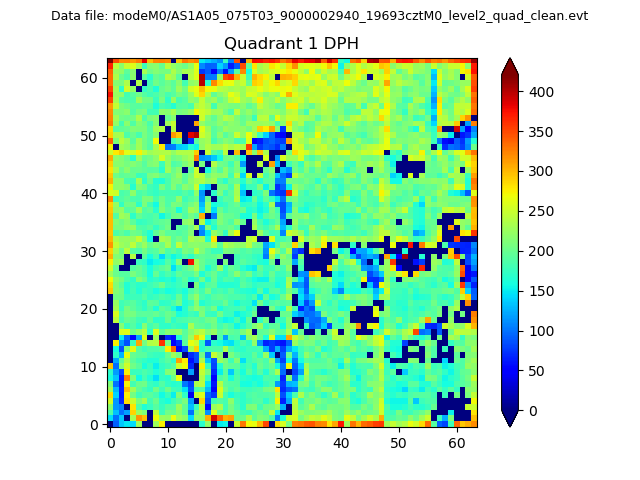 |
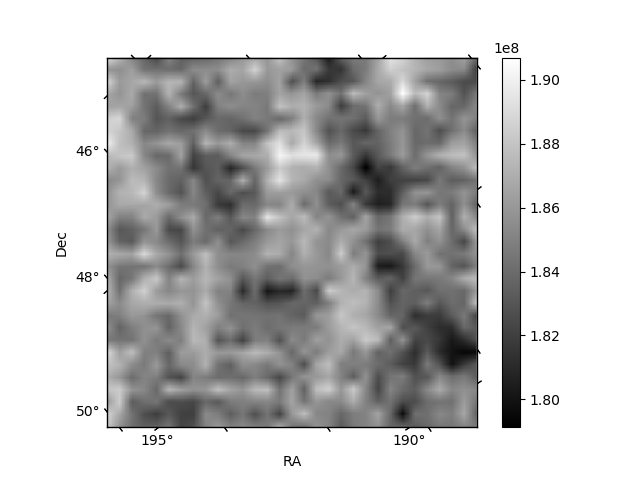
Quadrant B |
|---|---|---|---|
| Quadrant D | 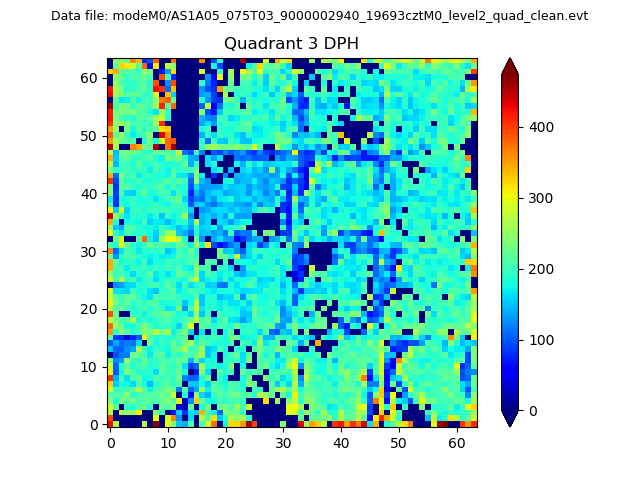 |
 |
Quadrant C |
| Plot type | Count rate plots | Images |
|---|---|---|
| Comparison with Poisson distribution Blue bars denote a histogram of data divided into 1 sec bins. Red curve is a Poisson curve with rate = median count rate of data. |
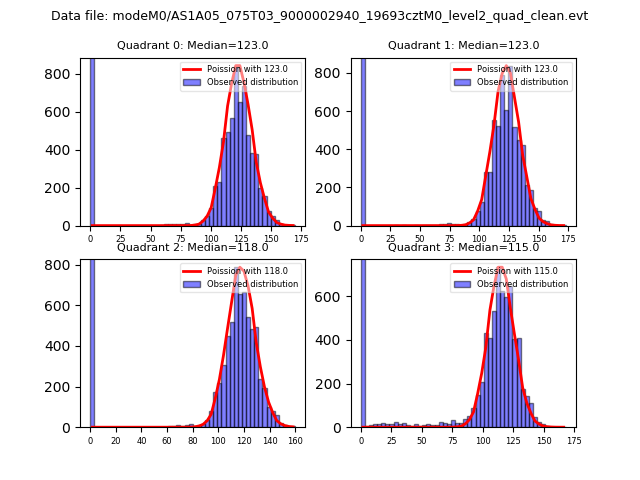 |
 |
| Quadrant-wise count rates Data is divided into 100 sec bins |
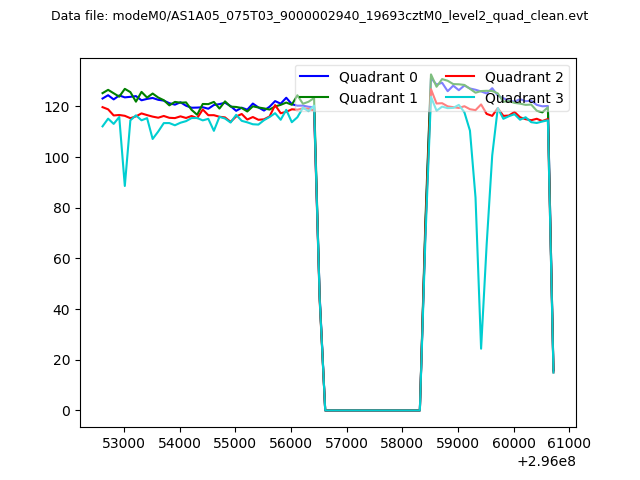 |
|
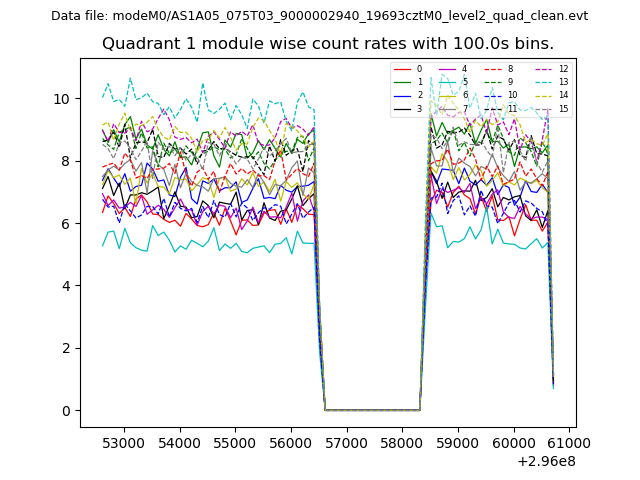
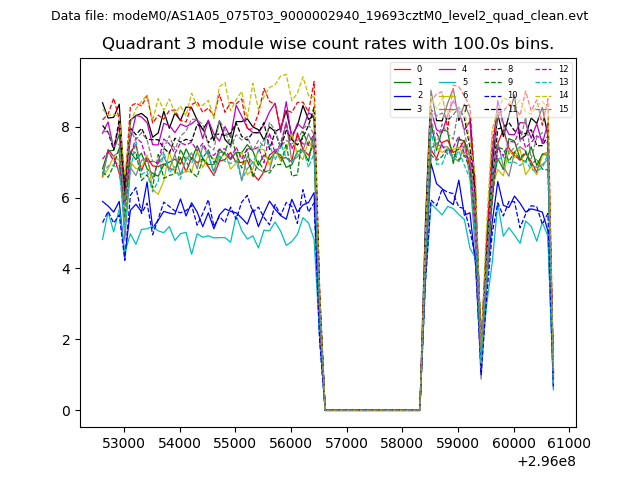
| Module-wise count rates for Quadrant A Data is divided into 100 sec bins |
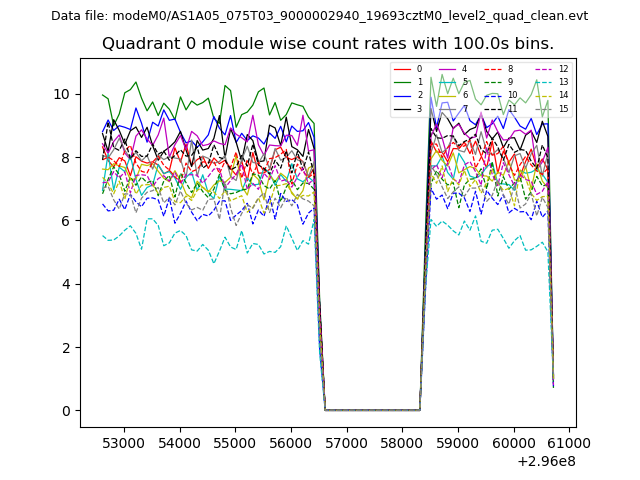 |
 |
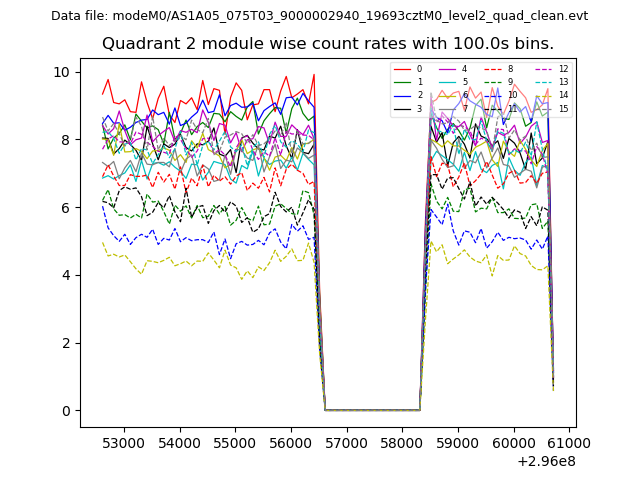
| Module-wise count rates for Quadrant B Data is divided into 100 sec bins |
 |
 |
| Module-wise count rates for Quadrant C Data is divided into 100 sec bins |
 |
 |
| Module-wise count rates for Quadrant D Data is divided into 100 sec bins |
 |
 |
| Parameter | Plot |
|---|---|
| CZT HV Monitor | 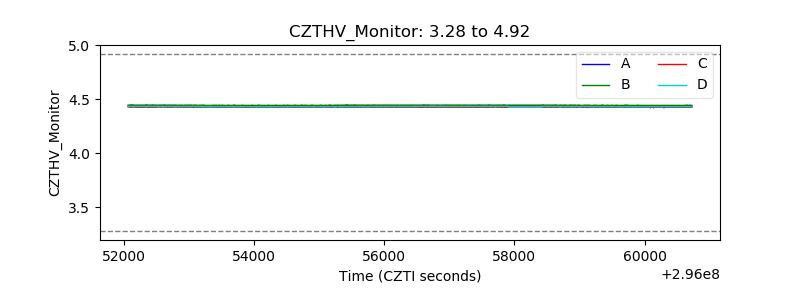 |
| D_VDD | 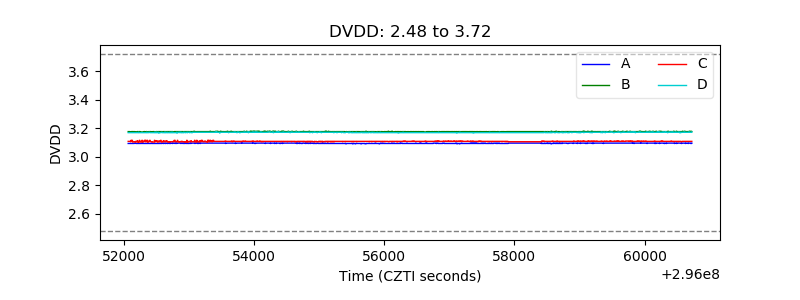 |
| Temperature 1 | 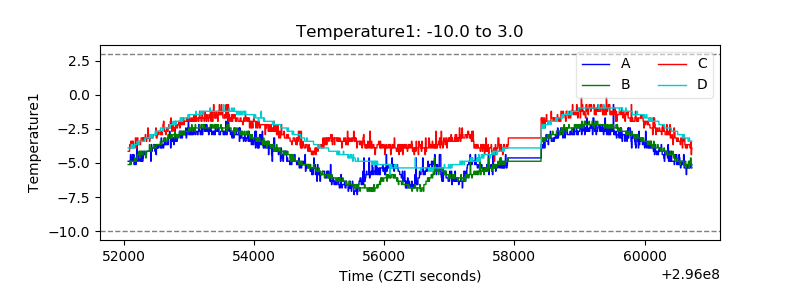 |
| Veto HV Monitor | 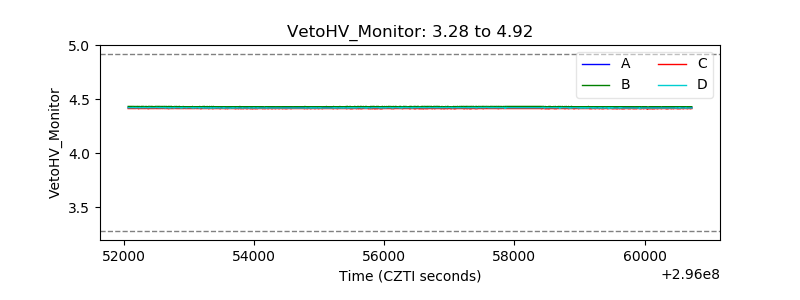 |
| Veto LLD | 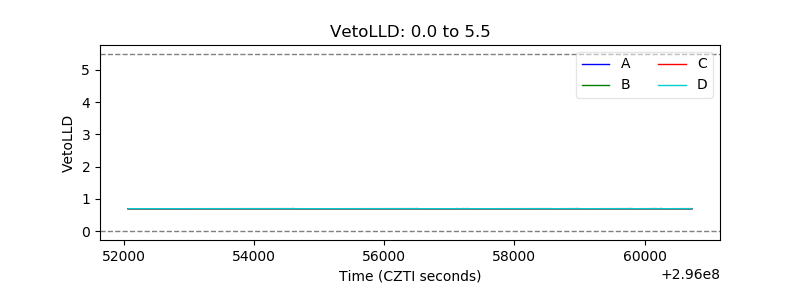 |
| Alpha Counter | 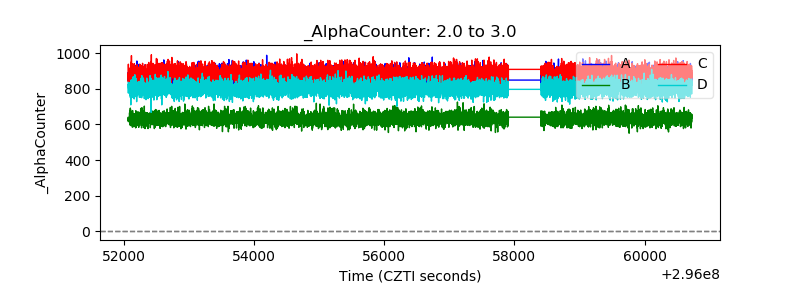 |
| _CPM_Rate | 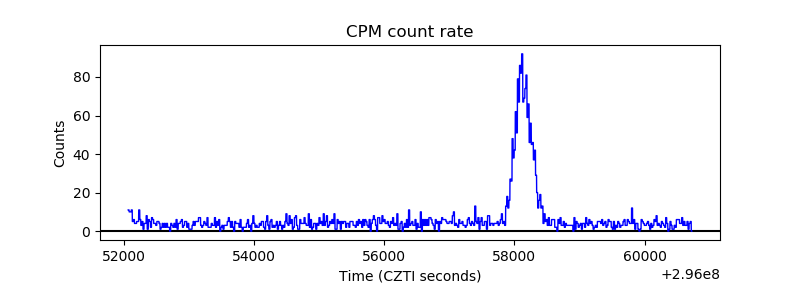 |
| CZT Counter | 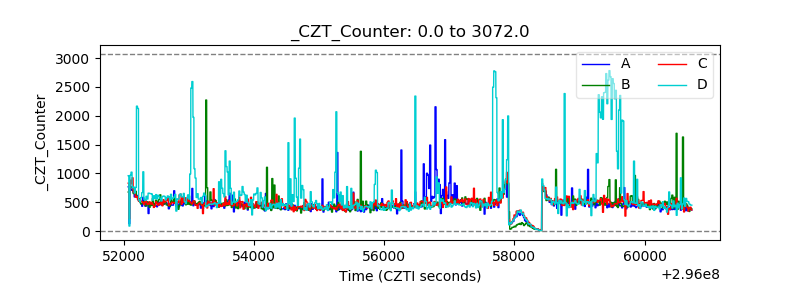 |
| +2.5 Volts monitor |  |
| +5 Volts monitor |  |
| _ROLL_ROT | 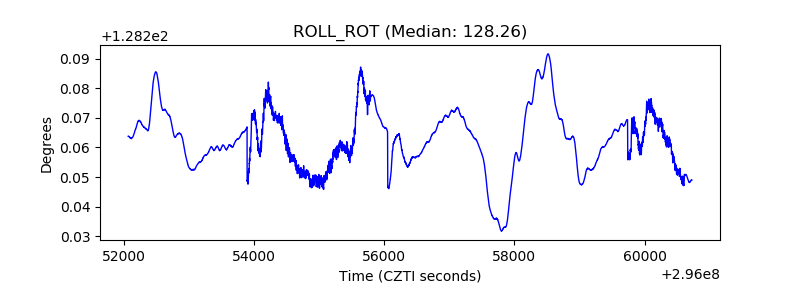 |
| _Roll_DEC | 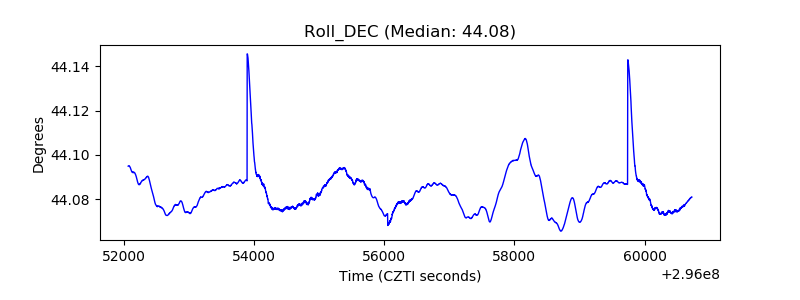 |
| _Roll_RA | 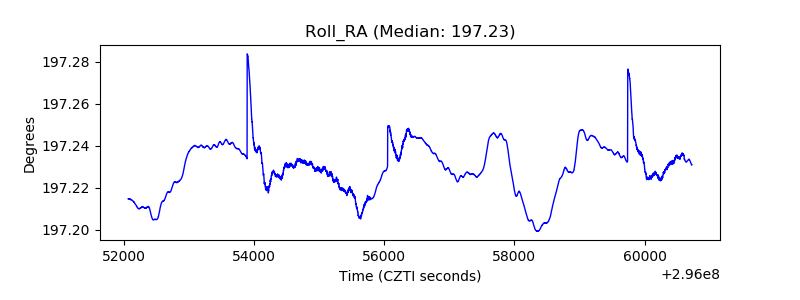 |
| Veto Counter | 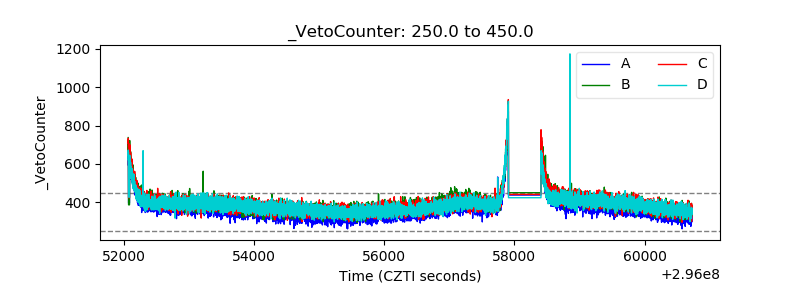 |