| Param | Original file | Final file |
|---|---|---|
| Filename | modeM0/AS1A05_101T05_9000002938cztM0_level2.fits | modeM0/AS1A05_101T05_9000002938cztM0_level2_quad_clean.evt |
| Size (bytes) | 155,298,240 | 223,361,280 |
| Size | 148.1 MB | 213.0 MB |
| Events in quadrant A | 944,962 | 1,474,936 |
| Events in quadrant B | 904,480 | 1,459,250 |
| Events in quadrant C | 918,008 | 1,408,970 |
| Events in quadrant D | 794,050 | 1,280,461 |
| Mode M9 | |||
|---|---|---|---|
| Quadrant | BADHDUFLAG | Total packets | Discarded packets |
| A | 0 | 15 | 0 |
| B | 0 | 15 | 0 |
| C | 0 | 15 | 0 |
| D | 0 | 15 | 0 |
| Mode SS | |||
|---|---|---|---|
| Quadrant | BADHDUFLAG | Total packets | Discarded packets |
| A | 0 | 336 | 0 |
| B | 0 | 336 | 0 |
| C | 0 | 336 | 0 |
| D | 0 | 336 | 0 |
| Mode M0 | |||
|---|---|---|---|
| Quadrant | BADHDUFLAG | Total packets | Discarded packets |
| A | 0 | 33762 | 0 |
| B | 0 | 34510 | 0 |
| C | 0 | 35418 | 0 |
| D | 0 | 41804 | 0 |
| Quadrant | Total seconds | Saturated seconds | Saturation percentage |
|---|---|---|---|
| A | 16554 | 320 | 1.933068% |
| B | 16554 | 321 | 1.939108% |
| C | 16554 | 501 | 3.026459% |
| D | 16554 | 948 | 5.726713% |
Noise dominated data is calculated using 1-second bins in cleaned event files. If a bin has >2000 counts, and if more than 50% of those come from <1% of pixels, then it is considered to be noise-dominated and hence unusable.
| Quadrant | # 1 sec bins | Bins with >0 counts | Bins with >2000 counts | High rate bins dominated by noise | Noise dominated (total time) | Noise dominated (detector-on time) | Marked lightcurve |
|---|---|---|---|---|---|---|---|
| A | 17438 | 16550 | 0 | 0 | 0.00% | 0.00% | 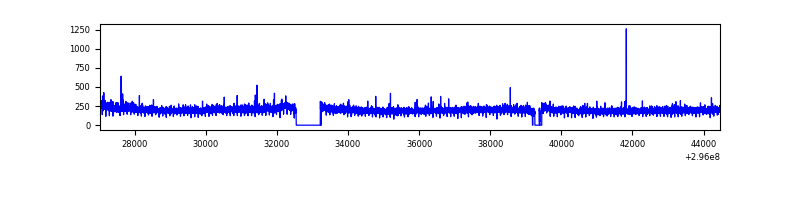 |
| B | 17438 | 16550 | 0 | 0 | 0.00% | 0.00% |  |
| C | 17438 | 16550 | 0 | 0 | 0.00% | 0.00% | 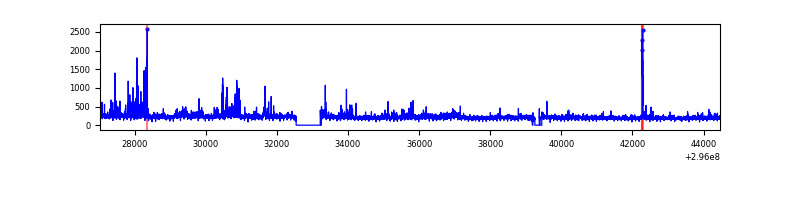 |
| D | 17439 | 16536 | 0 | 0 | 0.00% | 0.00% |  |
Top three noisy pixels from each quadrant. If the there are fewer than three noisy pixels in the level2.evt file, extra rows are filled as -1
| Pixel properties | Quadrant properties | ||||||
|---|---|---|---|---|---|---|---|
| Quadrant | DetID | PixID | Counts | Sigma | Mean | Median | Sigma |
| A | 0 | 29 | 904 | 10.64 | 246 | 231 | 63.3 |
| A | 7 | 110 | 729 | 7.87 | 246 | 231 | 63.3 |
| A | 15 | 236 | 707 | 7.52 | 246 | 231 | 63.3 |
| B | 2 | 9 | 757 | 11.11 | 238 | 228 | 47.6 |
| B | 2 | 8 | 651 | 8.88 | 238 | 228 | 47.6 |
| B | 5 | 128 | 589 | 7.58 | 238 | 228 | 47.6 |
| C | 1 | 81 | 710 | 7.6 | 242 | 227 | 63.6 |
| C | 1 | 80 | 707 | 7.55 | 242 | 227 | 63.6 |
| C | 12 | 241 | 630 | 6.34 | 242 | 227 | 63.6 |
| D | 10 | 189 | 592 | 6.26 | 226 | 206 | 61.7 |
| D | 4 | 160 | 589 | 6.21 | 226 | 206 | 61.7 |
| D | 3 | 159 | 577 | 6.02 | 226 | 206 | 61.7 |
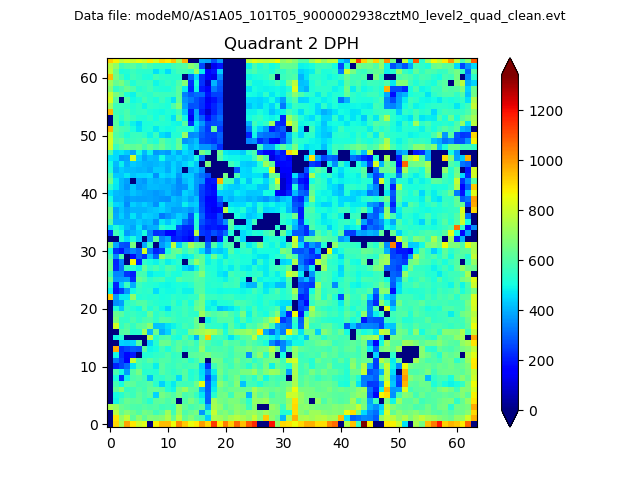
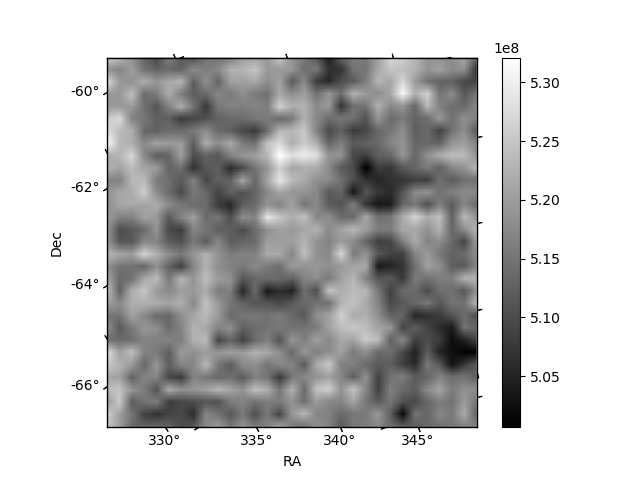
Histogram calculated using DETX and DETY for each event in the final _common_clean file
| Quadrant A | 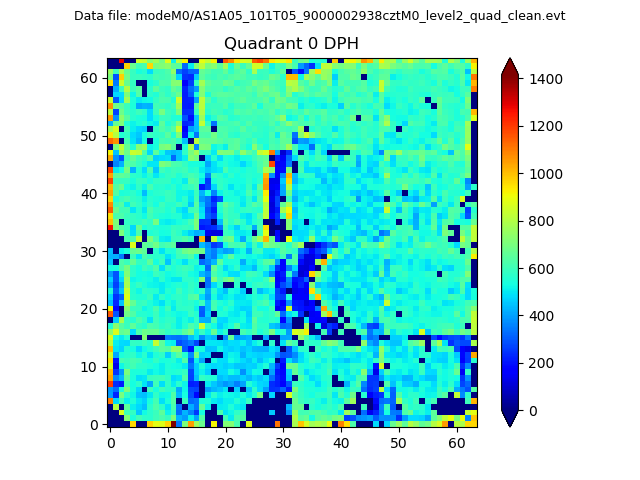 |
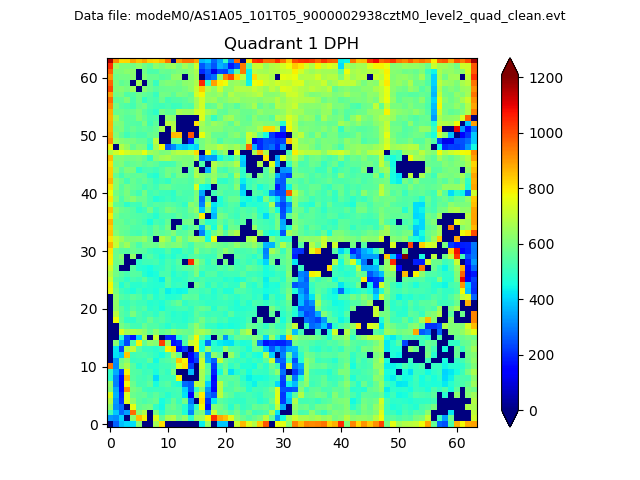 |
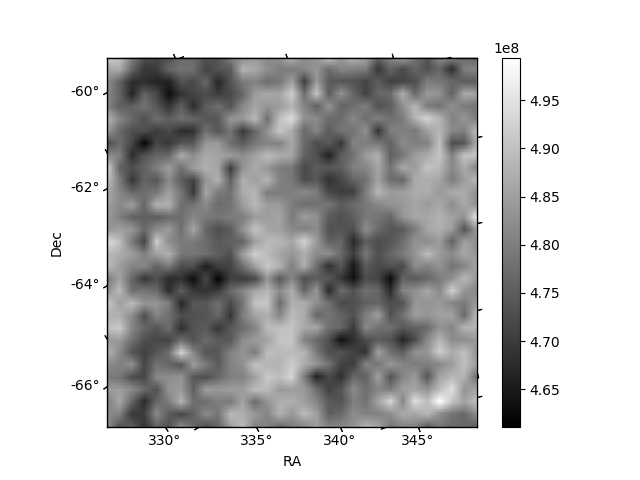
Quadrant B |
|---|---|---|---|
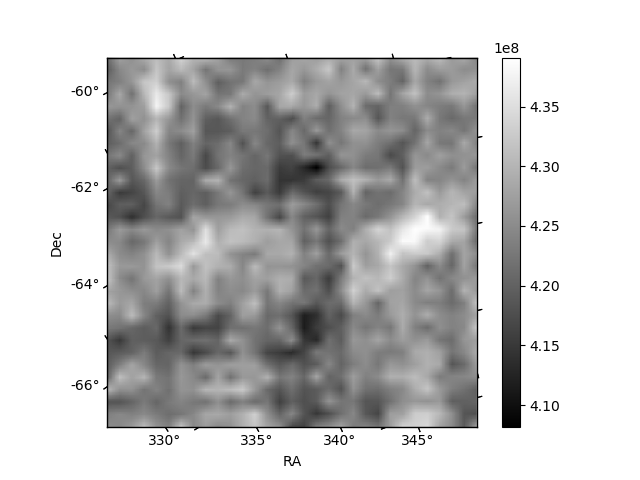
| Quadrant D | 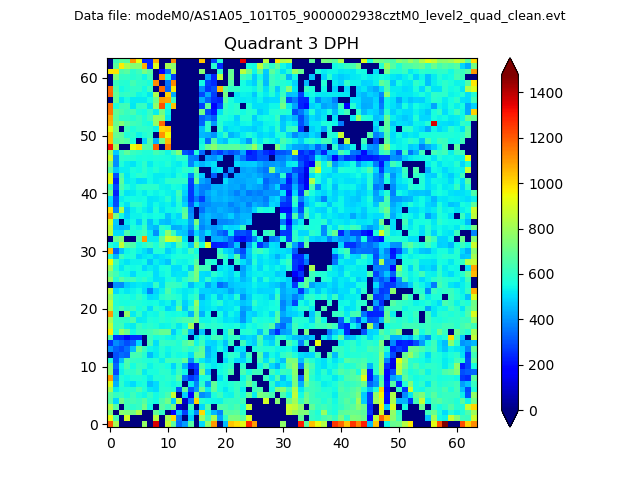 |
 |
Quadrant C |
| Plot type | Count rate plots | Images |
|---|---|---|
| Comparison with Poisson distribution Blue bars denote a histogram of data divided into 1 sec bins. Red curve is a Poisson curve with rate = median count rate of data. |
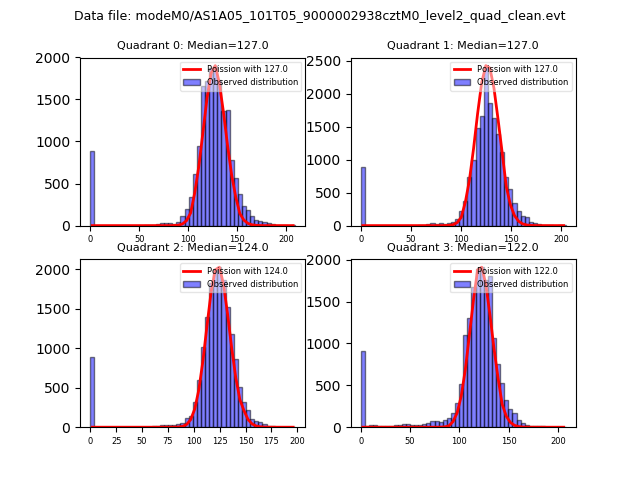 |
 |
| Quadrant-wise count rates Data is divided into 100 sec bins |
 |
|
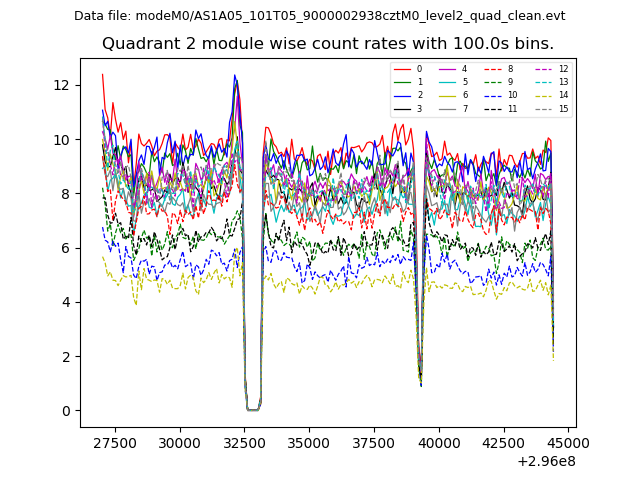
| Module-wise count rates for Quadrant A Data is divided into 100 sec bins |
 |
 |
| Module-wise count rates for Quadrant B Data is divided into 100 sec bins |
 |
 |
| Module-wise count rates for Quadrant C Data is divided into 100 sec bins |
 |
 |
| Module-wise count rates for Quadrant D Data is divided into 100 sec bins |
 |
 |
| Parameter | Plot |
|---|---|
| CZT HV Monitor | 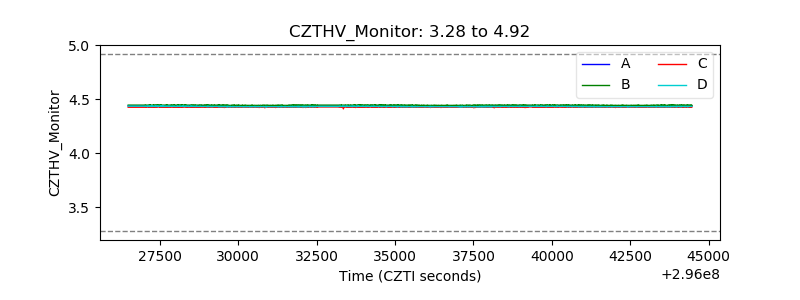 |
| D_VDD | 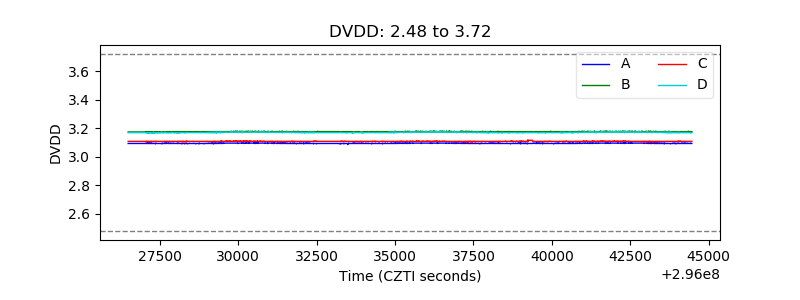 |
| Temperature 1 |  |
| Veto HV Monitor | 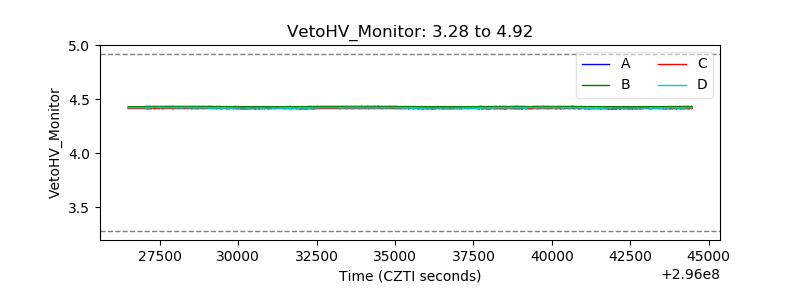 |
| Veto LLD | 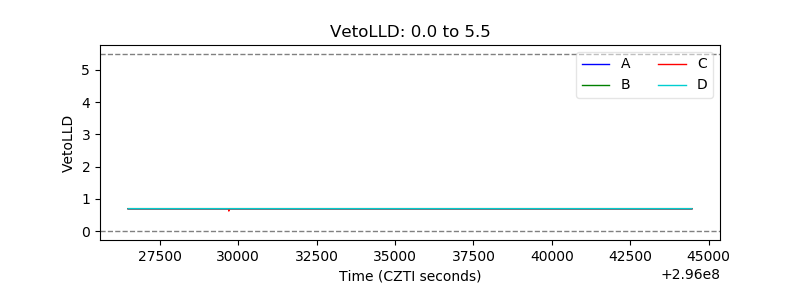 |
| Alpha Counter |  |
| _CPM_Rate |  |
| CZT Counter | 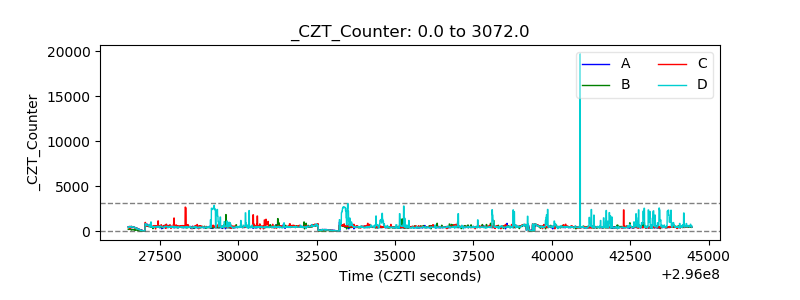 |
| +2.5 Volts monitor | 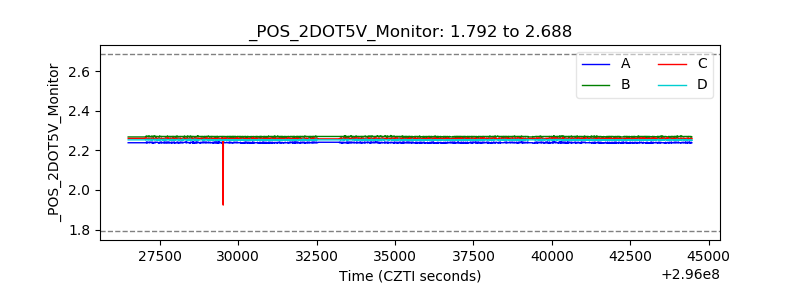 |
| +5 Volts monitor | 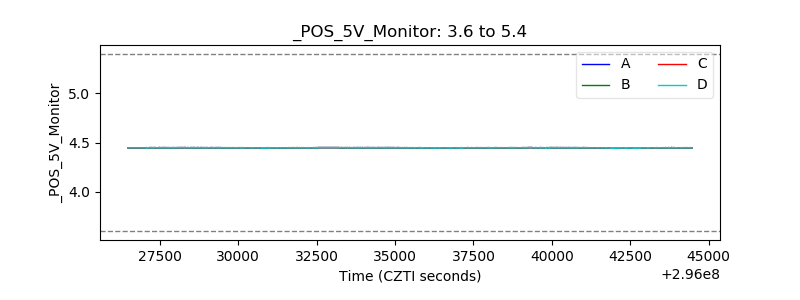 |
| _ROLL_ROT | 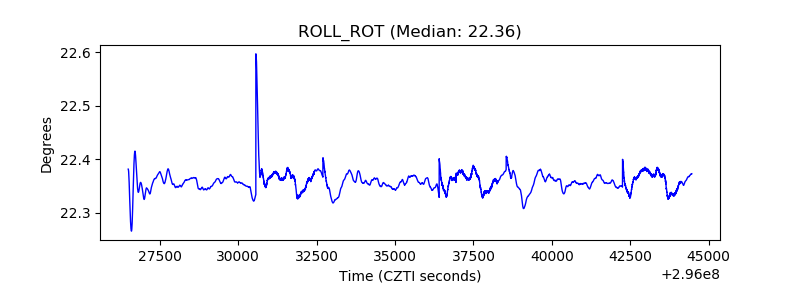 |
| _Roll_DEC | 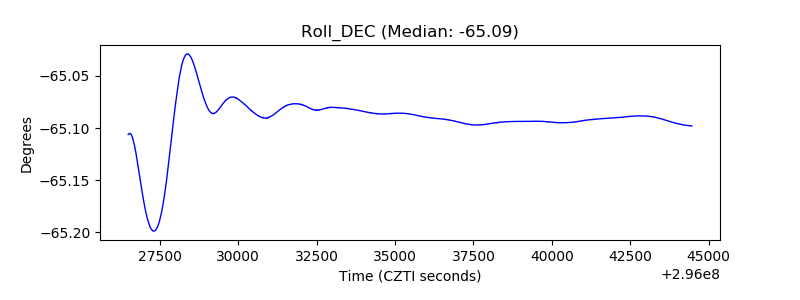 |
| _Roll_RA | 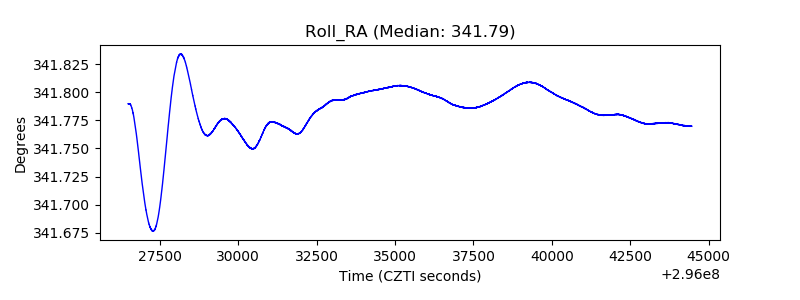 |
| Veto Counter | 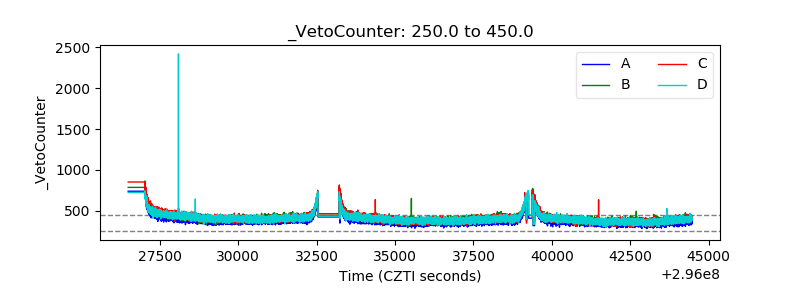 |