| Param | Original file | Final file |
|---|---|---|
| Filename | modeM0/AS1A05_101T05_9000002938_19687cztM0_level2.evt | modeM0/AS1A05_101T05_9000002938_19687cztM0_level2_quad_clean.evt |
| Size (bytes) | 96,393,600 | 27,457,920 |
| Size | 91.9 MB | 26.2 MB |
| Events in quadrant A | 652,700 | 187,128 |
| Events in quadrant B | 655,449 | 189,364 |
| Events in quadrant C | 856,534 | 176,181 |
| Events in quadrant D | 660,655 | 178,346 |
| Mode M9 | |||
|---|---|---|---|
| Quadrant | BADHDUFLAG | Total packets | Discarded packets |
| A | 0 | 6 | 0 |
| B | 0 | 6 | 0 |
| C | 0 | 6 | 0 |
| D | 0 | 6 | 0 |
| Mode SS | |||
|---|---|---|---|
| Quadrant | BADHDUFLAG | Total packets | Discarded packets |
| A | 0 | 26 | 0 |
| B | 0 | 26 | 0 |
| C | 0 | 26 | 0 |
| D | 0 | 26 | 0 |
| Mode M0 | |||
|---|---|---|---|
| Quadrant | BADHDUFLAG | Total packets | Discarded packets |
| A | 0 | 2777 | 1 |
| B | 0 | 2773 | 1 |
| C | 0 | 3330 | 1 |
| D | 0 | 2846 | 2 |
| Quadrant | Total seconds | Saturated seconds | Saturation percentage |
|---|---|---|---|
| A | 1340 | 18 | 1.343284% |
| B | 1340 | 20 | 1.492537% |
| C | 1340 | 81 | 6.044776% |
| D | 1339 | 15 | 1.120239% |
Noise dominated data is calculated using 1-second bins in cleaned event files. If a bin has >2000 counts, and if more than 50% of those come from <1% of pixels, then it is considered to be noise-dominated and hence unusable.
| Quadrant | # 1 sec bins | Bins with >0 counts | Bins with >2000 counts | High rate bins dominated by noise | Noise dominated (total time) | Noise dominated (detector-on time) | Marked lightcurve |
|---|---|---|---|---|---|---|---|
| A | 1340 | 1340 | 0 | 0 | 0.00% | 0.00% | 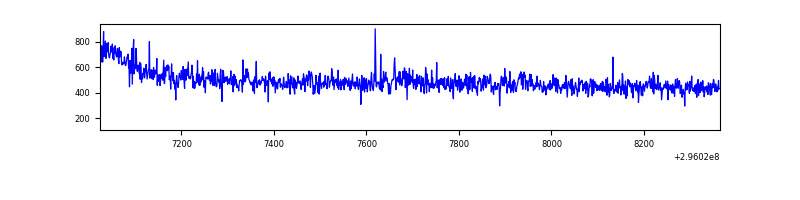 |
| B | 1340 | 1340 | 0 | 0 | 0.00% | 0.00% | 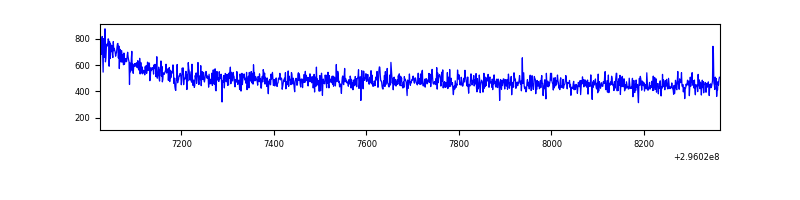 |
| C | 1340 | 1340 | 40 | 40 | 2.99% | 2.99% | 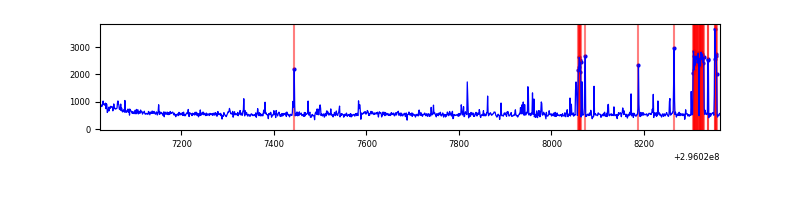 |
| D | 1339 | 1339 | 1 | 1 | 0.07% | 0.07% | 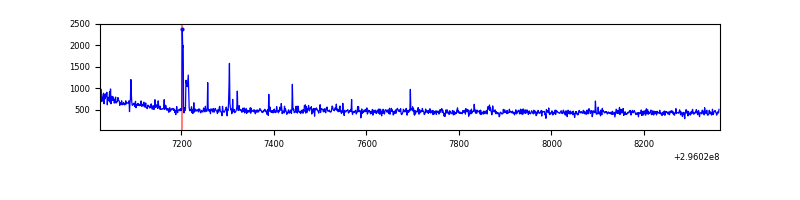 |
Top three noisy pixels from each quadrant. If the there are fewer than three noisy pixels in the level2.evt file, extra rows are filled as -1
| Pixel properties | Quadrant properties | ||||||
|---|---|---|---|---|---|---|---|
| Quadrant | DetID | PixID | Counts | Sigma | Mean | Median | Sigma |
| A | 11 | 29 | 8297 | 233.0 | 166 | 162 | 34.9 |
| A | 13 | 252 | 2602 | 69.89 | 166 | 162 | 34.9 |
| A | 13 | 210 | 1657 | 42.82 | 166 | 162 | 34.9 |
| B | 12 | 111 | 3771 | 107.3 | 166 | 162 | 33.6 |
| B | 11 | 111 | 3324 | 94.01 | 166 | 162 | 33.6 |
| B | 14 | 111 | 2977 | 83.7 | 166 | 162 | 33.6 |
| C | 3 | 233 | 188407 | 4724.7 | 163 | 164 | 39.8 |
| C | 14 | 238 | 25279 | 630.36 | 163 | 164 | 39.8 |
| C | 8 | 208 | 4544 | 109.93 | 163 | 164 | 39.8 |
| D | 1 | 20 | 24149 | 581.58 | 166 | 161 | 41.2 |
| D | 2 | 234 | 4119 | 95.96 | 166 | 161 | 41.2 |
| D | 1 | 52 | 3466 | 80.13 | 166 | 161 | 41.2 |
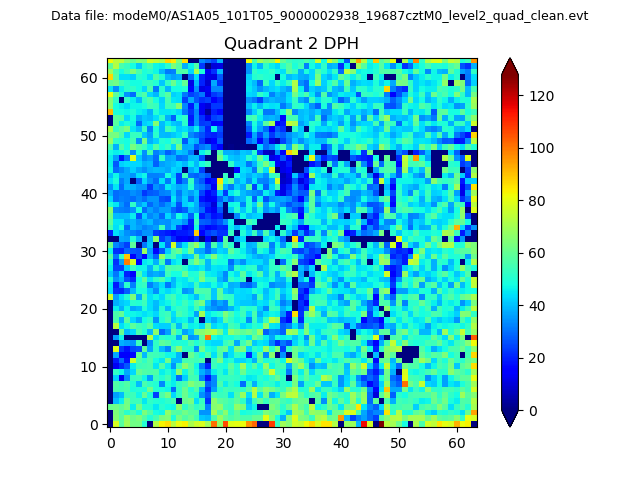
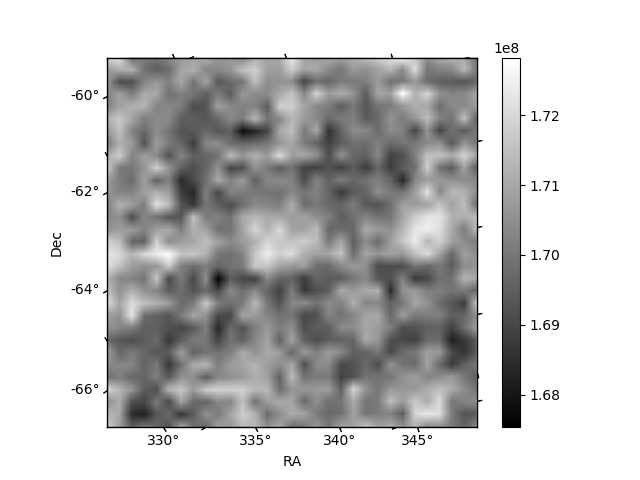
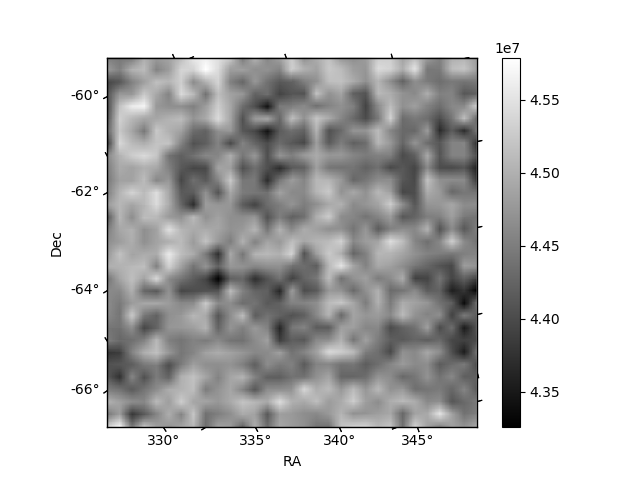
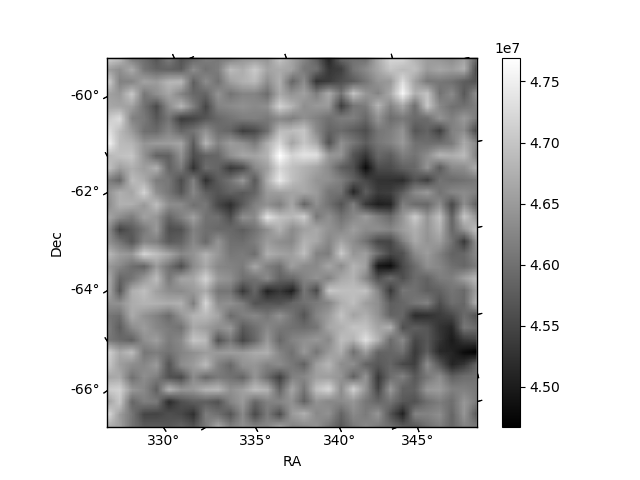
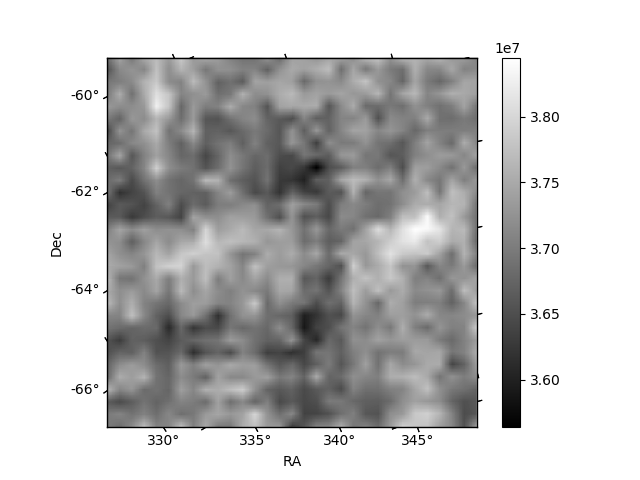
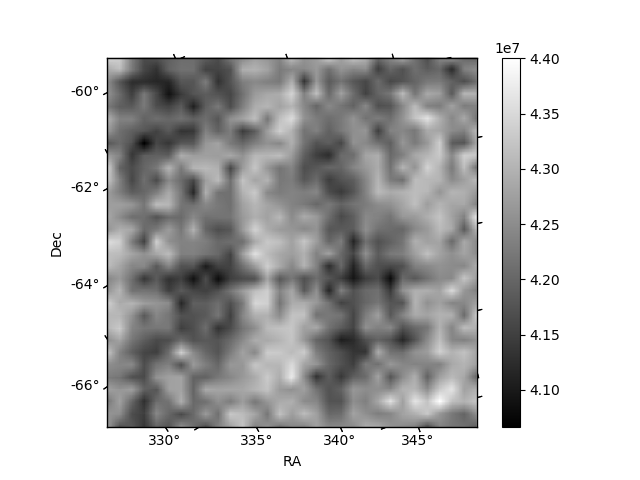
Histogram calculated using DETX and DETY for each event in the final _common_clean file
| Quadrant A | 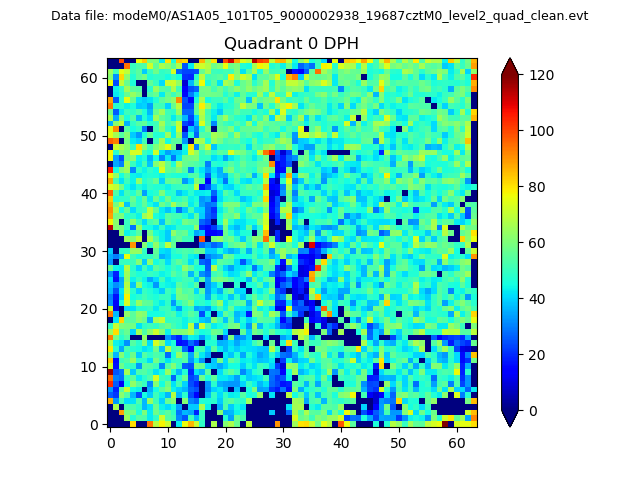 |
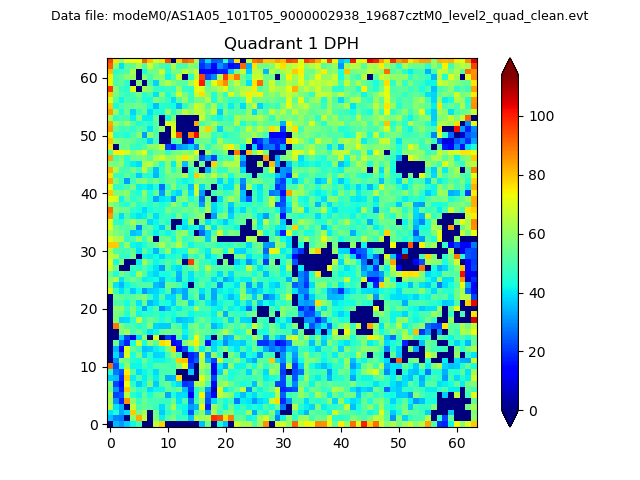 |
Quadrant B |
|---|---|---|---|
| Quadrant D | 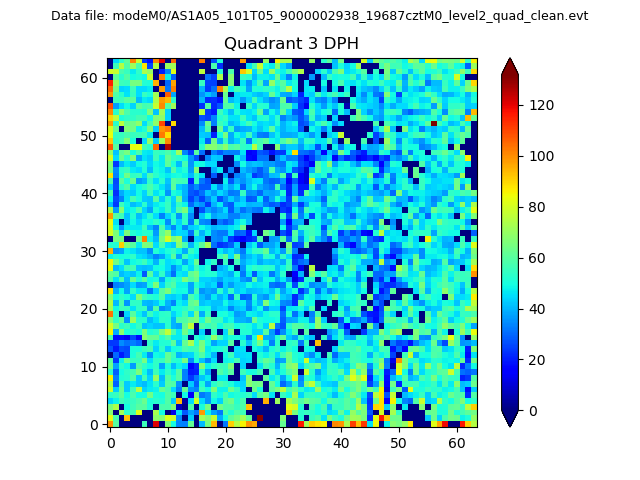 |
 |
Quadrant C |
| Plot type | Count rate plots | Images |
|---|---|---|
| Comparison with Poisson distribution Blue bars denote a histogram of data divided into 1 sec bins. Red curve is a Poisson curve with rate = median count rate of data. |
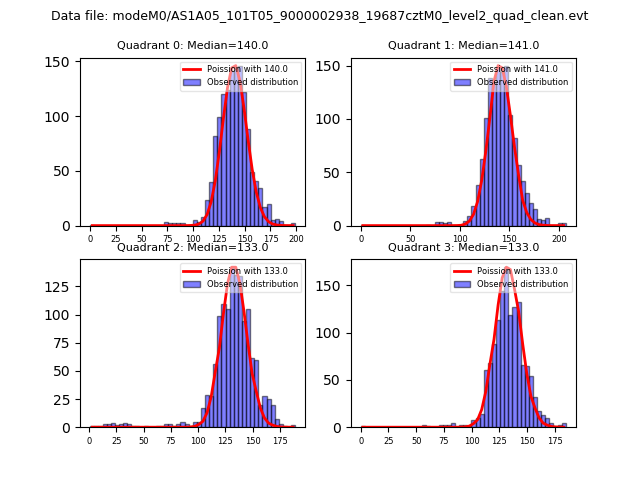 |
 |
| Quadrant-wise count rates Data is divided into 100 sec bins |
 |
|
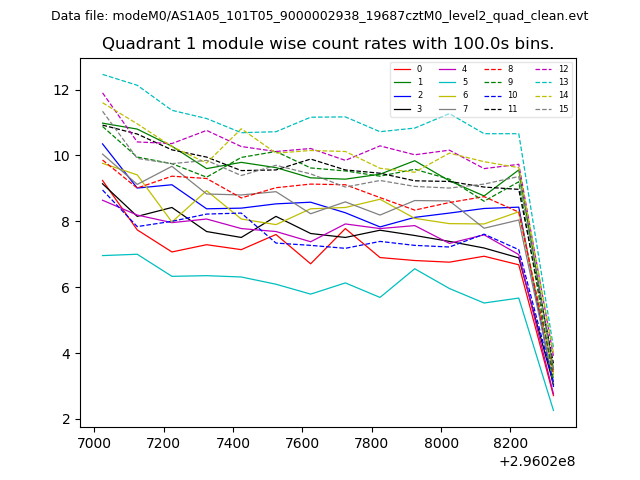
| Module-wise count rates for Quadrant A Data is divided into 100 sec bins |
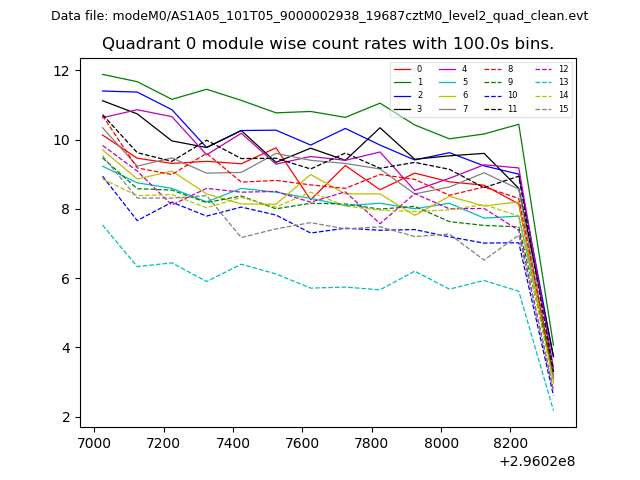 |
 |
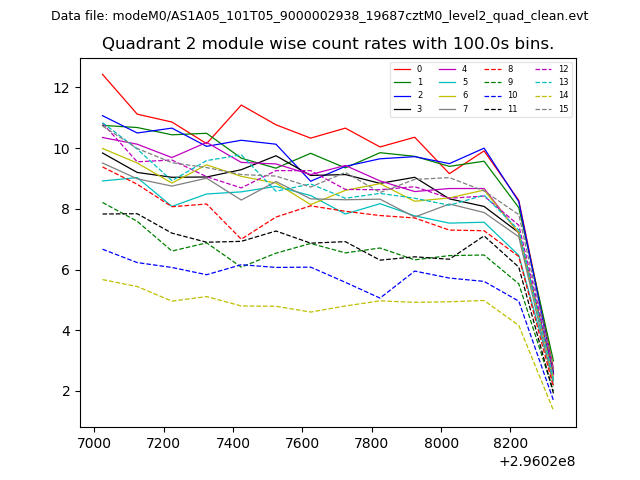
| Module-wise count rates for Quadrant B Data is divided into 100 sec bins |
 |
 |
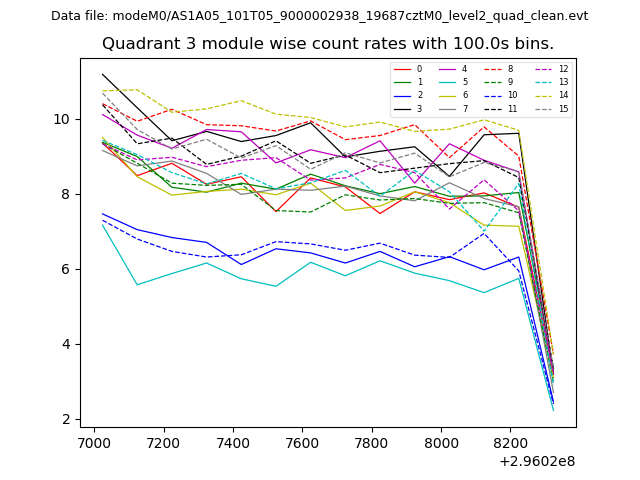
| Module-wise count rates for Quadrant C Data is divided into 100 sec bins |
 |
 |
| Module-wise count rates for Quadrant D Data is divided into 100 sec bins |
 |
 |
| Parameter | Plot |
|---|---|
| CZT HV Monitor | 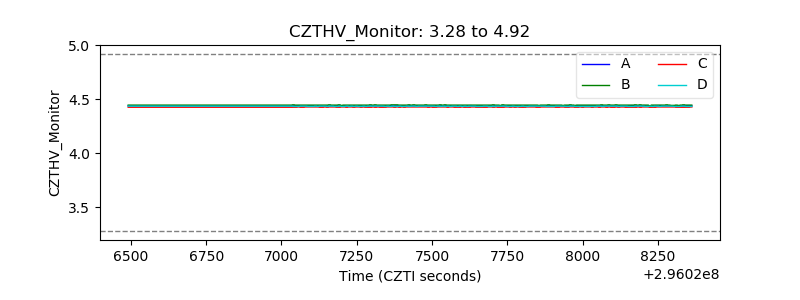 |
| D_VDD | 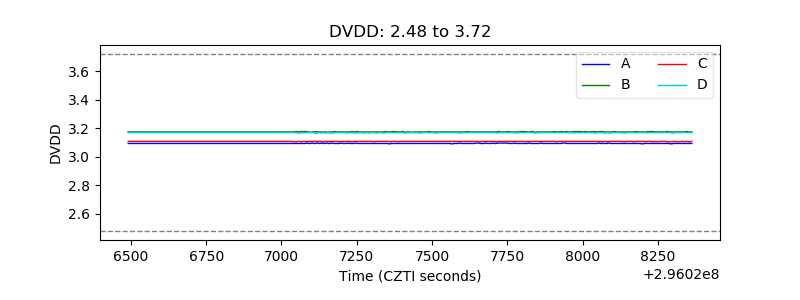 |
| Temperature 1 | 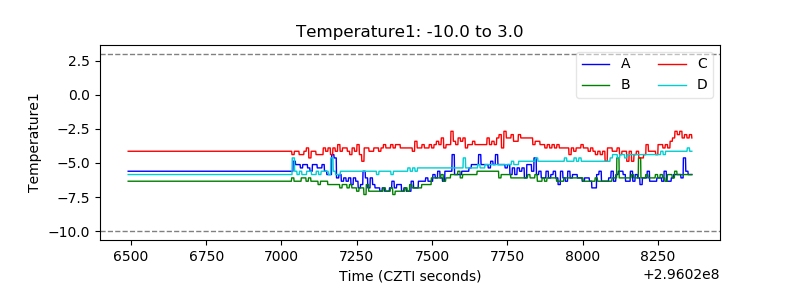 |
| Veto HV Monitor | 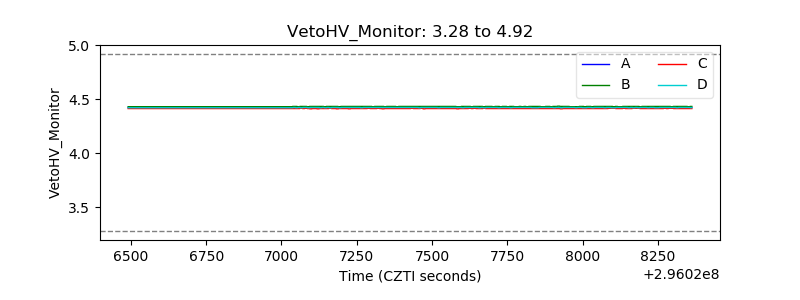 |
| Veto LLD | 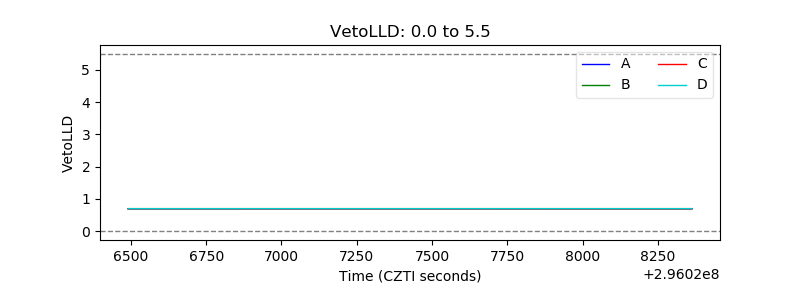 |
| Alpha Counter | 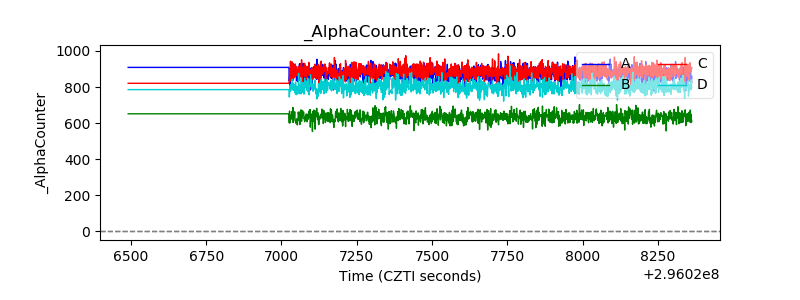 |
| _CPM_Rate | 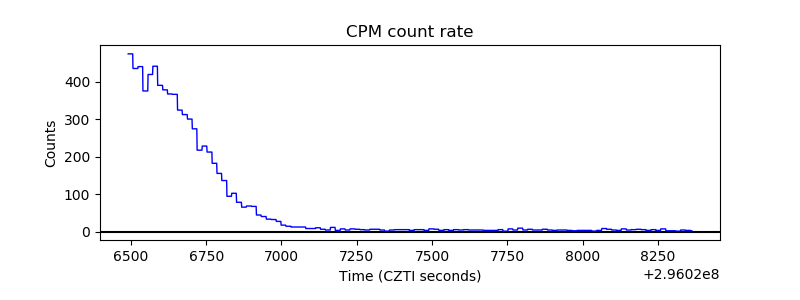 |
| CZT Counter | 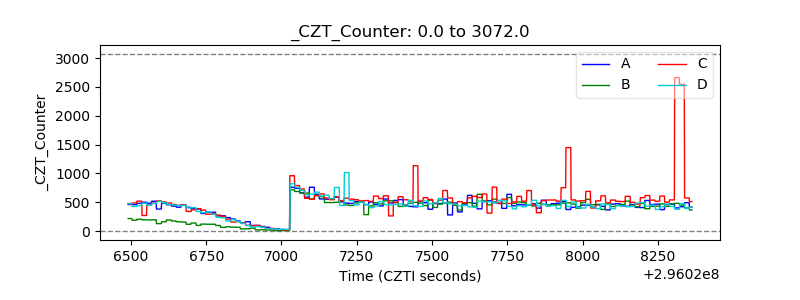 |
| +2.5 Volts monitor |  |
| +5 Volts monitor |  |
| _ROLL_ROT | 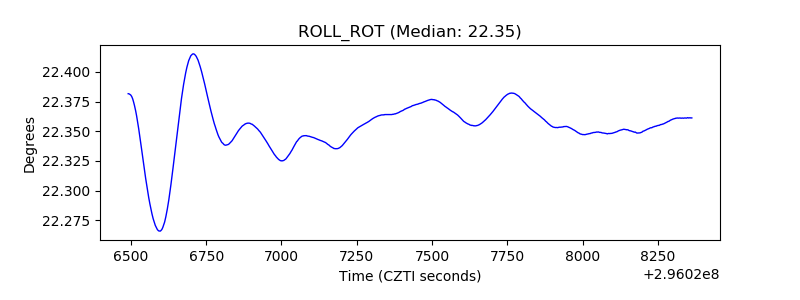 |
| _Roll_DEC | 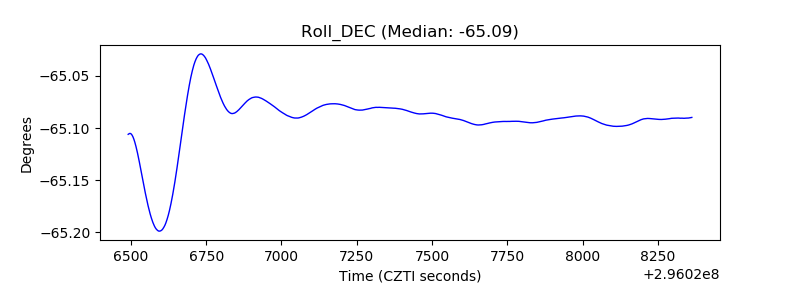 |
| _Roll_RA | 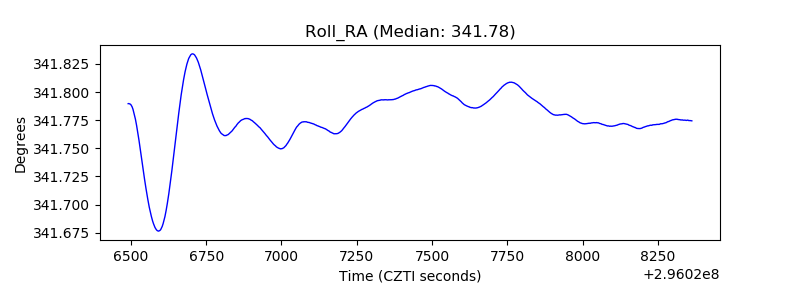 |
| Veto Counter |  |