| Param | Original file | Final file |
|---|---|---|
| Filename | modeM0/AS1A05_101T05_9000002938_19688cztM0_level2.evt | modeM0/AS1A05_101T05_9000002938_19688cztM0_level2_quad_clean.evt |
| Size (bytes) | 479,491,200 | 126,590,400 |
| Size | 457.3 MB | 120.7 MB |
| Events in quadrant A | 3,051,567 | 865,531 |
| Events in quadrant B | 3,136,251 | 870,635 |
| Events in quadrant C | 3,624,016 | 834,929 |
| Events in quadrant D | 4,261,660 | 803,281 |
| Mode M9 | |||
|---|---|---|---|
| Quadrant | BADHDUFLAG | Total packets | Discarded packets |
| A | 0 | 7 | 0 |
| B | 0 | 7 | 0 |
| C | 0 | 7 | 0 |
| D | 0 | 7 | 0 |
| Mode SS | |||
|---|---|---|---|
| Quadrant | BADHDUFLAG | Total packets | Discarded packets |
| A | 0 | 132 | 0 |
| B | 0 | 132 | 0 |
| C | 0 | 132 | 0 |
| D | 0 | 132 | 0 |
| Mode M0 | |||
|---|---|---|---|
| Quadrant | BADHDUFLAG | Total packets | Discarded packets |
| A | 0 | 13452 | 1 |
| B | 0 | 13637 | 1 |
| C | 0 | 14735 | 1 |
| D | 0 | 17169 | 1 |
| Quadrant | Total seconds | Saturated seconds | Saturation percentage |
|---|---|---|---|
| A | 6596 | 100 | 1.516070% |
| B | 6596 | 72 | 1.091571% |
| C | 6596 | 202 | 3.062462% |
| D | 6596 | 499 | 7.565191% |
Noise dominated data is calculated using 1-second bins in cleaned event files. If a bin has >2000 counts, and if more than 50% of those come from <1% of pixels, then it is considered to be noise-dominated and hence unusable.
| Quadrant | # 1 sec bins | Bins with >0 counts | Bins with >2000 counts | High rate bins dominated by noise | Noise dominated (total time) | Noise dominated (detector-on time) | Marked lightcurve |
|---|---|---|---|---|---|---|---|
| A | 7291 | 6597 | 0 | 0 | 0.00% | 0.00% |  |
| B | 7291 | 6597 | 1 | 1 | 0.01% | 0.02% |  |
| C | 7291 | 6597 | 47 | 47 | 0.64% | 0.71% | 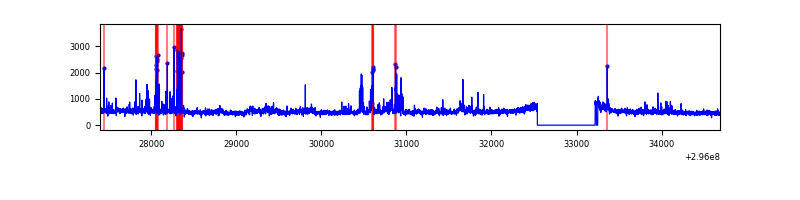 |
| D | 7291 | 6596 | 404 | 404 | 5.54% | 6.12% | 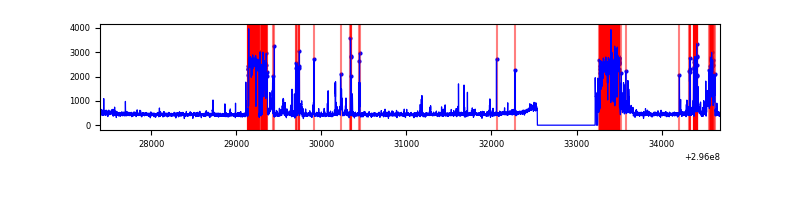 |
Top three noisy pixels from each quadrant. If the there are fewer than three noisy pixels in the level2.evt file, extra rows are filled as -1
| Pixel properties | Quadrant properties | ||||||
|---|---|---|---|---|---|---|---|
| Quadrant | DetID | PixID | Counts | Sigma | Mean | Median | Sigma |
| A | 11 | 29 | 12506 | 74.19 | 788 | 772 | 158.2 |
| A | 0 | 226 | 7032 | 39.58 | 788 | 772 | 158.2 |
| A | 3 | 137 | 6091 | 33.63 | 788 | 772 | 158.2 |
| B | 0 | 197 | 20652 | 135.83 | 779 | 759 | 146.5 |
| B | 12 | 111 | 17542 | 114.59 | 779 | 759 | 146.5 |
| B | 0 | 230 | 17180 | 112.12 | 779 | 759 | 146.5 |
| C | 3 | 233 | 511114 | 2902.87 | 757 | 760 | 175.8 |
| C | 14 | 238 | 118595 | 670.24 | 757 | 760 | 175.8 |
| C | 8 | 208 | 33922 | 188.62 | 757 | 760 | 175.8 |
| D | 7 | 238 | 1251385 | 6926.39 | 748 | 727 | 180.6 |
| D | 1 | 52 | 109659 | 603.29 | 748 | 727 | 180.6 |
| D | 12 | 218 | 39385 | 214.1 | 748 | 727 | 180.6 |
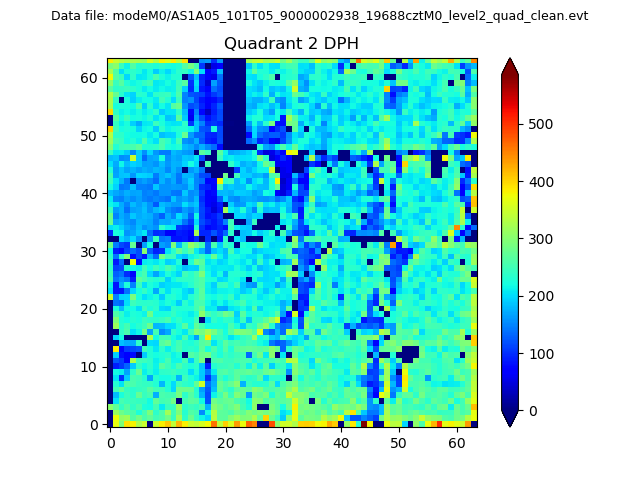
Histogram calculated using DETX and DETY for each event in the final _common_clean file
| Quadrant A | 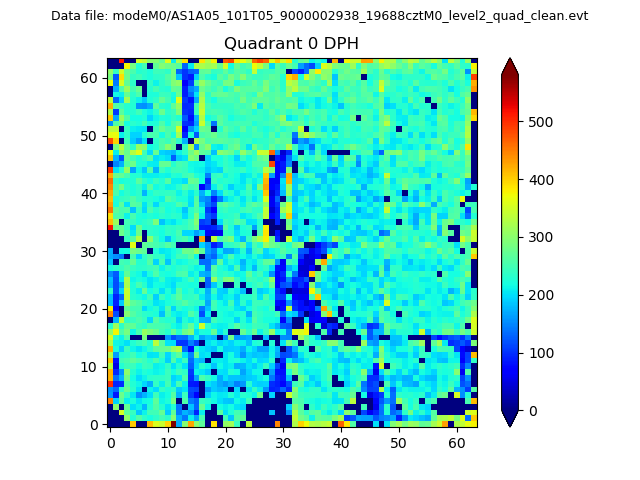 |
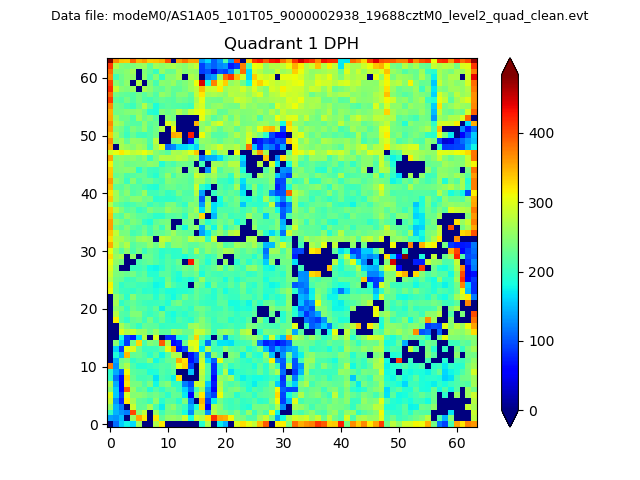 |
Quadrant B |
|---|---|---|---|
| Quadrant D | 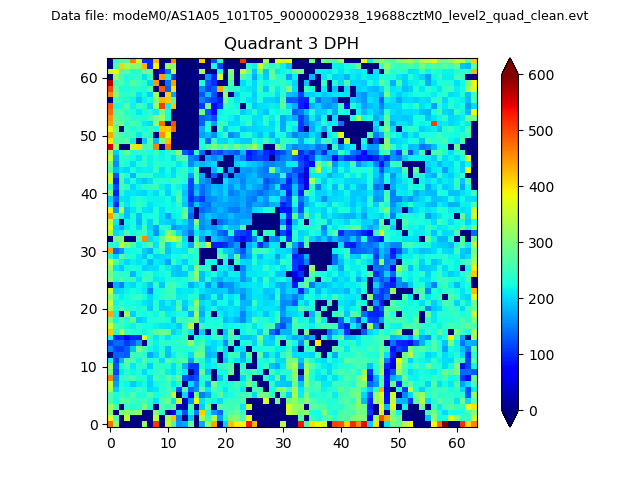 |
 |
Quadrant C |
| Plot type | Count rate plots | Images |
|---|---|---|
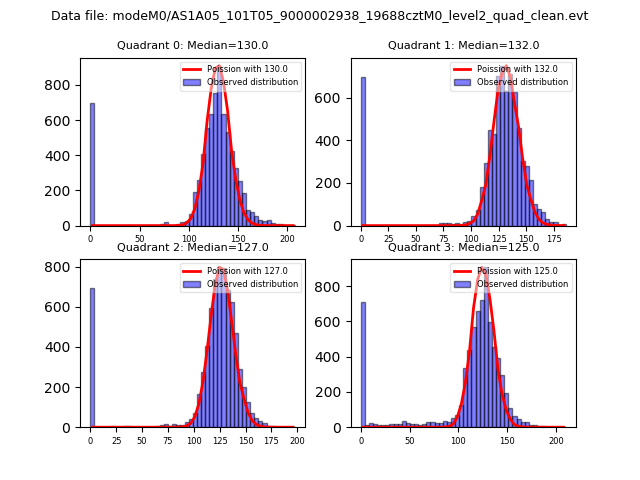
| Comparison with Poisson distribution Blue bars denote a histogram of data divided into 1 sec bins. Red curve is a Poisson curve with rate = median count rate of data. |
 |
 |
| Quadrant-wise count rates Data is divided into 100 sec bins |
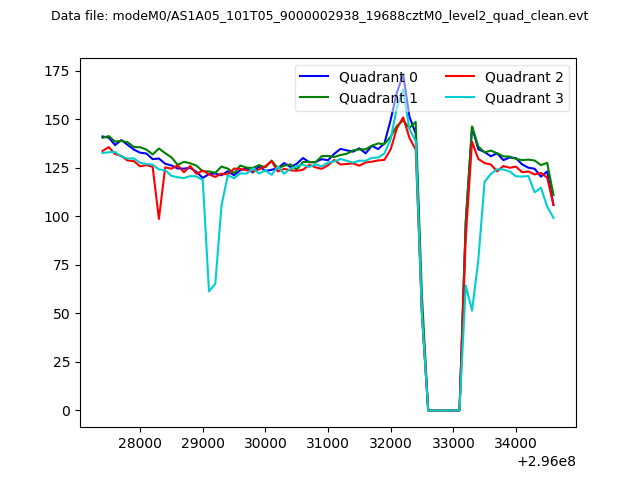 |
|
| Module-wise count rates for Quadrant A Data is divided into 100 sec bins |
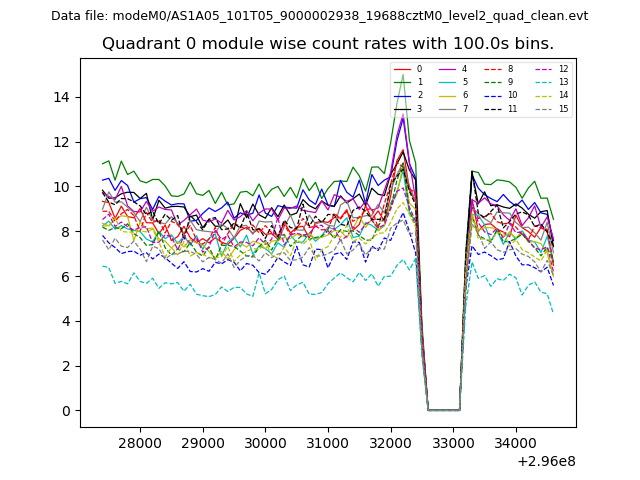 |
 |
| Module-wise count rates for Quadrant B Data is divided into 100 sec bins |
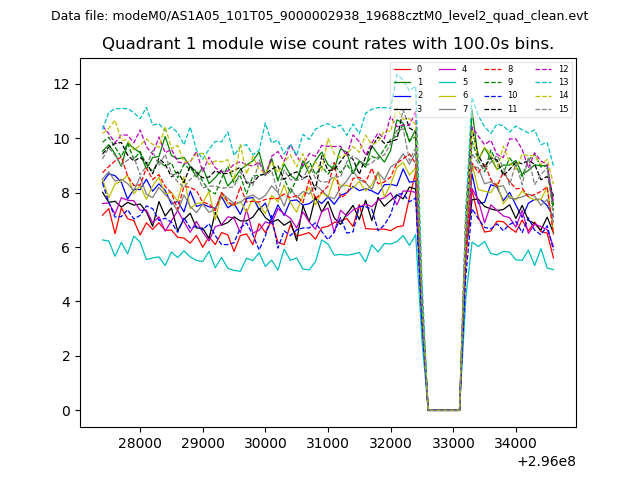 |
 |
| Module-wise count rates for Quadrant C Data is divided into 100 sec bins |
 |
 |
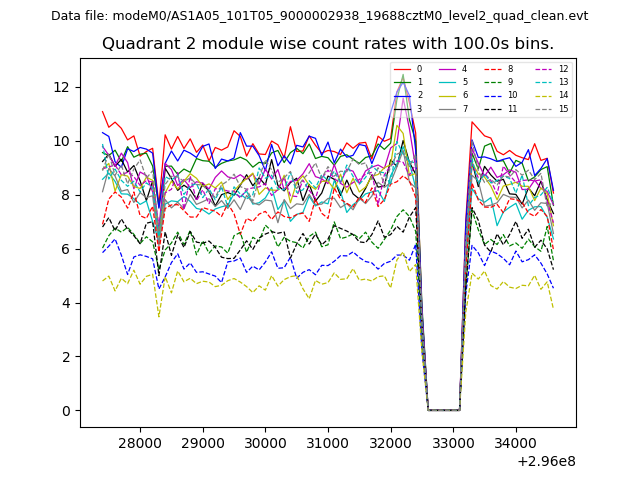
| Module-wise count rates for Quadrant D Data is divided into 100 sec bins |
 |
 |
| Parameter | Plot |
|---|---|
| CZT HV Monitor |  |
| D_VDD | 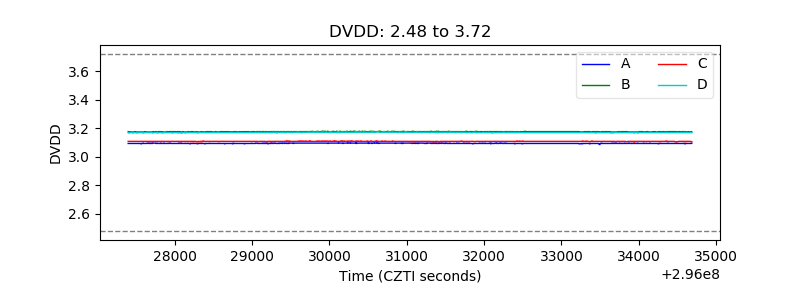 |
| Temperature 1 | 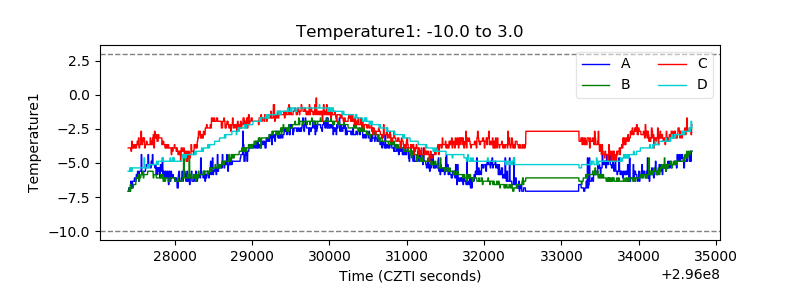 |
| Veto HV Monitor | 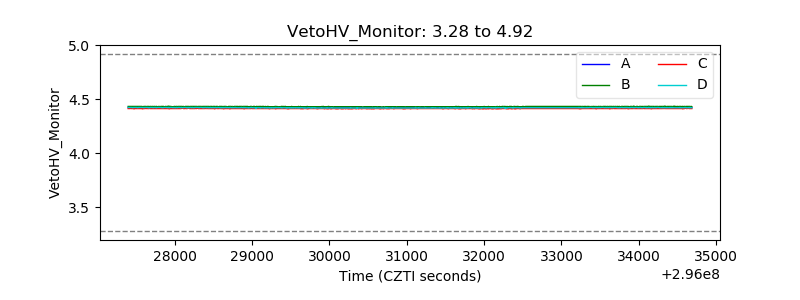 |
| Veto LLD | 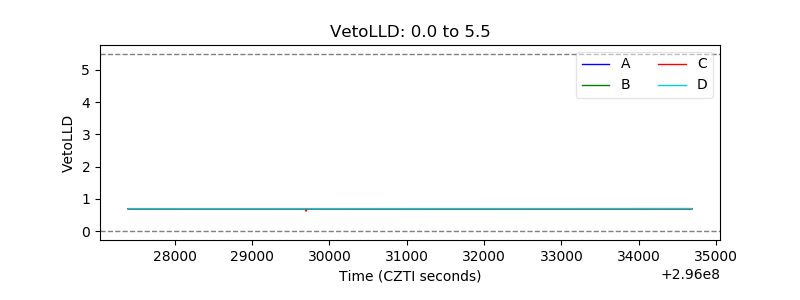 |
| Alpha Counter | 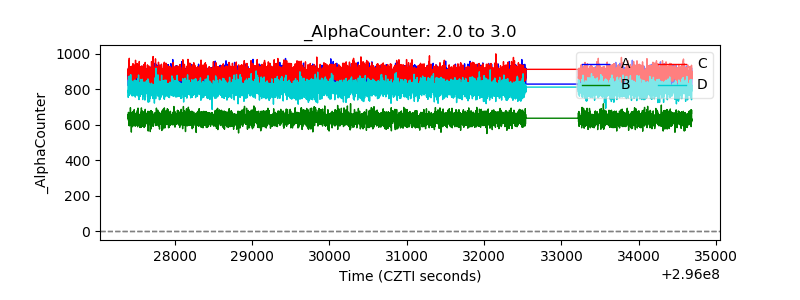 |
| _CPM_Rate | 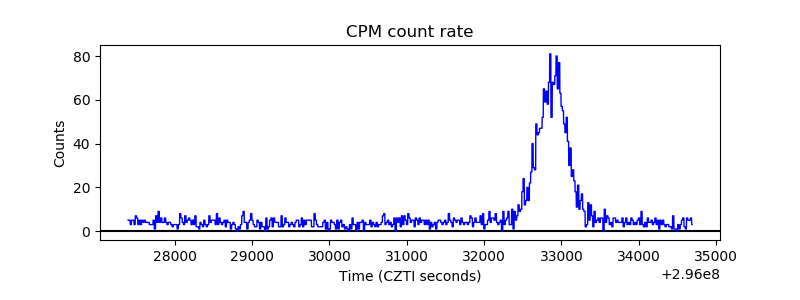 |
| CZT Counter | 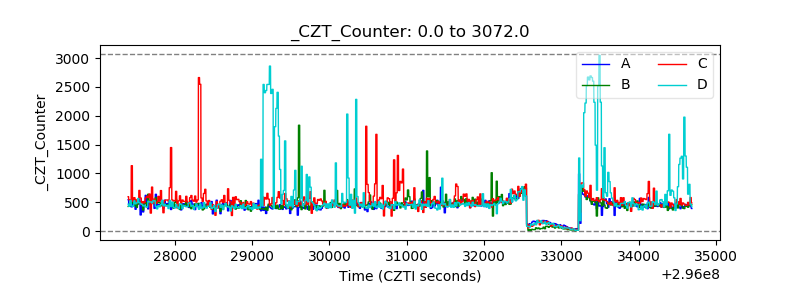 |
| +2.5 Volts monitor | 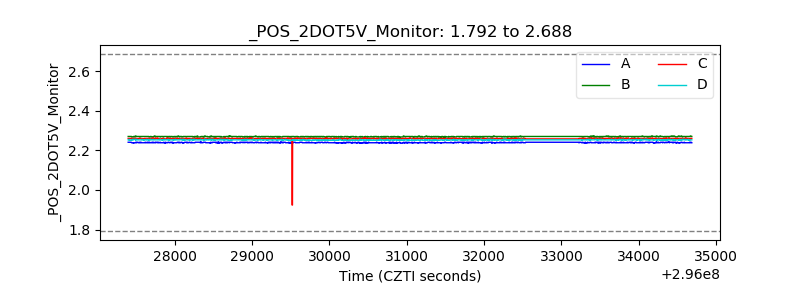 |
| +5 Volts monitor | 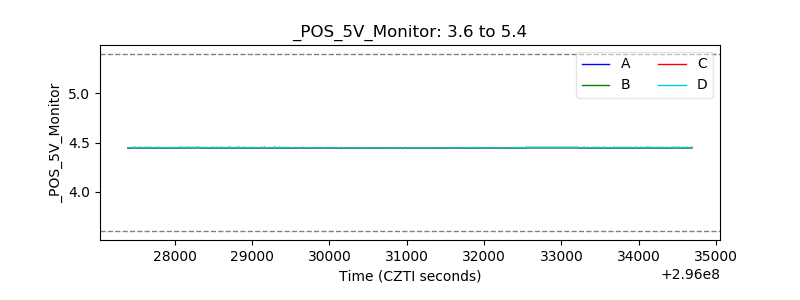 |
| _ROLL_ROT | 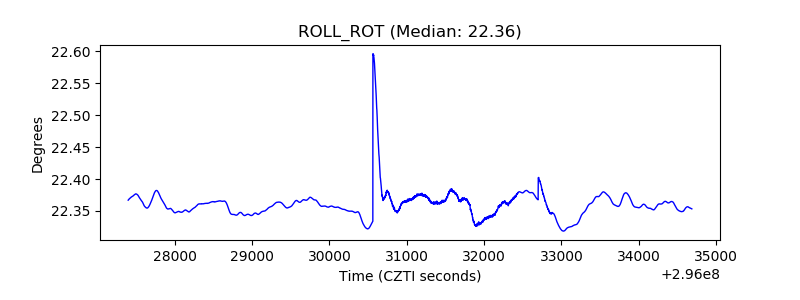 |
| _Roll_DEC | 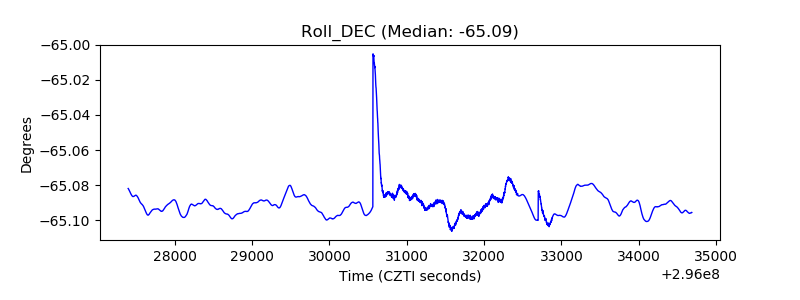 |
| _Roll_RA | 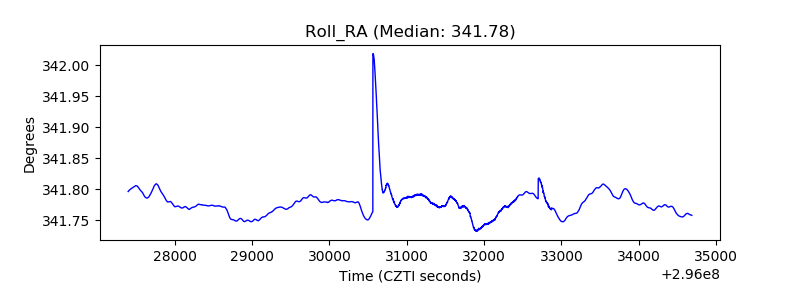 |
| Veto Counter |  |