| Param | Original file | Final file |
|---|---|---|
| Filename | modeM0/AS1A05_101T05_9000002938_19689cztM0_level2.evt | modeM0/AS1A05_101T05_9000002938_19689cztM0_level2_quad_clean.evt |
| Size (bytes) | 521,118,720 | 142,637,760 |
| Size | 497.0 MB | 136.0 MB |
| Events in quadrant A | 3,472,711 | 960,454 |
| Events in quadrant B | 3,682,920 | 967,820 |
| Events in quadrant C | 3,746,044 | 937,162 |
| Events in quadrant D | 4,358,246 | 920,207 |
| Mode M9 | |||
|---|---|---|---|
| Quadrant | BADHDUFLAG | Total packets | Discarded packets |
| A | 0 | 2 | 0 |
| B | 0 | 2 | 0 |
| C | 0 | 2 | 0 |
| D | 0 | 2 | 0 |
| Mode SS | |||
|---|---|---|---|
| Quadrant | BADHDUFLAG | Total packets | Discarded packets |
| A | 0 | 158 | 0 |
| B | 0 | 158 | 0 |
| C | 0 | 158 | 0 |
| D | 0 | 158 | 0 |
| Mode M0 | |||
|---|---|---|---|
| Quadrant | BADHDUFLAG | Total packets | Discarded packets |
| A | 0 | 15669 | 2 |
| B | 0 | 16053 | 2 |
| C | 0 | 15915 | 2 |
| D | 0 | 18343 | 2 |
| Quadrant | Total seconds | Saturated seconds | Saturation percentage |
|---|---|---|---|
| A | 7681 | 201 | 2.616847% |
| B | 7682 | 223 | 2.902890% |
| C | 7682 | 251 | 3.267378% |
| D | 7681 | 342 | 4.452545% |
Noise dominated data is calculated using 1-second bins in cleaned event files. If a bin has >2000 counts, and if more than 50% of those come from <1% of pixels, then it is considered to be noise-dominated and hence unusable.
| Quadrant | # 1 sec bins | Bins with >0 counts | Bins with >2000 counts | High rate bins dominated by noise | Noise dominated (total time) | Noise dominated (detector-on time) | Marked lightcurve |
|---|---|---|---|---|---|---|---|
| A | 7871 | 7681 | 0 | 0 | 0.00% | 0.00% | 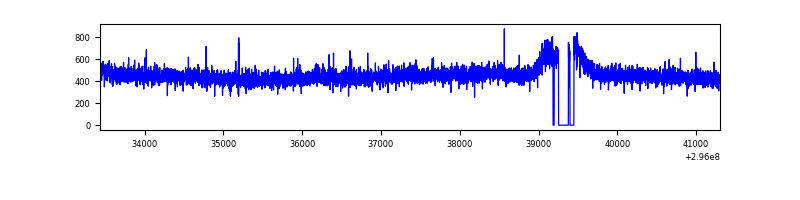 |
| B | 7872 | 7683 | 10 | 10 | 0.13% | 0.13% | 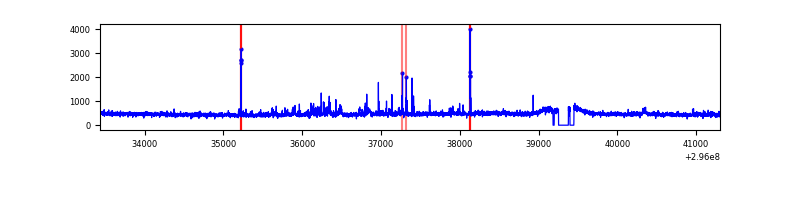 |
| C | 7872 | 7683 | 0 | 0 | 0.00% | 0.00% |  |
| D | 7871 | 7682 | 179 | 179 | 2.27% | 2.33% | 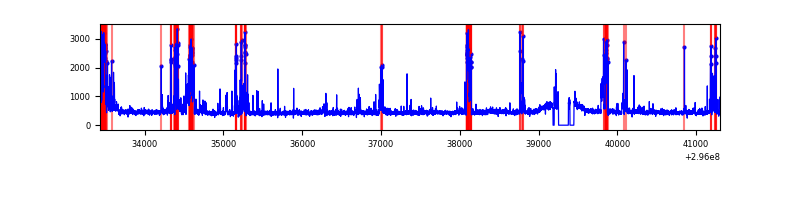 |
Top three noisy pixels from each quadrant. If the there are fewer than three noisy pixels in the level2.evt file, extra rows are filled as -1
| Pixel properties | Quadrant properties | ||||||
|---|---|---|---|---|---|---|---|
| Quadrant | DetID | PixID | Counts | Sigma | Mean | Median | Sigma |
| A | 0 | 226 | 7713 | 37.76 | 900 | 879 | 181.0 |
| A | 3 | 137 | 7314 | 35.55 | 900 | 879 | 181.0 |
| A | 12 | 194 | 6574 | 31.46 | 900 | 879 | 181.0 |
| B | 4 | 216 | 67272 | 392.54 | 895 | 870 | 169.2 |
| B | 0 | 198 | 29927 | 171.77 | 895 | 870 | 169.2 |
| B | 0 | 230 | 21323 | 120.91 | 895 | 870 | 169.2 |
| C | 14 | 238 | 136354 | 663.76 | 873 | 877 | 204.1 |
| C | 3 | 233 | 133018 | 647.42 | 873 | 877 | 204.1 |
| C | 8 | 208 | 58525 | 282.44 | 873 | 877 | 204.1 |
| D | 7 | 238 | 842214 | 4032.92 | 879 | 854 | 208.6 |
| D | 1 | 52 | 91829 | 436.07 | 879 | 854 | 208.6 |
| D | 12 | 218 | 76233 | 361.32 | 879 | 854 | 208.6 |
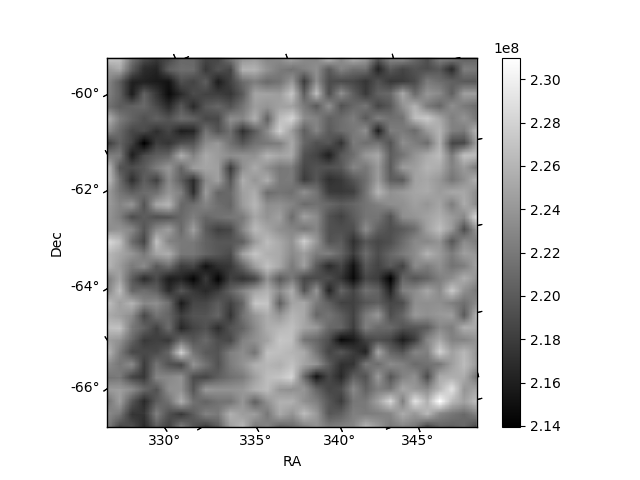
Histogram calculated using DETX and DETY for each event in the final _common_clean file
| Quadrant A |  |
 |
Quadrant B |
|---|---|---|---|
| Quadrant D |  |
 |
Quadrant C |
| Plot type | Count rate plots | Images |
|---|---|---|
| Comparison with Poisson distribution Blue bars denote a histogram of data divided into 1 sec bins. Red curve is a Poisson curve with rate = median count rate of data. |
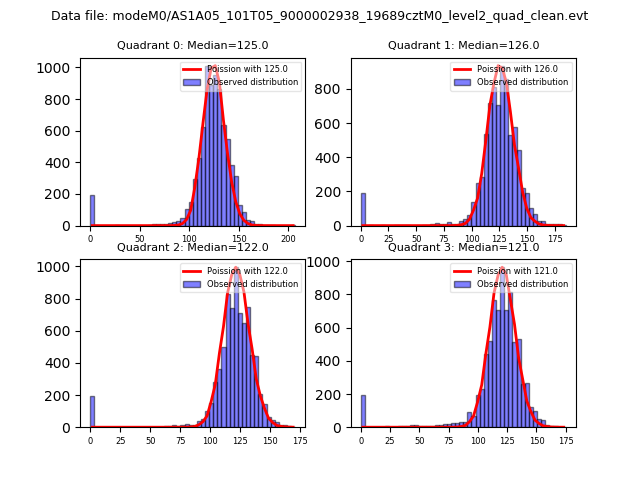 |
 |
| Quadrant-wise count rates Data is divided into 100 sec bins |
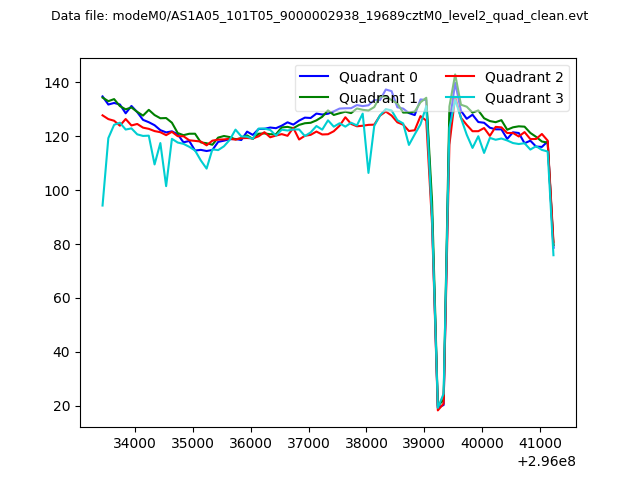 |
|
| Module-wise count rates for Quadrant A Data is divided into 100 sec bins |
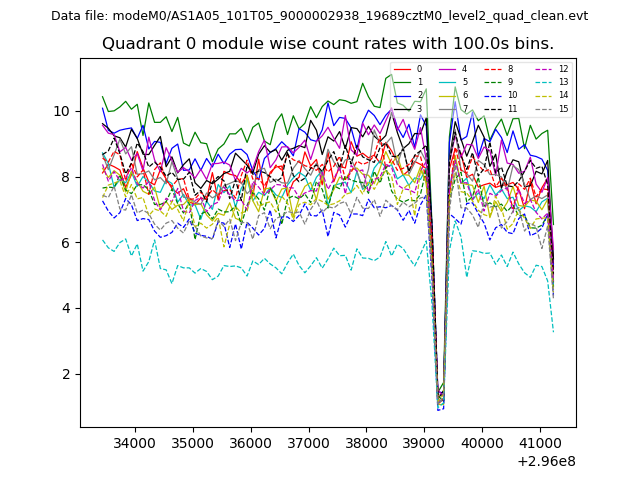 |
 |
| Module-wise count rates for Quadrant B Data is divided into 100 sec bins |
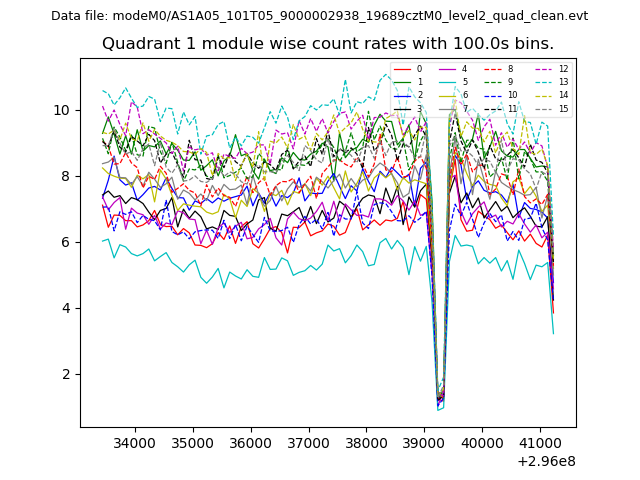 |
 |
| Module-wise count rates for Quadrant C Data is divided into 100 sec bins |
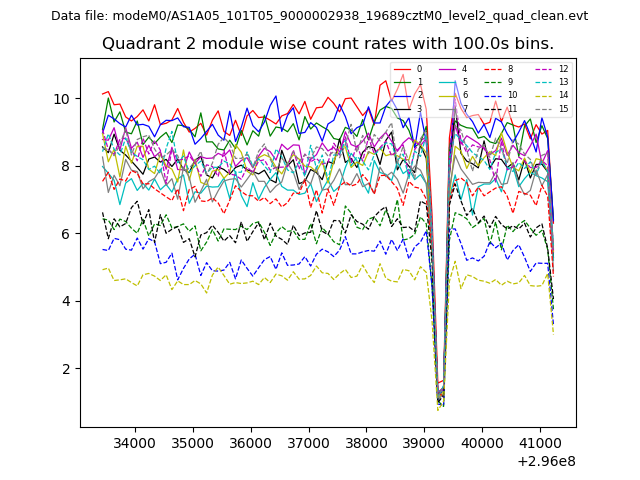 |
 |
| Module-wise count rates for Quadrant D Data is divided into 100 sec bins |
 |
 |
| Parameter | Plot |
|---|---|
| CZT HV Monitor | 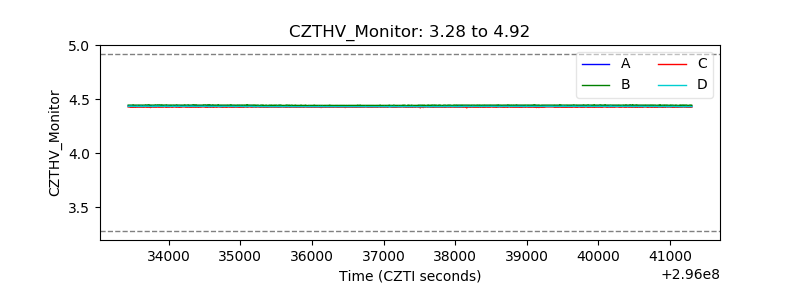 |
| D_VDD |  |
| Temperature 1 |  |
| Veto HV Monitor |  |
| Veto LLD |  |
| Alpha Counter | 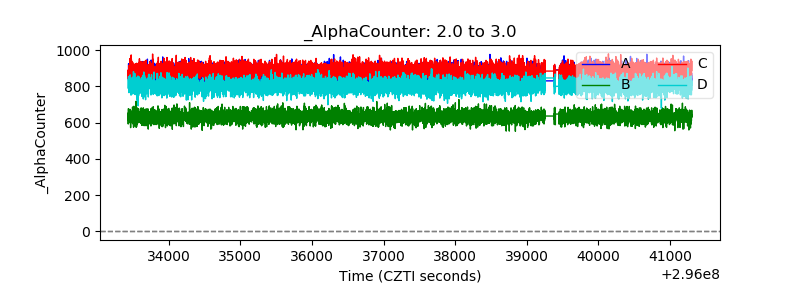 |
| _CPM_Rate | 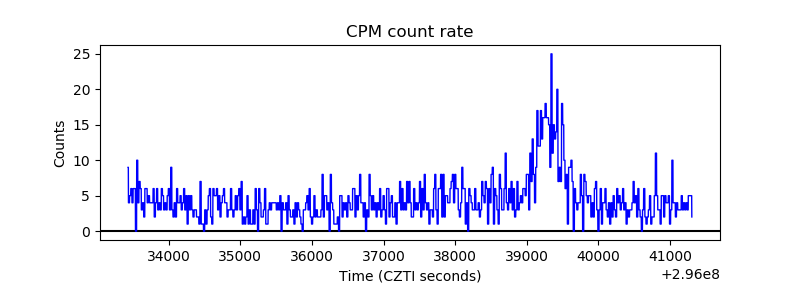 |
| CZT Counter |  |
| +2.5 Volts monitor |  |
| +5 Volts monitor |  |
| _ROLL_ROT |  |
| _Roll_DEC |  |
| _Roll_RA |  |
| Veto Counter |  |