| Param | Original file | Final file |
|---|---|---|
| Filename | modeM0/AS1A05_101T05_9000002938_19691cztM0_level2.evt | modeM0/AS1A05_101T05_9000002938_19691cztM0_level2_quad_clean.evt |
| Size (bytes) | 243,187,200 | 62,602,560 |
| Size | 231.9 MB | 59.7 MB |
| Events in quadrant A | 1,482,550 | 422,555 |
| Events in quadrant B | 1,590,787 | 420,814 |
| Events in quadrant C | 1,552,594 | 409,633 |
| Events in quadrant D | 2,502,934 | 398,339 |
| Mode SS | |||
|---|---|---|---|
| Quadrant | BADHDUFLAG | Total packets | Discarded packets |
| A | 0 | 68 | 0 |
| B | 0 | 68 | 0 |
| C | 0 | 68 | 0 |
| D | 0 | 68 | 0 |
| Mode M0 | |||
|---|---|---|---|
| Quadrant | BADHDUFLAG | Total packets | Discarded packets |
| A | 0 | 6909 | 0 |
| B | 0 | 7090 | 0 |
| C | 0 | 7023 | 0 |
| D | 0 | 9865 | 0 |
| Quadrant | Total seconds | Saturated seconds | Saturation percentage |
|---|---|---|---|
| A | 3449 | 1 | 0.028994% |
| B | 3450 | 6 | 0.173913% |
| C | 3450 | 21 | 0.608696% |
| D | 3450 | 190 | 5.507246% |
Noise dominated data is calculated using 1-second bins in cleaned event files. If a bin has >2000 counts, and if more than 50% of those come from <1% of pixels, then it is considered to be noise-dominated and hence unusable.
| Quadrant | # 1 sec bins | Bins with >0 counts | Bins with >2000 counts | High rate bins dominated by noise | Noise dominated (total time) | Noise dominated (detector-on time) | Marked lightcurve |
|---|---|---|---|---|---|---|---|
| A | 3449 | 3449 | 0 | 0 | 0.00% | 0.00% | 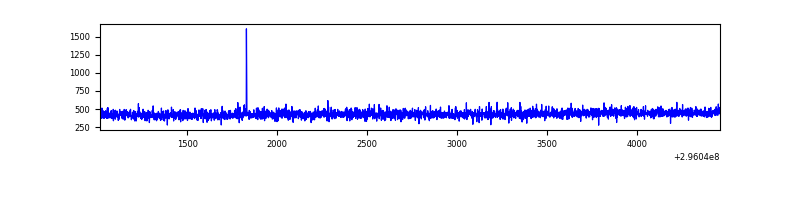 |
| B | 3450 | 3450 | 0 | 0 | 0.00% | 0.00% | 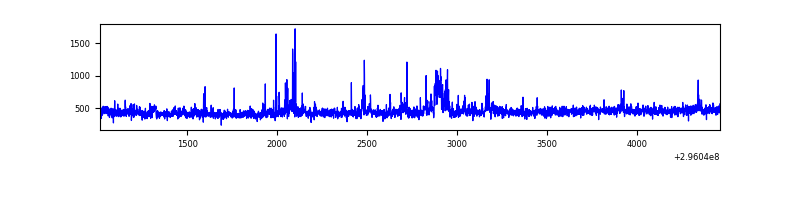 |
| C | 3450 | 3450 | 12 | 12 | 0.35% | 0.35% | 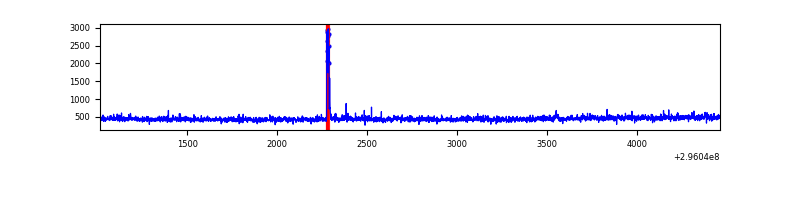 |
| D | 3450 | 3450 | 191 | 191 | 5.54% | 5.54% | 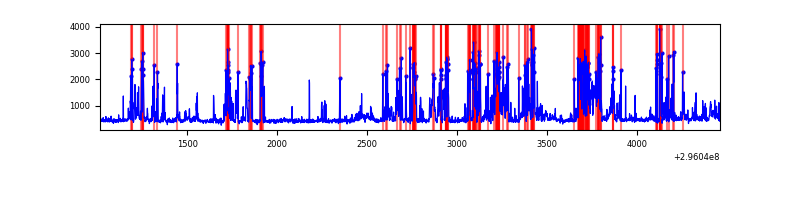 |
Top three noisy pixels from each quadrant. If the there are fewer than three noisy pixels in the level2.evt file, extra rows are filled as -1
| Pixel properties | Quadrant properties | ||||||
|---|---|---|---|---|---|---|---|
| Quadrant | DetID | PixID | Counts | Sigma | Mean | Median | Sigma |
| A | 5 | 16 | 4414 | 50.95 | 384 | 375 | 79.3 |
| A | 0 | 226 | 3340 | 37.4 | 384 | 375 | 79.3 |
| A | 3 | 137 | 3040 | 33.62 | 384 | 375 | 79.3 |
| B | 0 | 197 | 37054 | 498.1 | 381 | 372 | 73.6 |
| B | 0 | 190 | 18996 | 252.9 | 381 | 372 | 73.6 |
| B | 4 | 216 | 17583 | 233.71 | 381 | 372 | 73.6 |
| C | 14 | 238 | 56914 | 652.82 | 363 | 365 | 86.6 |
| C | 9 | 221 | 42714 | 488.89 | 363 | 365 | 86.6 |
| C | 8 | 208 | 20344 | 230.64 | 363 | 365 | 86.6 |
| D | 7 | 238 | 695045 | 7753.18 | 365 | 353 | 89.6 |
| D | 1 | 52 | 166321 | 1852.3 | 365 | 353 | 89.6 |
| D | 12 | 218 | 115222 | 1282.01 | 365 | 353 | 89.6 |
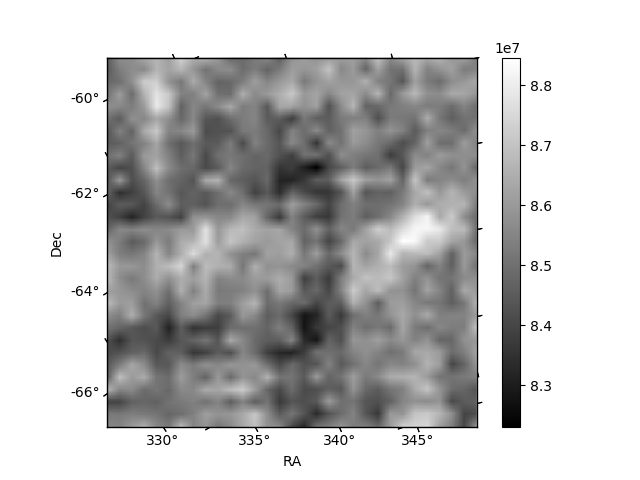
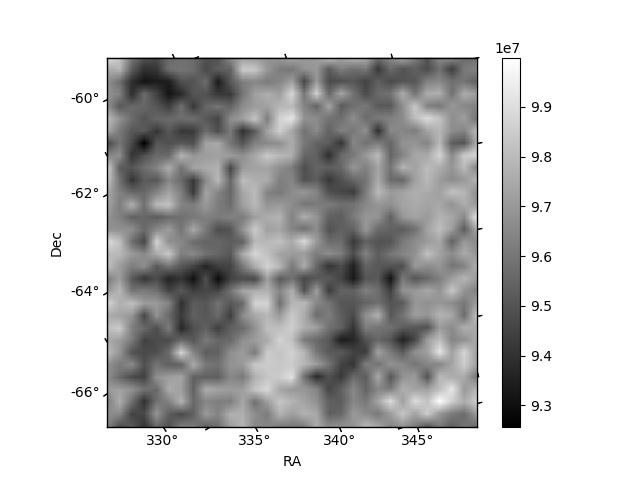
Histogram calculated using DETX and DETY for each event in the final _common_clean file
| Quadrant A |  |
 |
Quadrant B |
|---|---|---|---|
| Quadrant D | 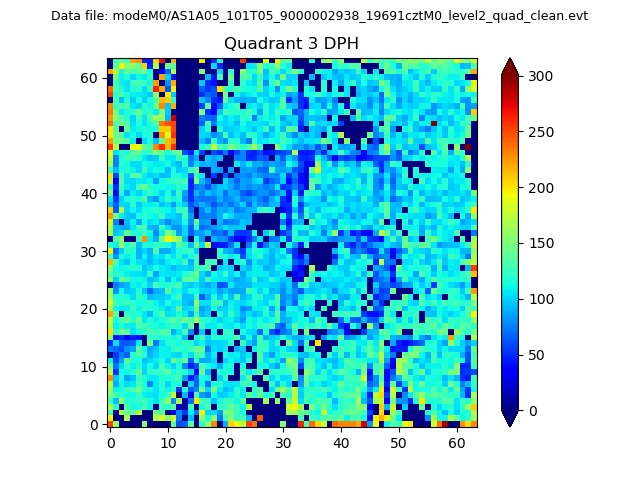 |
 |
Quadrant C |
| Plot type | Count rate plots | Images |
|---|---|---|
| Comparison with Poisson distribution Blue bars denote a histogram of data divided into 1 sec bins. Red curve is a Poisson curve with rate = median count rate of data. |
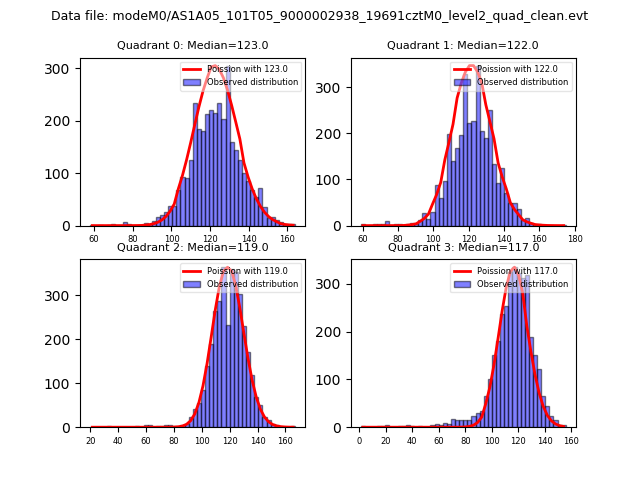 |
 |
| Quadrant-wise count rates Data is divided into 100 sec bins |
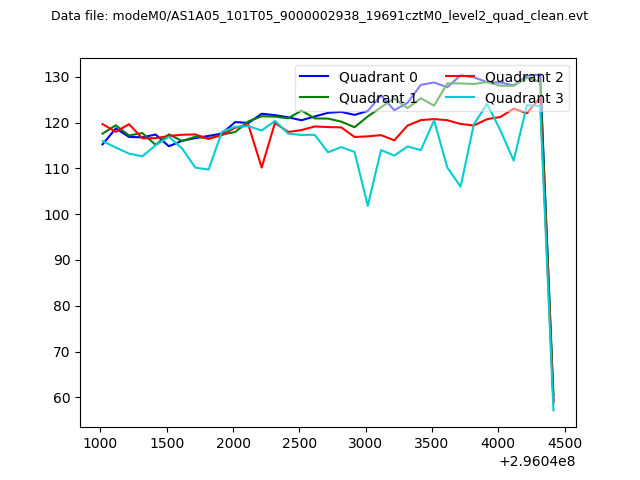 |
|
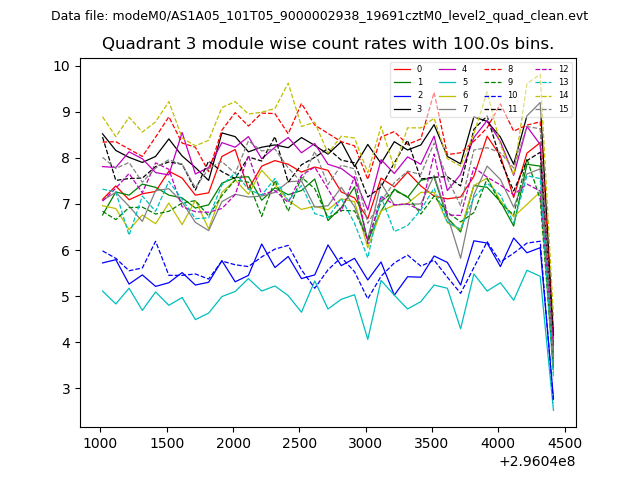
| Module-wise count rates for Quadrant A Data is divided into 100 sec bins |
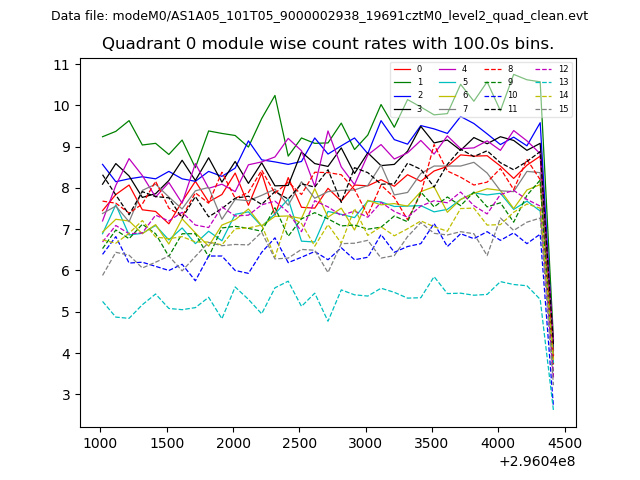 |
 |
| Module-wise count rates for Quadrant B Data is divided into 100 sec bins |
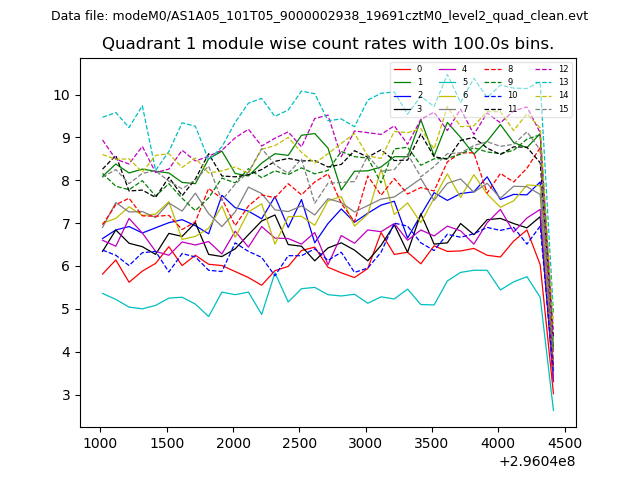 |
 |
| Module-wise count rates for Quadrant C Data is divided into 100 sec bins |
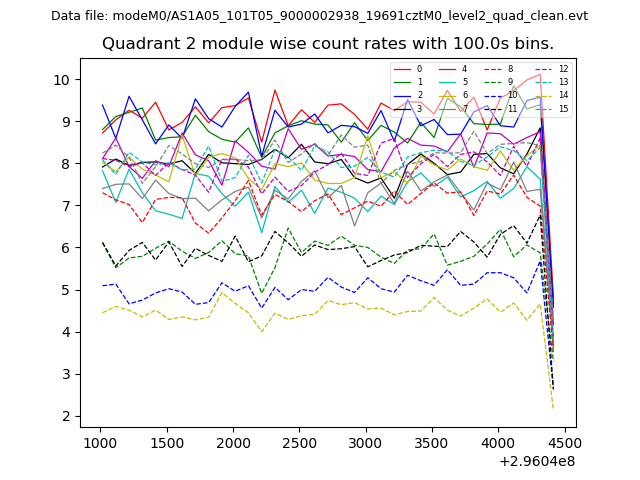 |
 |
| Module-wise count rates for Quadrant D Data is divided into 100 sec bins |
 |
 |
| Parameter | Plot |
|---|---|
| CZT HV Monitor | 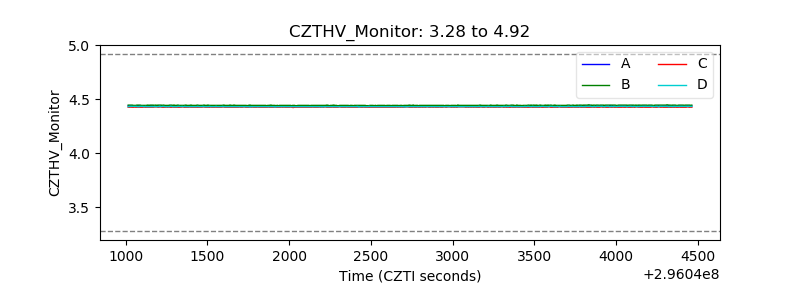 |
| D_VDD | 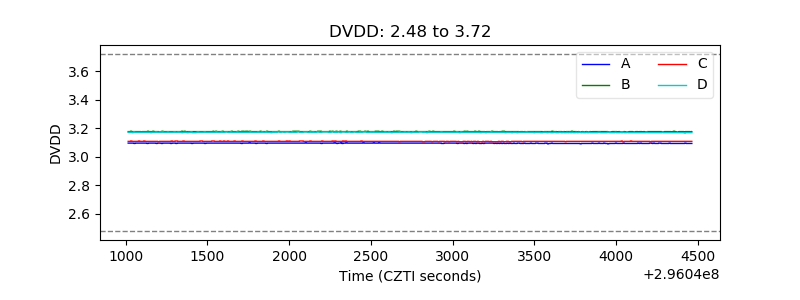 |
| Temperature 1 | 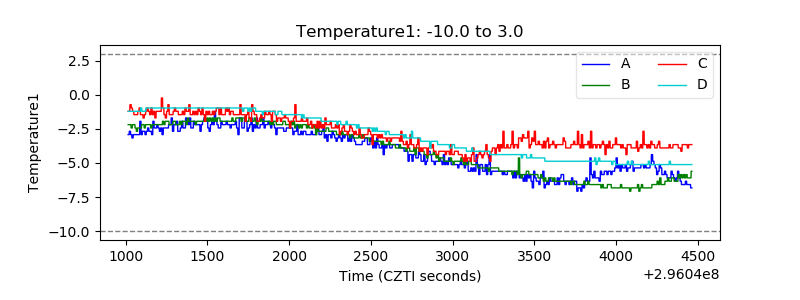 |
| Veto HV Monitor | 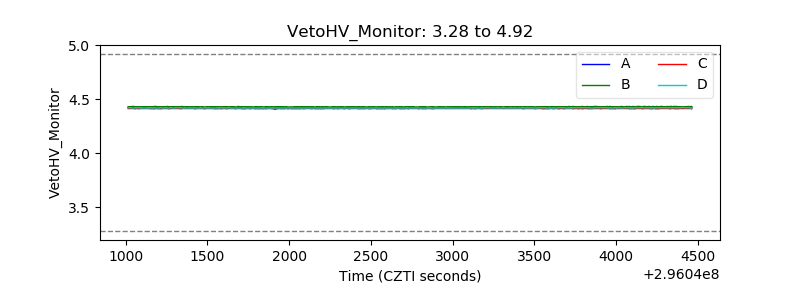 |
| Veto LLD | 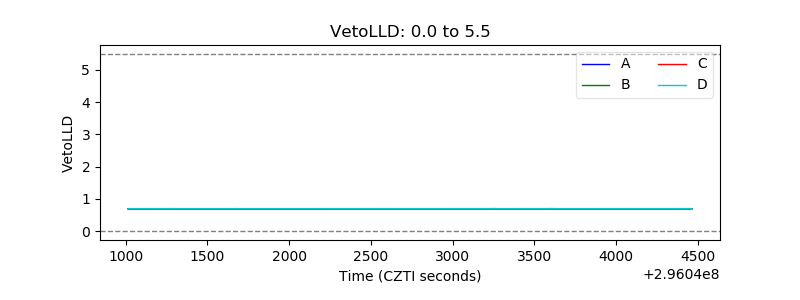 |
| Alpha Counter | 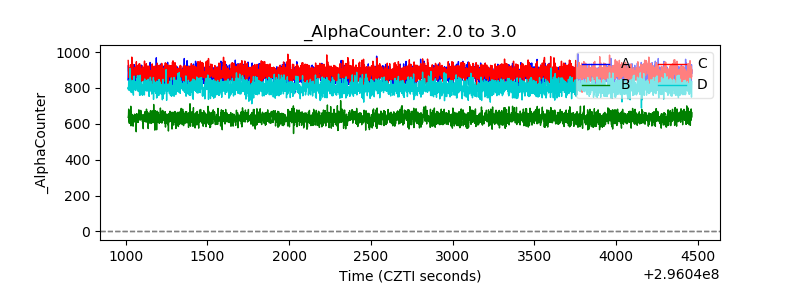 |
| _CPM_Rate | 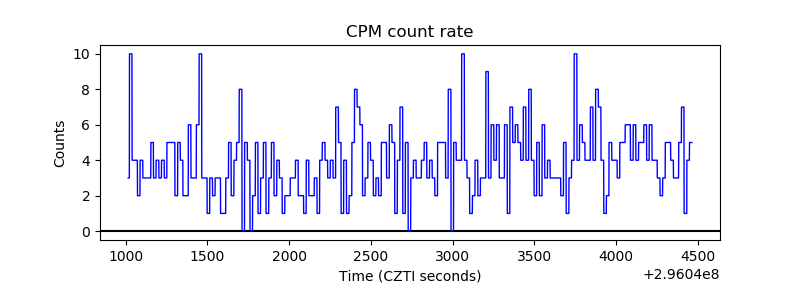 |
| CZT Counter |  |
| +2.5 Volts monitor |  |
| +5 Volts monitor |  |
| _ROLL_ROT | 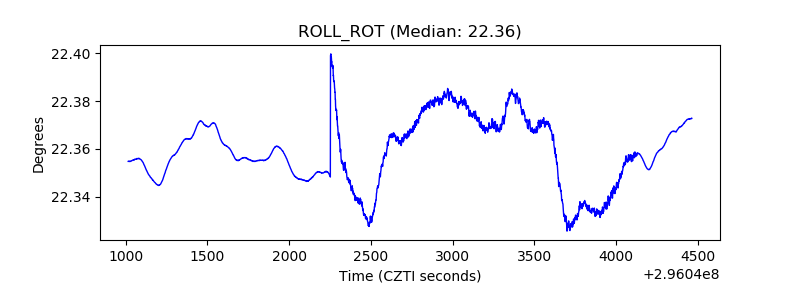 |
| _Roll_DEC | 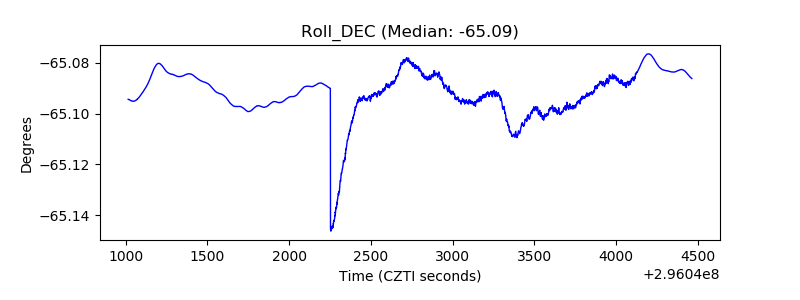 |
| _Roll_RA | 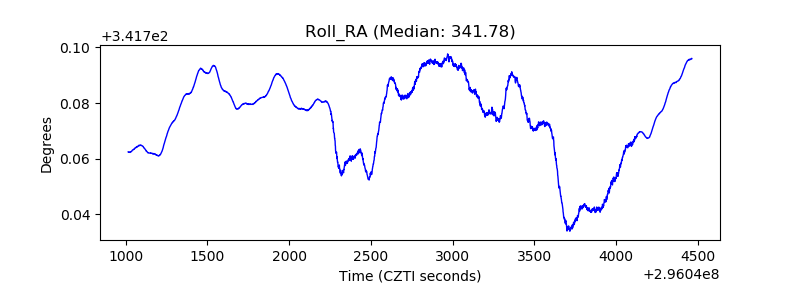 |
| Veto Counter | 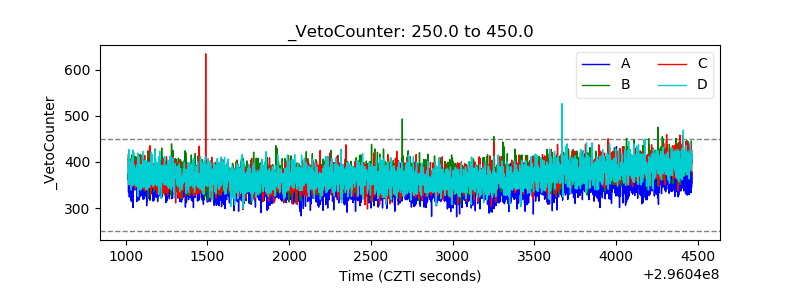 |