| Param | Original file | Final file |
|---|---|---|
| Filename | modeM0/AS1A05_176T04_9000002942cztM0_level2.fits | modeM0/AS1A05_176T04_9000002942cztM0_level2_quad_clean.evt |
| Size (bytes) | 86,785,920 | 75,513,600 |
| Size | 82.8 MB | 72.0 MB |
| Events in quadrant A | 523,248 | 430,020 |
| Events in quadrant B | 502,560 | 427,186 |
| Events in quadrant C | 512,338 | 413,913 |
| Events in quadrant D | 440,478 | 365,232 |
| Mode M9 | |||
|---|---|---|---|
| Quadrant | BADHDUFLAG | Total packets | Discarded packets |
| A | 0 | 16 | 0 |
| B | 0 | 16 | 0 |
| C | 0 | 16 | 0 |
| D | 0 | 16 | 0 |
| Mode M0 | |||
|---|---|---|---|
| Quadrant | BADHDUFLAG | Total packets | Discarded packets |
| A | 0 | 19236 | 0 |
| B | 0 | 19732 | 0 |
| C | 0 | 19759 | 0 |
| D | 0 | 23529 | 0 |
| Mode SS | |||
|---|---|---|---|
| Quadrant | BADHDUFLAG | Total packets | Discarded packets |
| A | 0 | 192 | 0 |
| B | 0 | 192 | 0 |
| C | 0 | 192 | 0 |
| D | 0 | 192 | 0 |
| Quadrant | Total seconds | Saturated seconds | Saturation percentage |
|---|---|---|---|
| A | 9366 | 48 | 0.512492% |
| B | 9366 | 82 | 0.875507% |
| C | 9366 | 115 | 1.227845% |
| D | 9366 | 480 | 5.124920% |
Noise dominated data is calculated using 1-second bins in cleaned event files. If a bin has >2000 counts, and if more than 50% of those come from <1% of pixels, then it is considered to be noise-dominated and hence unusable.
| Quadrant | # 1 sec bins | Bins with >0 counts | Bins with >2000 counts | High rate bins dominated by noise | Noise dominated (total time) | Noise dominated (detector-on time) | Marked lightcurve |
|---|---|---|---|---|---|---|---|
| A | 10996 | 9365 | 0 | 0 | 0.00% | 0.00% |  |
| B | 10996 | 9365 | 0 | 0 | 0.00% | 0.00% |  |
| C | 10996 | 9365 | 0 | 0 | 0.00% | 0.00% |  |
| D | 10996 | 9346 | 0 | 0 | 0.00% | 0.00% |  |
Top three noisy pixels from each quadrant. If the there are fewer than three noisy pixels in the level2.evt file, extra rows are filled as -1
| Pixel properties | Quadrant properties | ||||||
|---|---|---|---|---|---|---|---|
| Quadrant | DetID | PixID | Counts | Sigma | Mean | Median | Sigma |
| A | 0 | 29 | 530 | 11.15 | 136 | 128 | 36.0 |
| A | 0 | 30 | 435 | 8.52 | 136 | 128 | 36.0 |
| A | 15 | 236 | 418 | 8.05 | 136 | 128 | 36.0 |
| B | 2 | 9 | 443 | 11.16 | 132 | 126 | 28.4 |
| B | 2 | 8 | 360 | 8.24 | 132 | 126 | 28.4 |
| B | 3 | 17 | 349 | 7.85 | 132 | 126 | 28.4 |
| C | 1 | 81 | 406 | 7.77 | 135 | 126 | 36.1 |
| C | 1 | 80 | 385 | 7.18 | 135 | 126 | 36.1 |
| C | 3 | 235 | 368 | 6.71 | 135 | 126 | 36.1 |
| D | 15 | 46 | 328 | 6.01 | 125 | 114 | 35.6 |
| D | 6 | 38 | 321 | 5.82 | 125 | 114 | 35.6 |
| D | 3 | 31 | 316 | 5.68 | 125 | 114 | 35.6 |
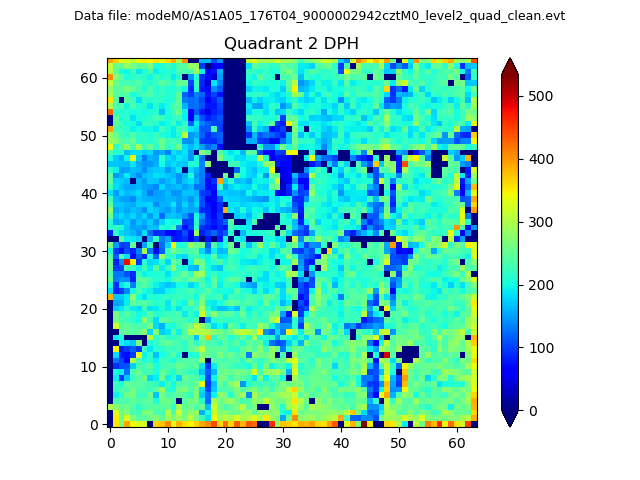
Histogram calculated using DETX and DETY for each event in the final _common_clean file
| Quadrant A |  |
 |
Quadrant B |
|---|---|---|---|
| Quadrant D | 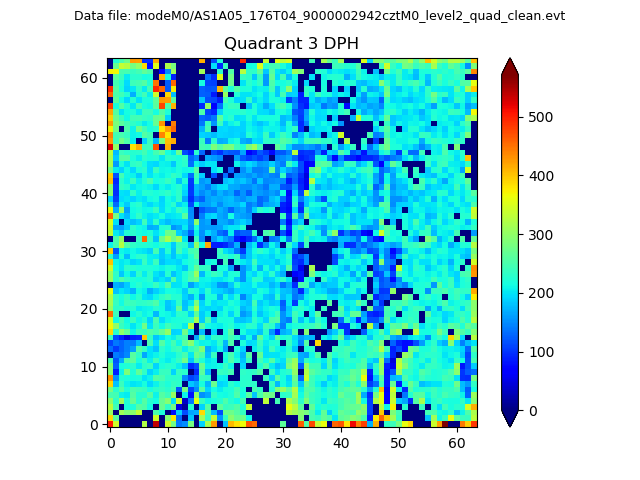 |
 |
Quadrant C |
| Plot type | Count rate plots | Images |
|---|---|---|
| Comparison with Poisson distribution Blue bars denote a histogram of data divided into 1 sec bins. Red curve is a Poisson curve with rate = median count rate of data. |
 |
 |
| Quadrant-wise count rates Data is divided into 100 sec bins |
 |
|
| Module-wise count rates for Quadrant A Data is divided into 100 sec bins |
 |
 |
| Module-wise count rates for Quadrant B Data is divided into 100 sec bins |
 |
 |
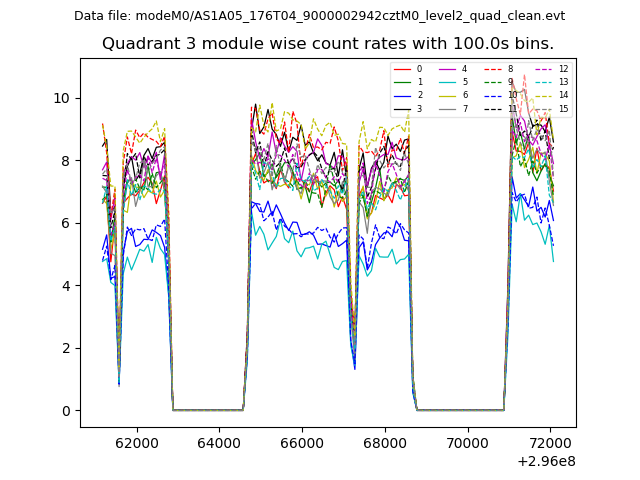
| Module-wise count rates for Quadrant C Data is divided into 100 sec bins |
 |
 |
| Module-wise count rates for Quadrant D Data is divided into 100 sec bins |
 |
 |
| Parameter | Plot |
|---|---|
| CZT HV Monitor |  |
| D_VDD | 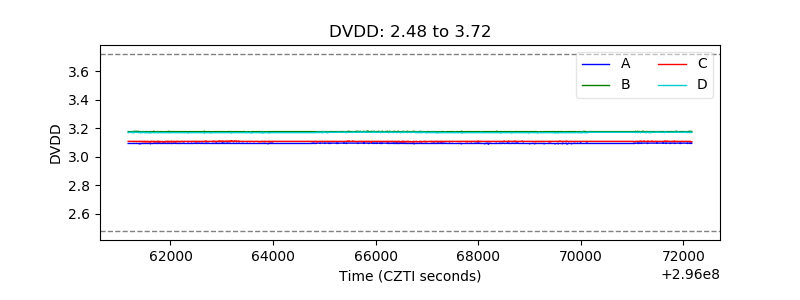 |
| Temperature 1 | 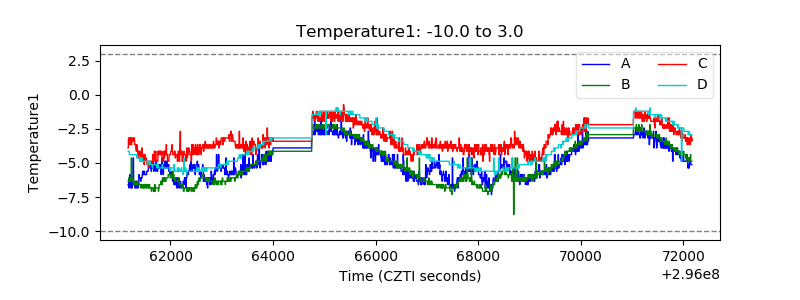 |
| Veto HV Monitor |  |
| Veto LLD |  |
| Alpha Counter | 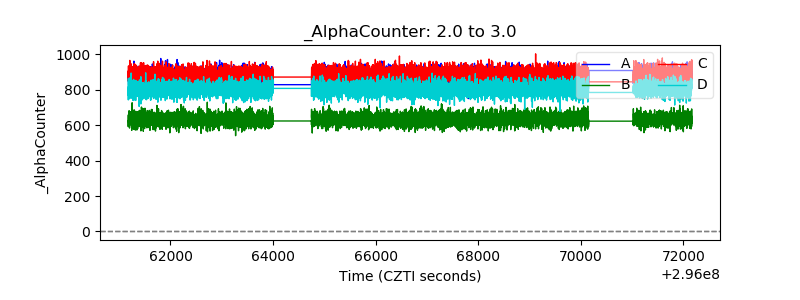 |
| _CPM_Rate |  |
| CZT Counter |  |
| +2.5 Volts monitor |  |
| +5 Volts monitor |  |
| _ROLL_ROT |  |
| _Roll_DEC | 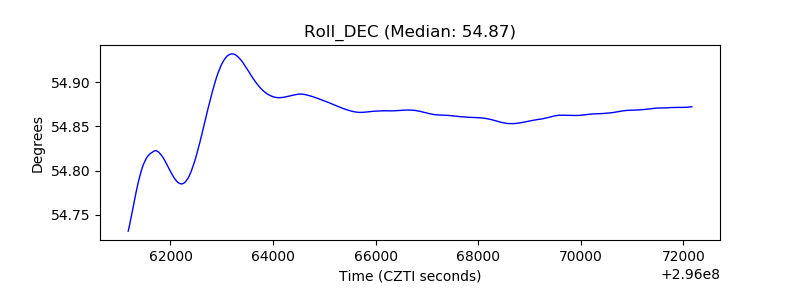 |
| _Roll_RA | 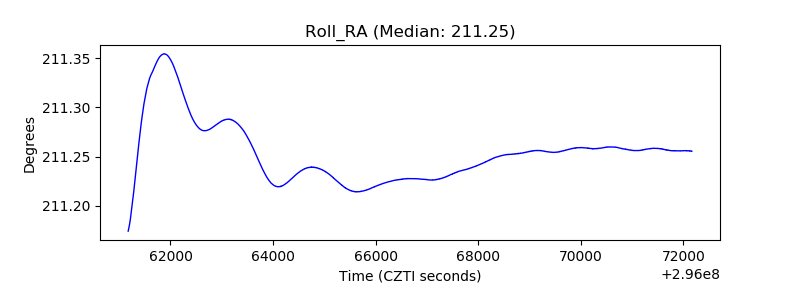 |
| Veto Counter | 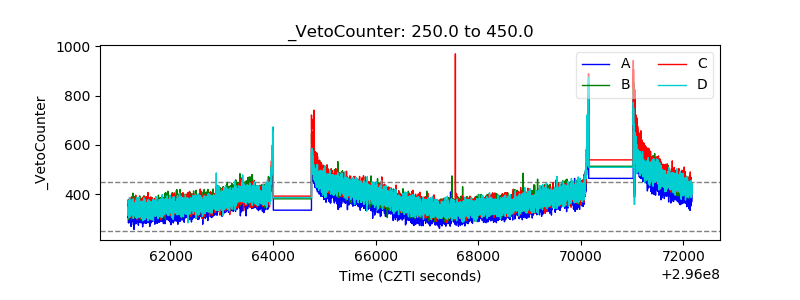 |