| Param | Original file | Final file |
|---|---|---|
| Filename | modeM0/AS1A05_176T04_9000002942_19695cztM0_level2.evt | modeM0/AS1A05_176T04_9000002942_19695cztM0_level2_quad_clean.evt |
| Size (bytes) | 451,581,120 | 97,560,000 |
| Size | 430.7 MB | 93.0 MB |
| Events in quadrant A | 3,050,704 | 637,414 |
| Events in quadrant B | 3,202,625 | 643,012 |
| Events in quadrant C | 3,231,636 | 622,200 |
| Events in quadrant D | 3,747,289 | 596,491 |
| Mode M9 | |||
|---|---|---|---|
| Quadrant | BADHDUFLAG | Total packets | Discarded packets |
| A | 0 | 10 | 0 |
| B | 0 | 11 | 0 |
| C | 0 | 11 | 0 |
| D | 0 | 11 | 0 |
| Mode M0 | |||
|---|---|---|---|
| Quadrant | BADHDUFLAG | Total packets | Discarded packets |
| A | 0 | 13524 | 2 |
| B | 0 | 13902 | 2 |
| C | 0 | 14030 | 2 |
| D | 0 | 15727 | 2 |
| Mode SS | |||
|---|---|---|---|
| Quadrant | BADHDUFLAG | Total packets | Discarded packets |
| A | 0 | 132 | 0 |
| B | 0 | 132 | 0 |
| C | 0 | 132 | 0 |
| D | 0 | 132 | 0 |
| Quadrant | Total seconds | Saturated seconds | Saturation percentage |
|---|---|---|---|
| A | 6533 | 37 | 0.566355% |
| B | 6533 | 64 | 0.979642% |
| C | 6533 | 86 | 1.316394% |
| D | 6533 | 270 | 4.132864% |
Noise dominated data is calculated using 1-second bins in cleaned event files. If a bin has >2000 counts, and if more than 50% of those come from <1% of pixels, then it is considered to be noise-dominated and hence unusable.
| Quadrant | # 1 sec bins | Bins with >0 counts | Bins with >2000 counts | High rate bins dominated by noise | Noise dominated (total time) | Noise dominated (detector-on time) | Marked lightcurve |
|---|---|---|---|---|---|---|---|
| A | 7418 | 6534 | 2 | 2 | 0.03% | 0.03% | 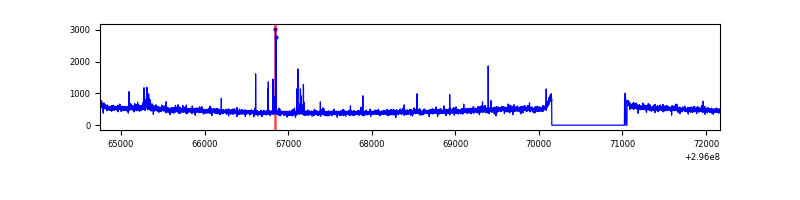 |
| B | 7418 | 6534 | 12 | 12 | 0.16% | 0.18% | 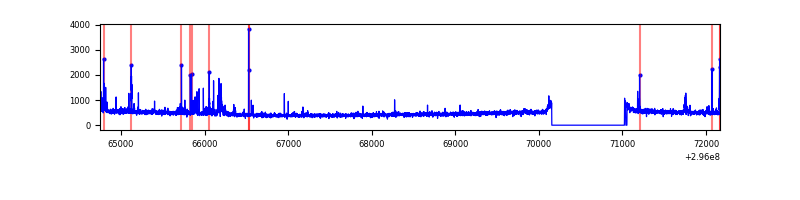 |
| C | 7418 | 6534 | 0 | 0 | 0.00% | 0.00% | 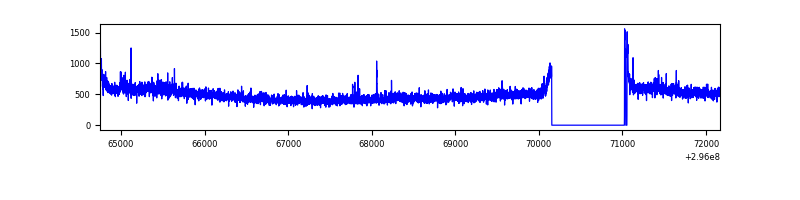 |
| D | 7418 | 6534 | 235 | 235 | 3.17% | 3.60% | 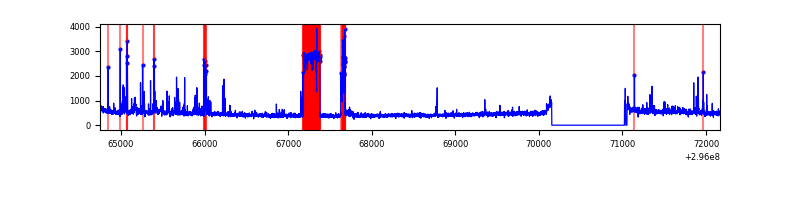 |
Top three noisy pixels from each quadrant. If the there are fewer than three noisy pixels in the level2.evt file, extra rows are filled as -1
| Pixel properties | Quadrant properties | ||||||
|---|---|---|---|---|---|---|---|
| Quadrant | DetID | PixID | Counts | Sigma | Mean | Median | Sigma |
| A | 5 | 16 | 42696 | 268.41 | 776 | 759 | 156.2 |
| A | 11 | 47 | 24885 | 154.41 | 776 | 759 | 156.2 |
| A | 0 | 226 | 6859 | 39.04 | 776 | 759 | 156.2 |
| B | 7 | 220 | 63909 | 426.76 | 771 | 749 | 148.0 |
| B | 0 | 197 | 33314 | 220.04 | 771 | 749 | 148.0 |
| B | 0 | 190 | 25003 | 163.88 | 771 | 749 | 148.0 |
| C | 3 | 233 | 154825 | 874.54 | 749 | 754 | 176.2 |
| C | 14 | 238 | 115163 | 649.41 | 749 | 754 | 176.2 |
| C | 8 | 208 | 24292 | 133.61 | 749 | 754 | 176.2 |
| D | 7 | 238 | 742621 | 4081.78 | 748 | 726 | 181.8 |
| D | 1 | 52 | 86040 | 469.38 | 748 | 726 | 181.8 |
| D | 2 | 16 | 60345 | 328.01 | 748 | 726 | 181.8 |
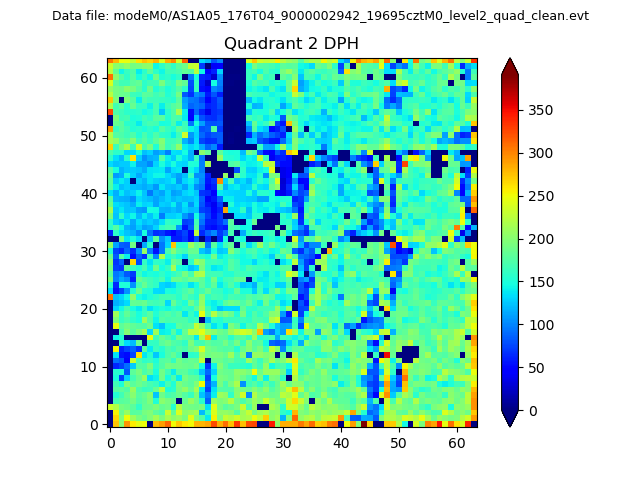
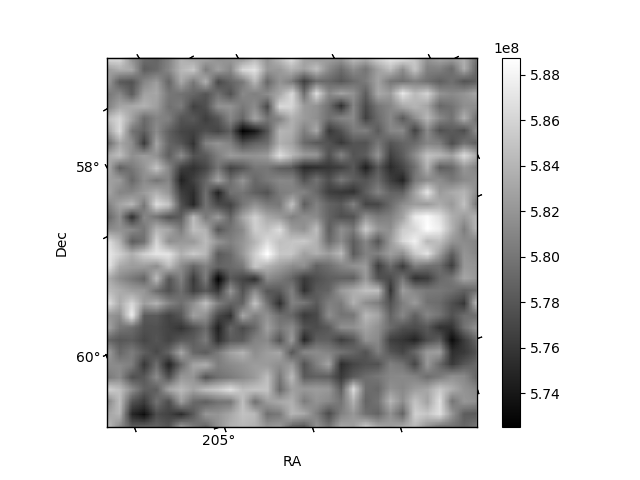
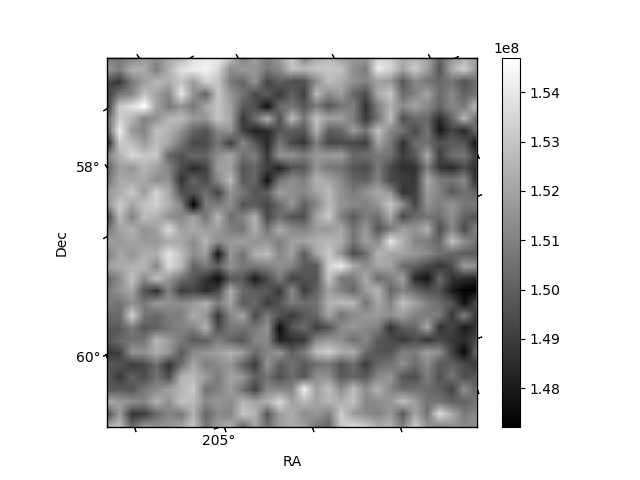
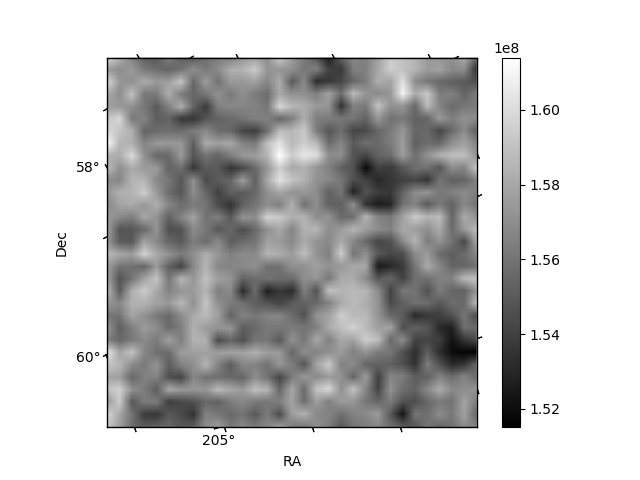
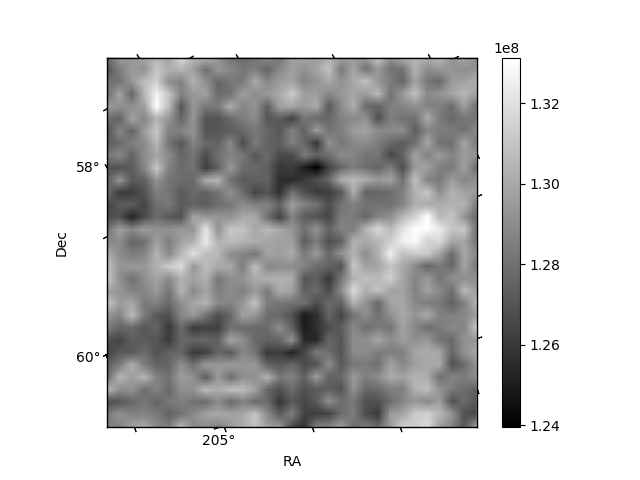
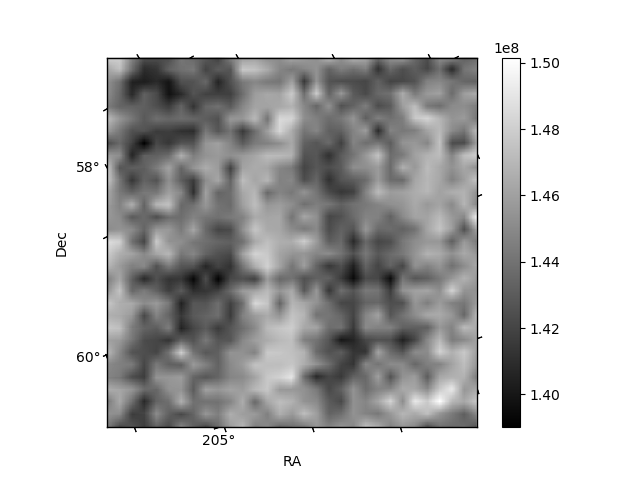
Histogram calculated using DETX and DETY for each event in the final _common_clean file
| Quadrant A | 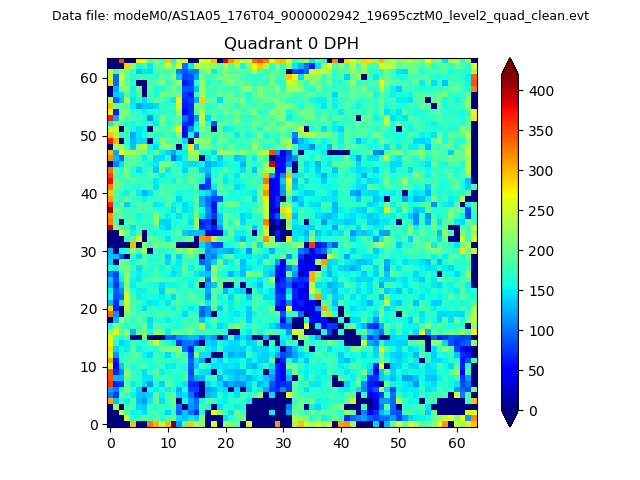 |
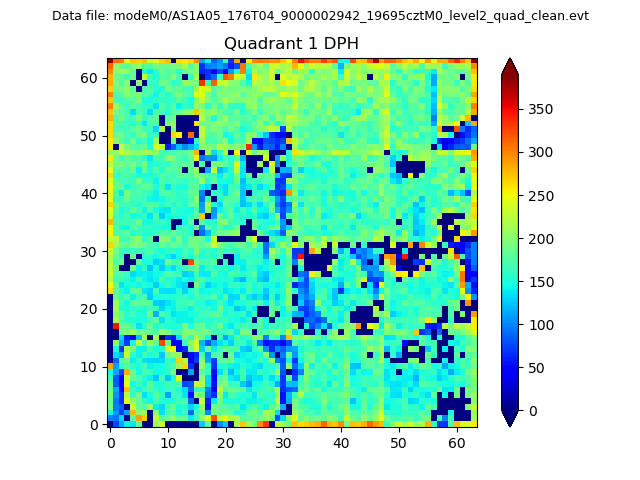 |
Quadrant B |
|---|---|---|---|
| Quadrant D | 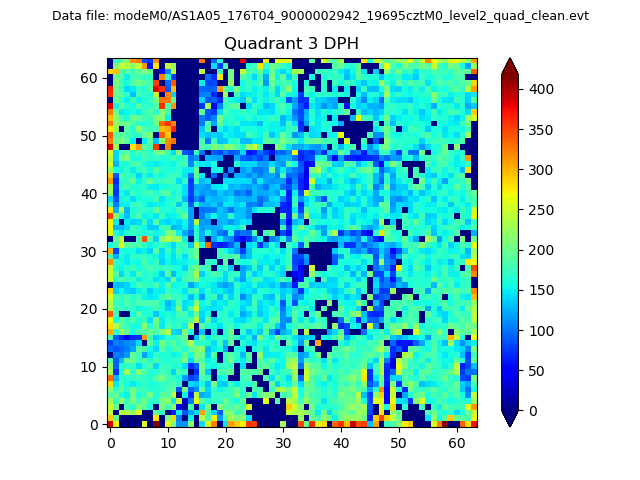 |
 |
Quadrant C |
| Plot type | Count rate plots | Images |
|---|---|---|
| Comparison with Poisson distribution Blue bars denote a histogram of data divided into 1 sec bins. Red curve is a Poisson curve with rate = median count rate of data. |
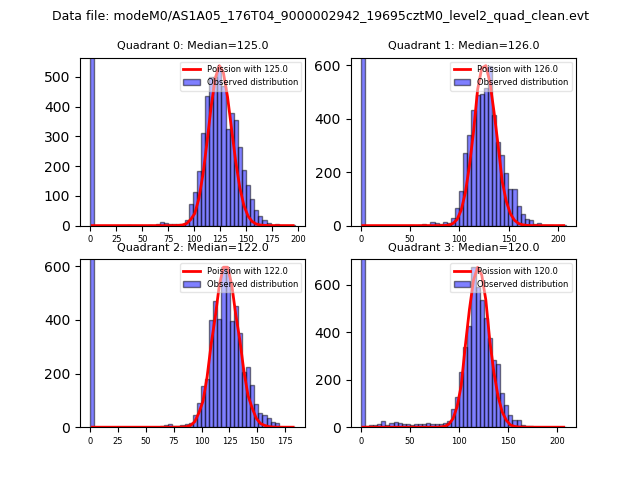 |
 |
| Quadrant-wise count rates Data is divided into 100 sec bins |
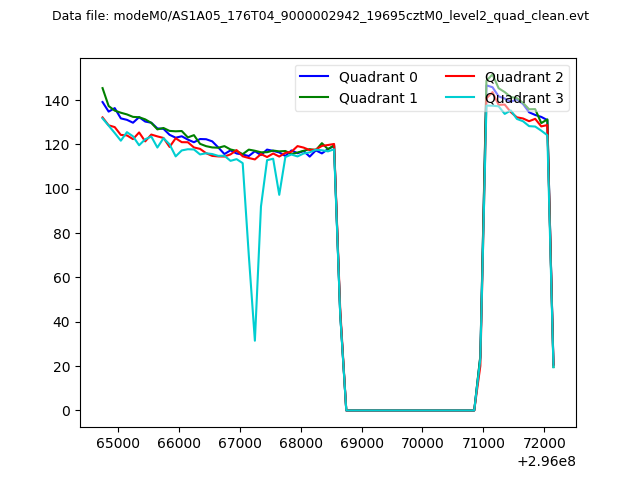 |
|
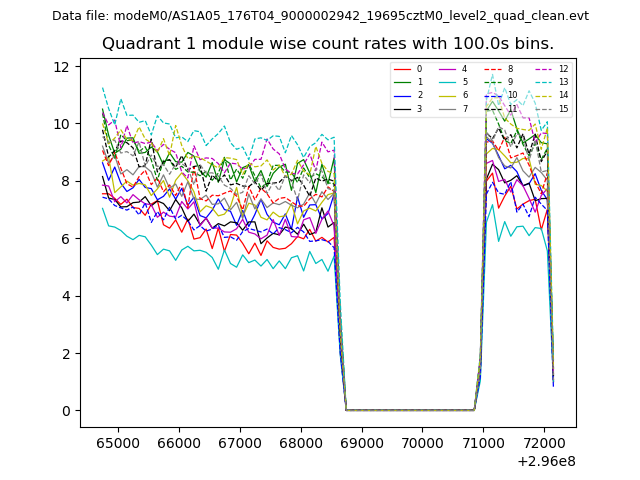
| Module-wise count rates for Quadrant A Data is divided into 100 sec bins |
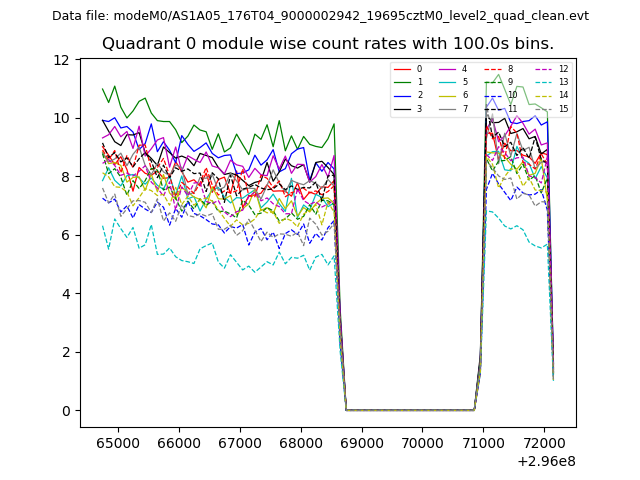 |
 |
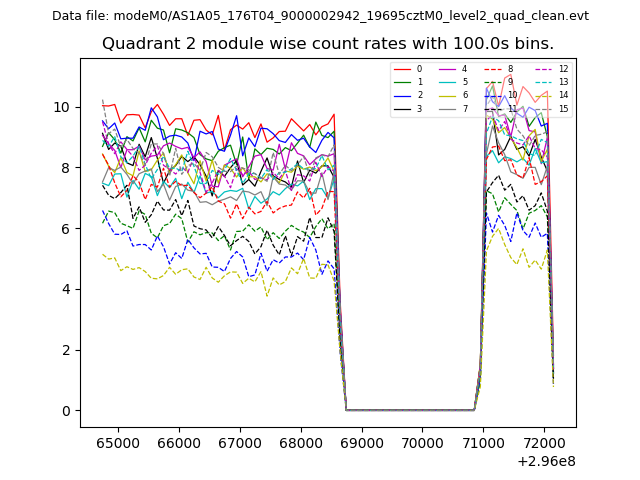
| Module-wise count rates for Quadrant B Data is divided into 100 sec bins |
 |
 |
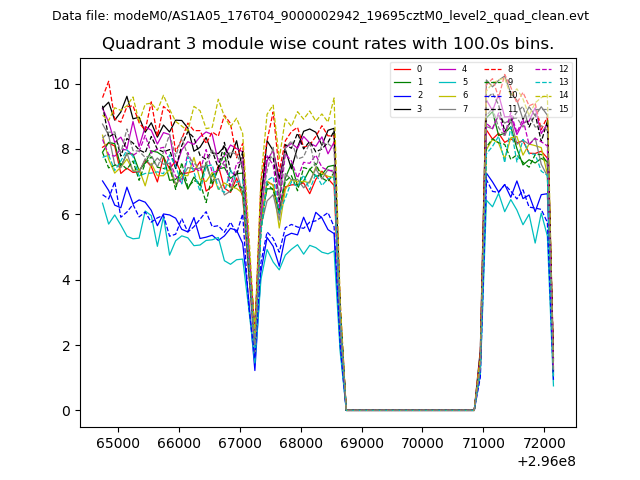
| Module-wise count rates for Quadrant C Data is divided into 100 sec bins |
 |
 |
| Module-wise count rates for Quadrant D Data is divided into 100 sec bins |
 |
 |
| Parameter | Plot |
|---|---|
| CZT HV Monitor | 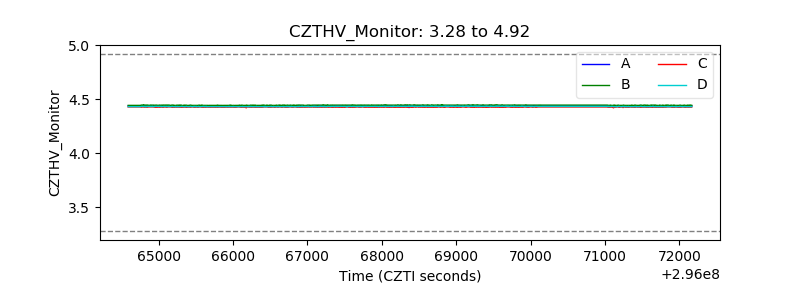 |
| D_VDD | 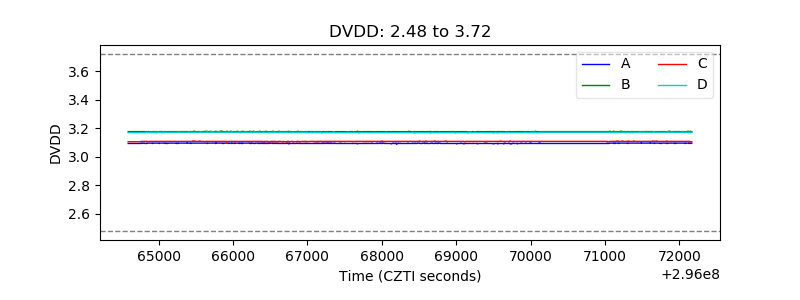 |
| Temperature 1 | 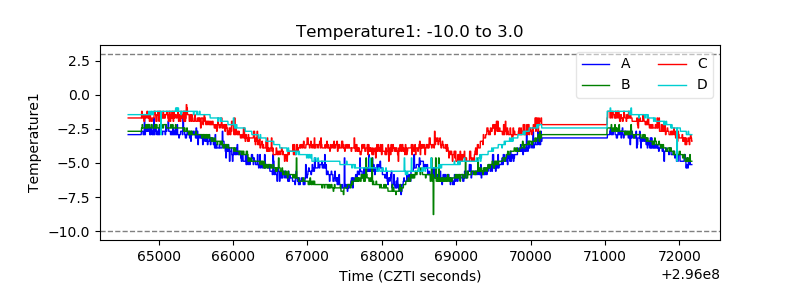 |
| Veto HV Monitor | 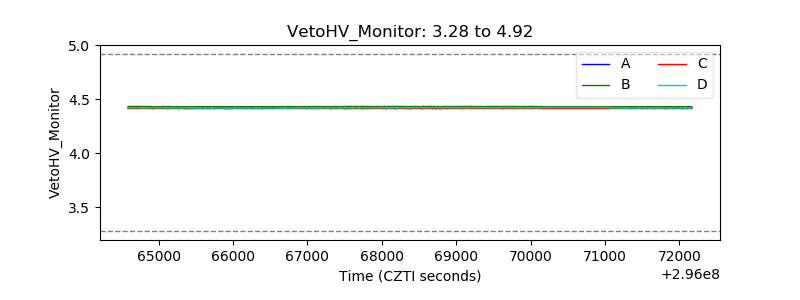 |
| Veto LLD | 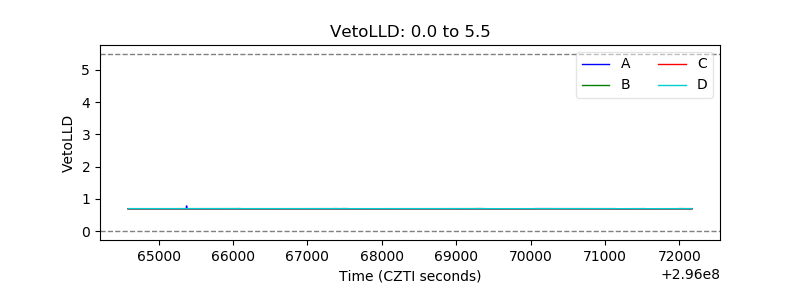 |
| Alpha Counter | 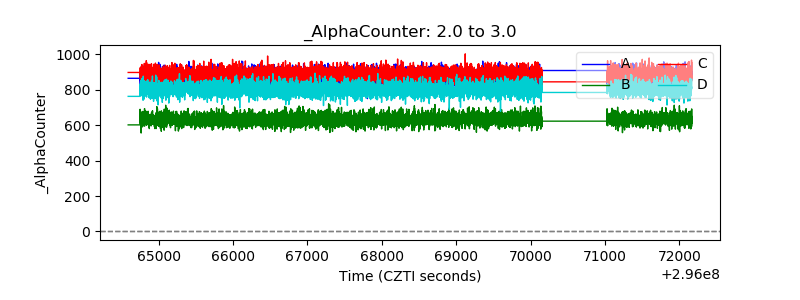 |
| _CPM_Rate | 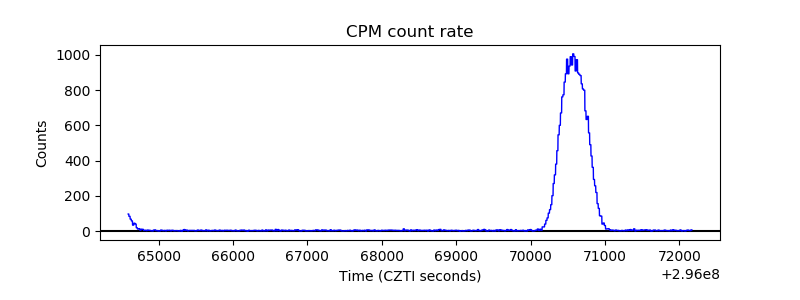 |
| CZT Counter | 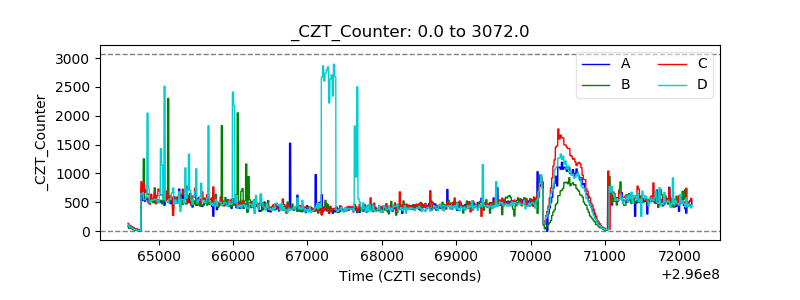 |
| +2.5 Volts monitor |  |
| +5 Volts monitor |  |
| _ROLL_ROT | 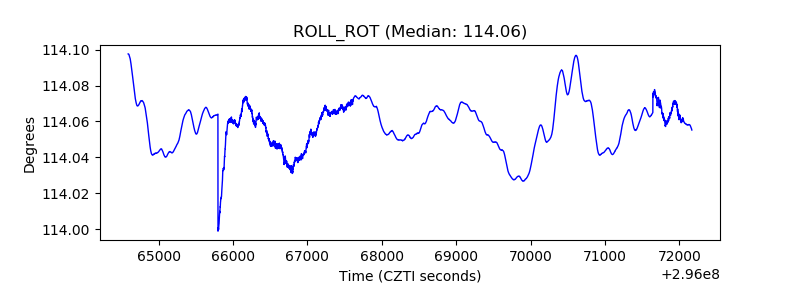 |
| _Roll_DEC |  |
| _Roll_RA | 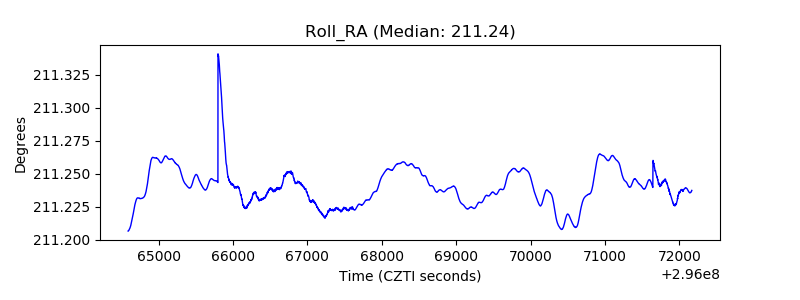 |
| Veto Counter |  |