| Param | Original file | Final file |
|---|---|---|
| Filename | modeM0/AS1C04_001T01_9000002948cztM0_level2.fits | modeM0/AS1C04_001T01_9000002948cztM0_level2_quad_clean.evt |
| Size (bytes) | 847,431,360 | 1,081,918,080 |
| Size | 808.2 MB | 1.0 GB |
| Events in quadrant A | 5,130,848 | 6,913,390 |
| Events in quadrant B | 5,002,234 | 7,036,051 |
| Events in quadrant C | 5,071,064 | 6,661,404 |
| Events in quadrant D | 4,296,084 | 5,997,452 |
| Mode M9 | |||
|---|---|---|---|
| Quadrant | BADHDUFLAG | Total packets | Discarded packets |
| A | 0 | 154 | 0 |
| B | 0 | 154 | 0 |
| C | 0 | 154 | 0 |
| D | 0 | 154 | 0 |
| Mode SS | |||
|---|---|---|---|
| Quadrant | BADHDUFLAG | Total packets | Discarded packets |
| A | 0 | 1828 | 0 |
| B | 0 | 1828 | 0 |
| C | 0 | 1828 | 0 |
| D | 0 | 1828 | 0 |
| Mode M0 | |||
|---|---|---|---|
| Quadrant | BADHDUFLAG | Total packets | Discarded packets |
| A | 0 | 190604 | 0 |
| B | 0 | 193028 | 0 |
| C | 0 | 215338 | 0 |
| D | 0 | 249108 | 0 |
| Quadrant | Total seconds | Saturated seconds | Saturation percentage |
|---|---|---|---|
| A | 89875 | 1595 | 1.774687% |
| B | 89876 | 1253 | 1.394143% |
| C | 89878 | 2960 | 3.293353% |
| D | 89879 | 5330 | 5.930195% |
Noise dominated data is calculated using 1-second bins in cleaned event files. If a bin has >2000 counts, and if more than 50% of those come from <1% of pixels, then it is considered to be noise-dominated and hence unusable.
| Quadrant | # 1 sec bins | Bins with >0 counts | Bins with >2000 counts | High rate bins dominated by noise | Noise dominated (total time) | Noise dominated (detector-on time) | Marked lightcurve |
|---|---|---|---|---|---|---|---|
| A | 107126 | 89888 | 0 | 0 | 0.00% | 0.00% |  |
| B | 107126 | 89886 | 0 | 0 | 0.00% | 0.00% |  |
| C | 107126 | 89890 | 0 | 0 | 0.00% | 0.00% |  |
| D | 107126 | 89819 | 0 | 0 | 0.00% | 0.00% |  |
Top three noisy pixels from each quadrant. If the there are fewer than three noisy pixels in the level2.evt file, extra rows are filled as -1
| Pixel properties | Quadrant properties | ||||||
|---|---|---|---|---|---|---|---|
| Quadrant | DetID | PixID | Counts | Sigma | Mean | Median | Sigma |
| A | 0 | 29 | 5062 | 11.76 | 1336 | 1259 | 323.4 |
| A | 7 | 110 | 4254 | 9.26 | 1336 | 1259 | 323.4 |
| A | 0 | 30 | 3979 | 8.41 | 1336 | 1259 | 323.4 |
| B | 2 | 9 | 4122 | 11.11 | 1325 | 1266 | 257.0 |
| B | 2 | 8 | 3498 | 8.69 | 1325 | 1266 | 257.0 |
| B | 5 | 128 | 3384 | 8.24 | 1325 | 1266 | 257.0 |
| C | 1 | 80 | 3910 | 7.79 | 1338 | 1252 | 341.3 |
| C | 1 | 81 | 3894 | 7.74 | 1338 | 1252 | 341.3 |
| C | 12 | 241 | 3582 | 6.83 | 1338 | 1252 | 341.3 |
| D | 15 | 46 | 3157 | 6.3 | 1227 | 1119 | 323.3 |
| D | 3 | 14 | 3142 | 6.26 | 1227 | 1119 | 323.3 |
| D | 6 | 67 | 3055 | 5.99 | 1227 | 1119 | 323.3 |
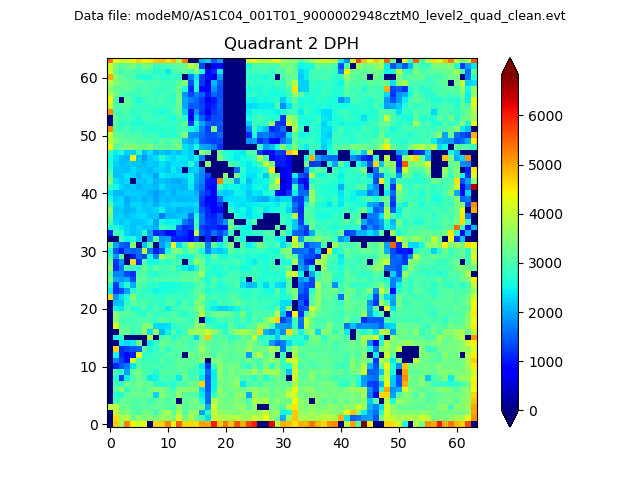
Histogram calculated using DETX and DETY for each event in the final _common_clean file
| Quadrant A |  |
 |
Quadrant B |
|---|---|---|---|
| Quadrant D |  |
 |
Quadrant C |
| Plot type | Count rate plots | Images |
|---|---|---|
| Comparison with Poisson distribution Blue bars denote a histogram of data divided into 1 sec bins. Red curve is a Poisson curve with rate = median count rate of data. |
 |
 |
| Quadrant-wise count rates Data is divided into 100 sec bins |
 |
|
| Module-wise count rates for Quadrant A Data is divided into 100 sec bins |
 |
 |
| Module-wise count rates for Quadrant B Data is divided into 100 sec bins |
 |
 |
| Module-wise count rates for Quadrant C Data is divided into 100 sec bins |
 |
 |
| Module-wise count rates for Quadrant D Data is divided into 100 sec bins |
 |
 |
| Parameter | Plot |
|---|---|
| CZT HV Monitor |  |
| D_VDD |  |
| Temperature 1 |  |
| Veto HV Monitor |  |
| Veto LLD |  |
| Alpha Counter |  |
| _CPM_Rate |  |
| CZT Counter |  |
| +2.5 Volts monitor |  |
| +5 Volts monitor |  |
| _ROLL_ROT |  |
| _Roll_DEC |  |
| _Roll_RA |  |
| Veto Counter |  |