| Param | Original file | Final file |
|---|---|---|
| Filename | modeM0/AS1C04_001T01_9000002948_19737cztM0_level2.evt | modeM0/AS1C04_001T01_9000002948_19737cztM0_level2_quad_clean.evt |
| Size (bytes) | 551,462,400 | 128,007,360 |
| Size | 525.9 MB | 122.1 MB |
| Events in quadrant A | 3,234,961 | 870,462 |
| Events in quadrant B | 3,661,083 | 874,677 |
| Events in quadrant C | 3,441,616 | 847,807 |
| Events in quadrant D | 5,888,634 | 796,230 |
| Mode M9 | |||
|---|---|---|---|
| Quadrant | BADHDUFLAG | Total packets | Discarded packets |
| A | 0 | 9 | 0 |
| B | 0 | 9 | 0 |
| C | 0 | 9 | 0 |
| D | 0 | 9 | 0 |
| Mode SS | |||
|---|---|---|---|
| Quadrant | BADHDUFLAG | Total packets | Discarded packets |
| A | 0 | 142 | 0 |
| B | 0 | 142 | 0 |
| C | 0 | 142 | 0 |
| D | 0 | 142 | 0 |
| Mode M0 | |||
|---|---|---|---|
| Quadrant | BADHDUFLAG | Total packets | Discarded packets |
| A | 0 | 14264 | 2 |
| B | 0 | 15514 | 2 |
| C | 0 | 14819 | 2 |
| D | 0 | 22309 | 4 |
| Quadrant | Total seconds | Saturated seconds | Saturation percentage |
|---|---|---|---|
| A | 6999 | 43 | 0.614373% |
| B | 6999 | 141 | 2.014574% |
| C | 6999 | 89 | 1.271610% |
| D | 6998 | 665 | 9.502715% |
Noise dominated data is calculated using 1-second bins in cleaned event files. If a bin has >2000 counts, and if more than 50% of those come from <1% of pixels, then it is considered to be noise-dominated and hence unusable.
| Quadrant | # 1 sec bins | Bins with >0 counts | Bins with >2000 counts | High rate bins dominated by noise | Noise dominated (total time) | Noise dominated (detector-on time) | Marked lightcurve |
|---|---|---|---|---|---|---|---|
| A | 7814 | 7000 | 1 | 1 | 0.01% | 0.01% | 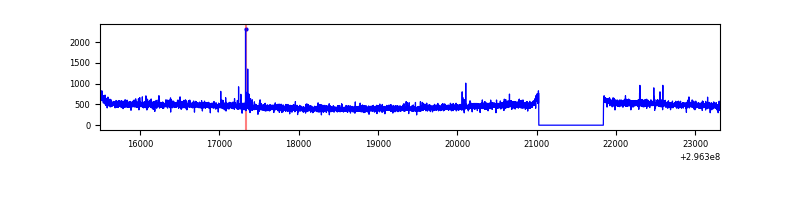 |
| B | 7814 | 6999 | 56 | 56 | 0.72% | 0.80% | 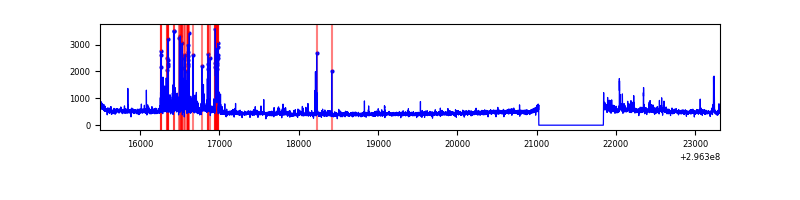 |
| C | 7814 | 6999 | 0 | 0 | 0.00% | 0.00% | 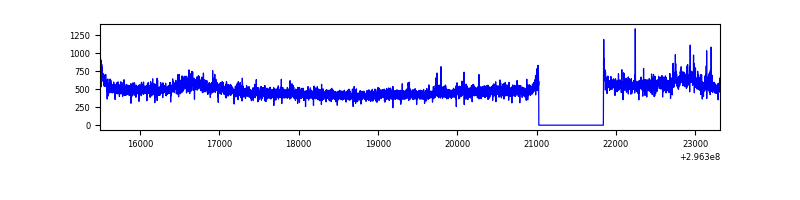 |
| D | 7813 | 6999 | 476 | 476 | 6.09% | 6.80% | 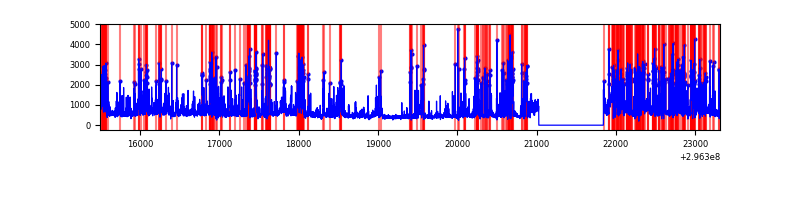 |
Top three noisy pixels from each quadrant. If the there are fewer than three noisy pixels in the level2.evt file, extra rows are filled as -1
| Pixel properties | Quadrant properties | ||||||
|---|---|---|---|---|---|---|---|
| Quadrant | DetID | PixID | Counts | Sigma | Mean | Median | Sigma |
| A | 8 | 205 | 18081 | 101.84 | 831 | 812 | 169.6 |
| A | 0 | 254 | 9309 | 50.11 | 831 | 812 | 169.6 |
| A | 13 | 254 | 7492 | 39.39 | 831 | 812 | 169.6 |
| B | 7 | 220 | 276615 | 1743.95 | 824 | 803 | 158.2 |
| B | 4 | 171 | 40345 | 250.02 | 824 | 803 | 158.2 |
| B | 4 | 216 | 39918 | 247.32 | 824 | 803 | 158.2 |
| C | 3 | 233 | 171272 | 917.12 | 799 | 802 | 185.9 |
| C | 14 | 238 | 123794 | 661.69 | 799 | 802 | 185.9 |
| C | 10 | 91 | 25740 | 134.17 | 799 | 802 | 185.9 |
| D | 1 | 52 | 2442088 | 12830.0 | 783 | 758 | 190.3 |
| D | 13 | 172 | 129090 | 674.43 | 783 | 758 | 190.3 |
| D | 12 | 0 | 121364 | 633.82 | 783 | 758 | 190.3 |
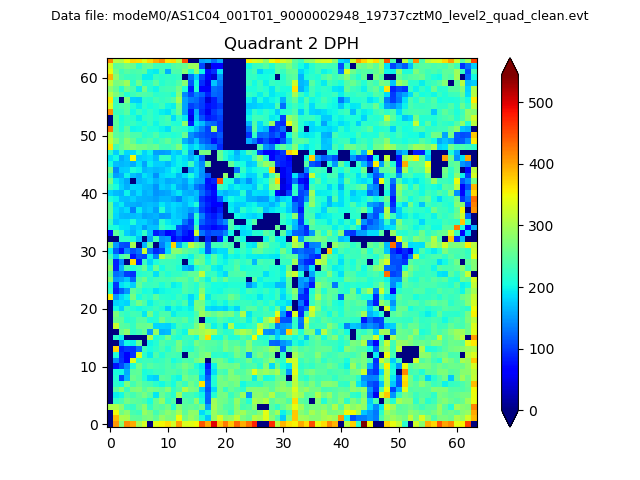
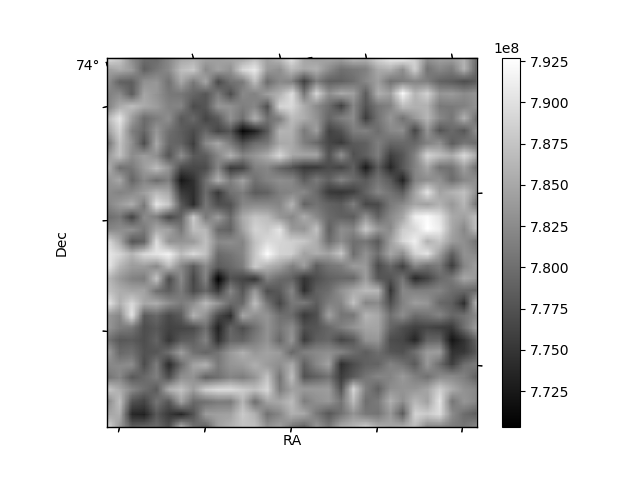
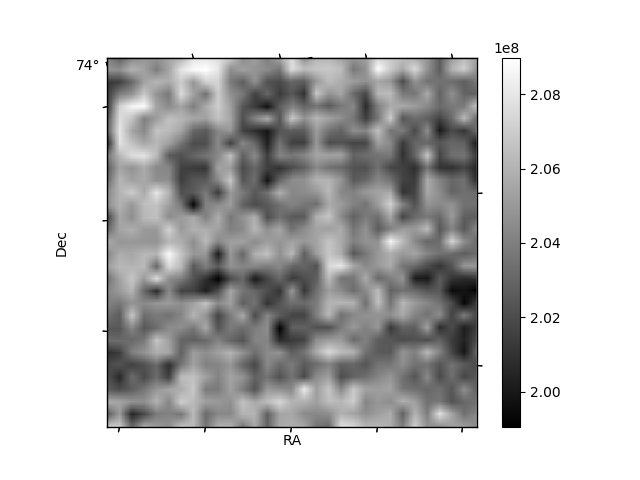
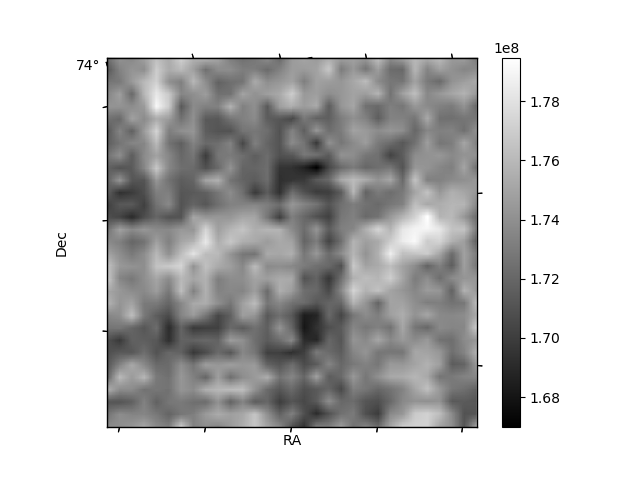
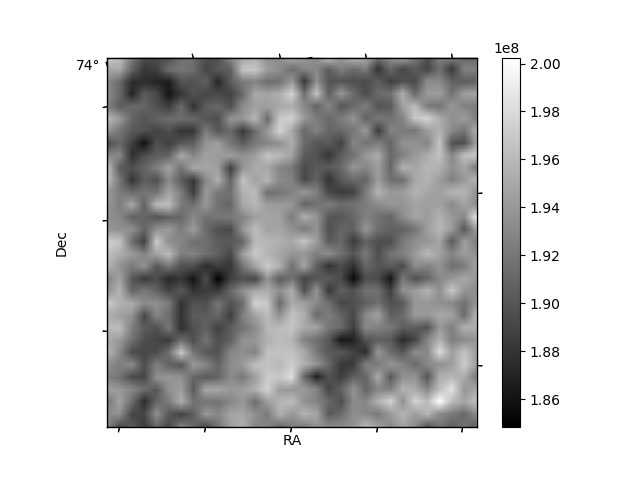
Histogram calculated using DETX and DETY for each event in the final _common_clean file
| Quadrant A | 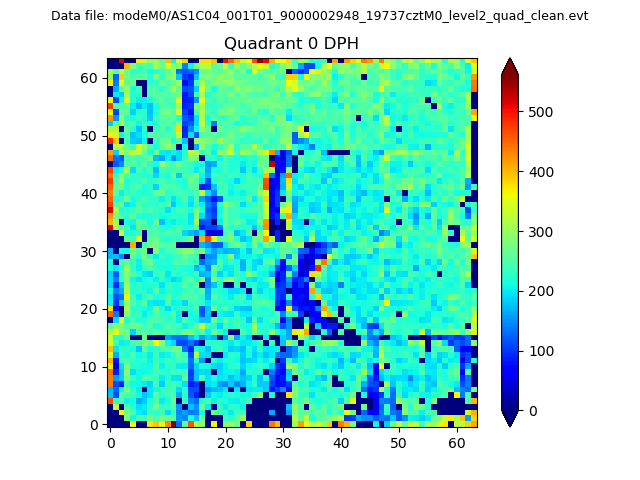 |
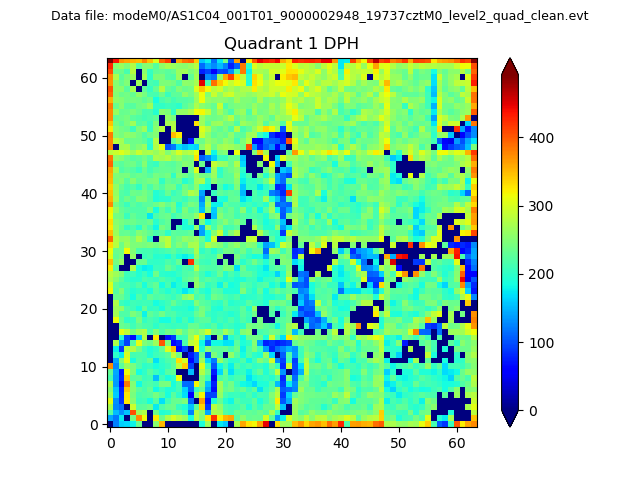 |
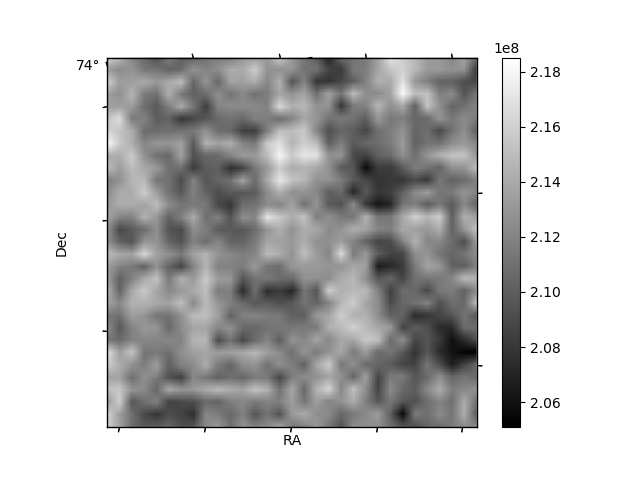
Quadrant B |
|---|---|---|---|
| Quadrant D | 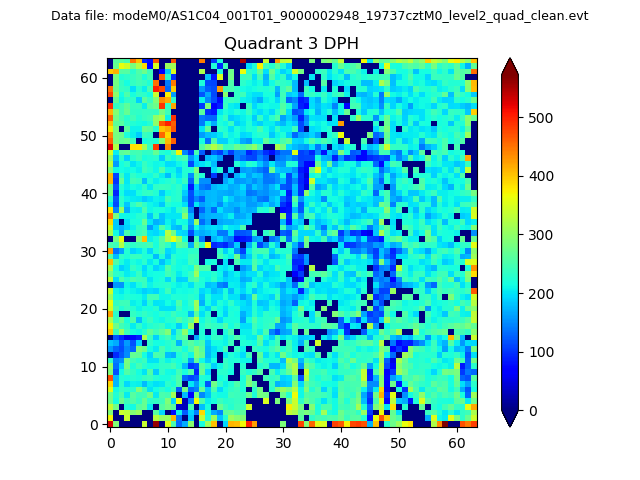 |
 |
Quadrant C |
| Plot type | Count rate plots | Images |
|---|---|---|
| Comparison with Poisson distribution Blue bars denote a histogram of data divided into 1 sec bins. Red curve is a Poisson curve with rate = median count rate of data. |
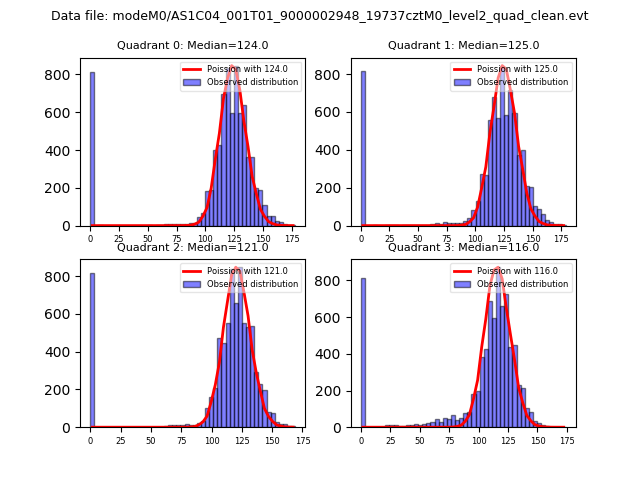 |
 |
| Quadrant-wise count rates Data is divided into 100 sec bins |
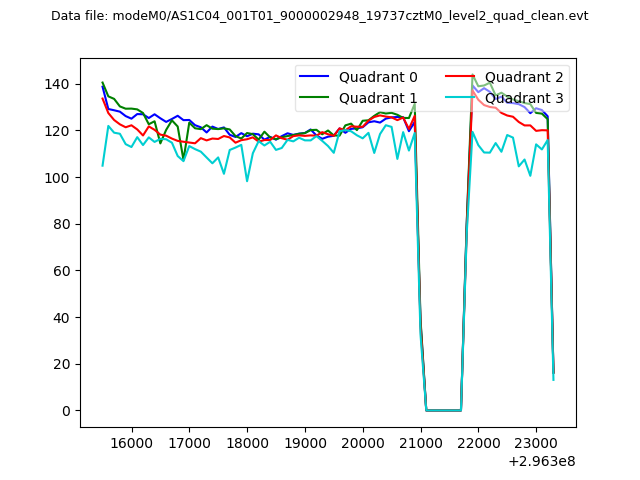 |
|
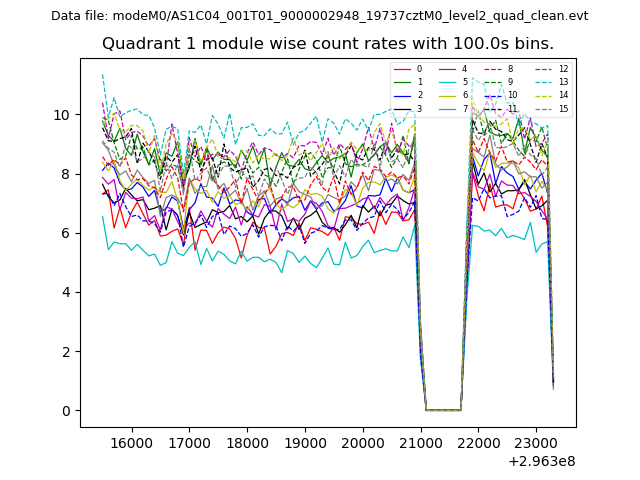
| Module-wise count rates for Quadrant A Data is divided into 100 sec bins |
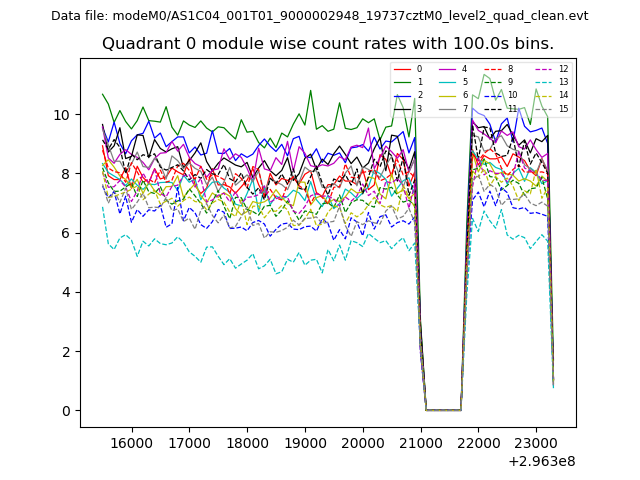 |
 |
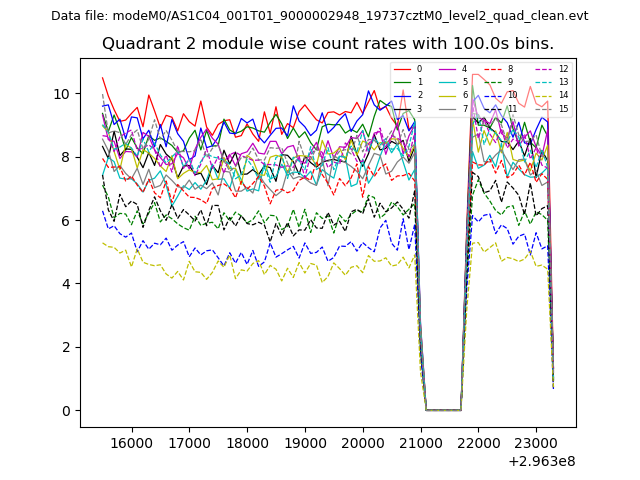
| Module-wise count rates for Quadrant B Data is divided into 100 sec bins |
 |
 |
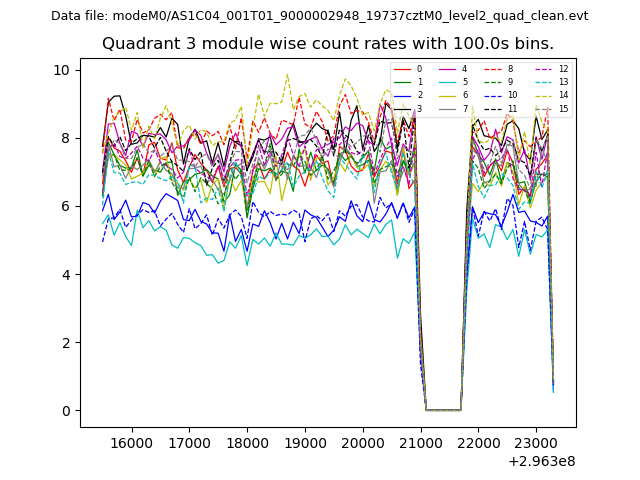
| Module-wise count rates for Quadrant C Data is divided into 100 sec bins |
 |
 |
| Module-wise count rates for Quadrant D Data is divided into 100 sec bins |
 |
 |
| Parameter | Plot |
|---|---|
| CZT HV Monitor | 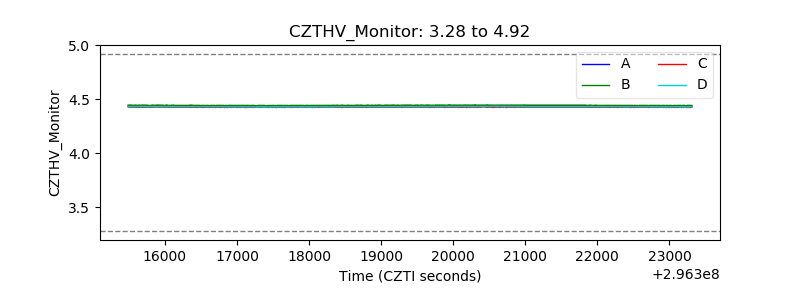 |
| D_VDD | 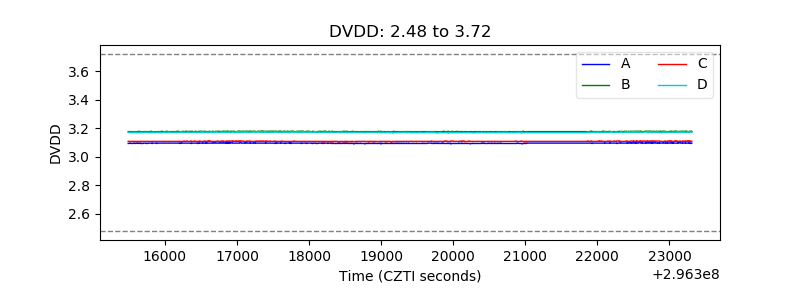 |
| Temperature 1 | 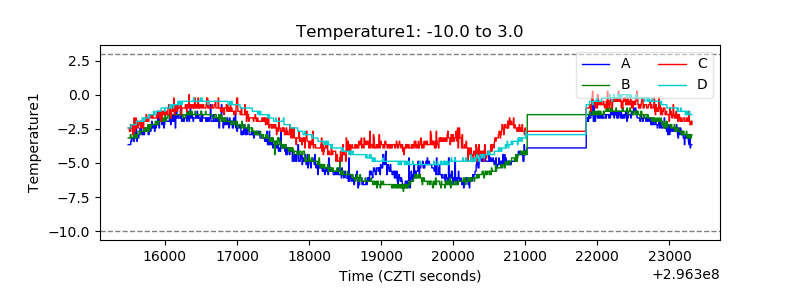 |
| Veto HV Monitor | 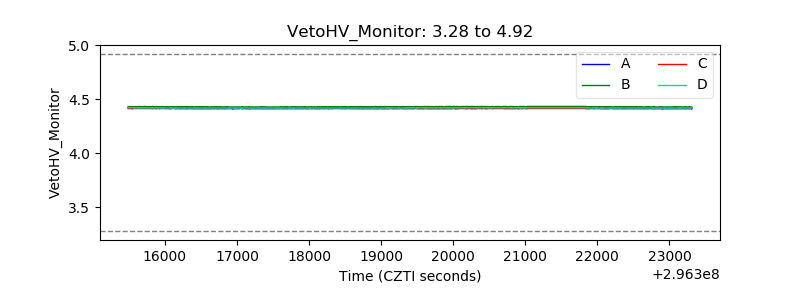 |
| Veto LLD | 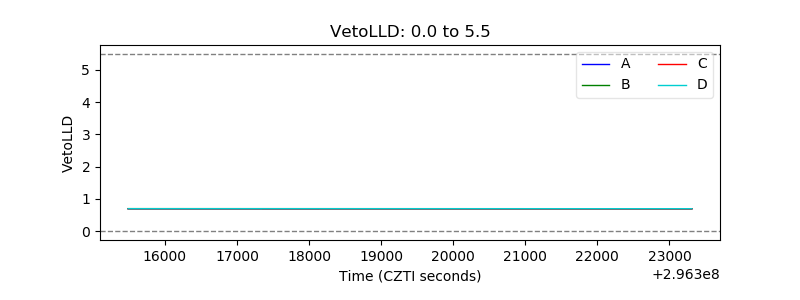 |
| Alpha Counter | 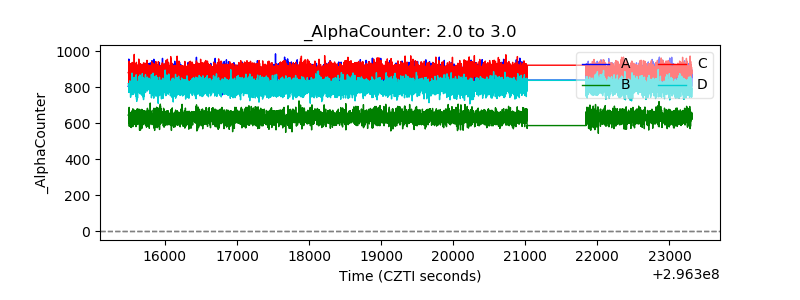 |
| _CPM_Rate | 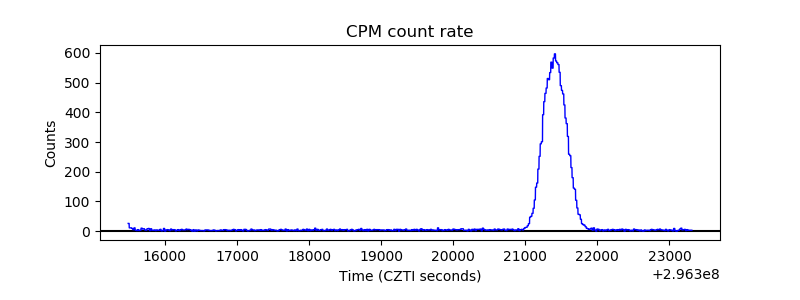 |
| CZT Counter | 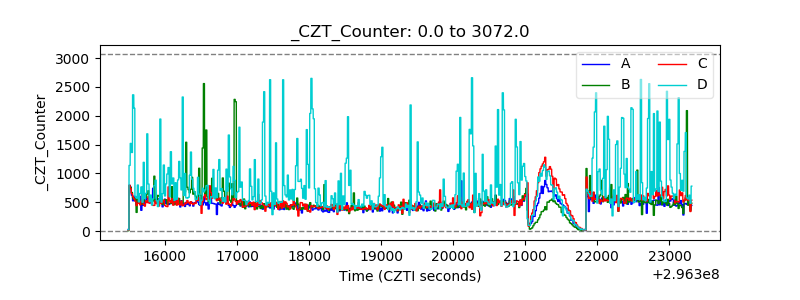 |
| +2.5 Volts monitor |  |
| +5 Volts monitor |  |
| _ROLL_ROT | 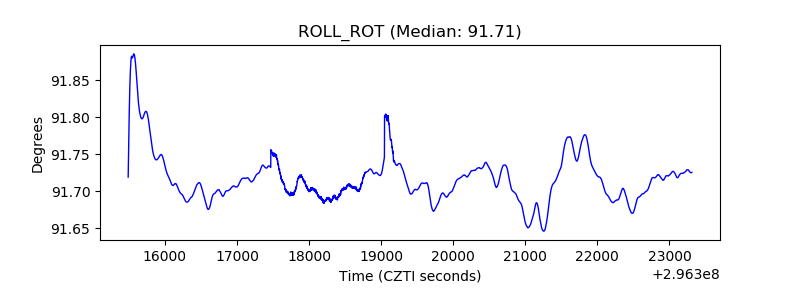 |
| _Roll_DEC | 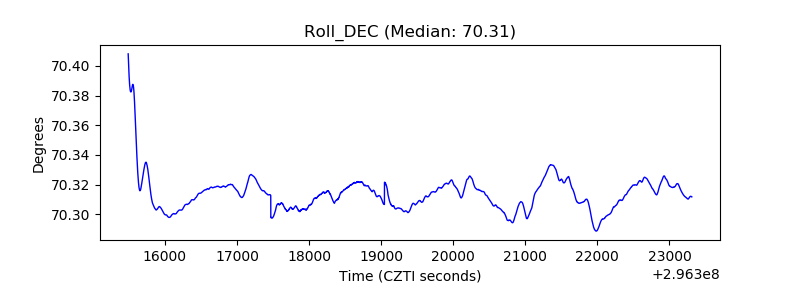 |
| _Roll_RA | 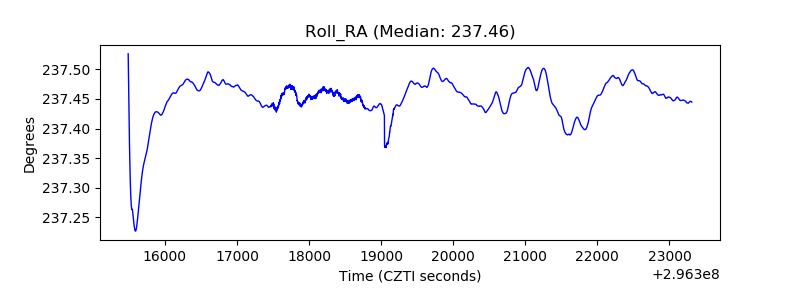 |
| Veto Counter | 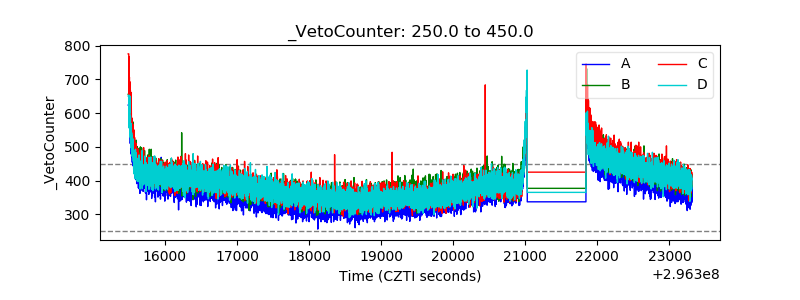 |