| Param | Original file | Final file |
|---|---|---|
| Filename | modeM0/AS1C04_001T01_9000002948_19740cztM0_level2.evt | modeM0/AS1C04_001T01_9000002948_19740cztM0_level2_quad_clean.evt |
| Size (bytes) | 479,568,960 | 114,589,440 |
| Size | 457.4 MB | 109.3 MB |
| Events in quadrant A | 2,915,383 | 770,791 |
| Events in quadrant B | 3,010,446 | 788,220 |
| Events in quadrant C | 2,994,680 | 771,053 |
| Events in quadrant D | 5,191,979 | 717,456 |
| Mode M9 | |||
|---|---|---|---|
| Quadrant | BADHDUFLAG | Total packets | Discarded packets |
| A | 0 | 12 | 0 |
| B | 0 | 12 | 0 |
| C | 0 | 12 | 0 |
| D | 0 | 12 | 0 |
| Mode SS | |||
|---|---|---|---|
| Quadrant | BADHDUFLAG | Total packets | Discarded packets |
| A | 0 | 122 | 0 |
| B | 0 | 122 | 0 |
| C | 0 | 122 | 0 |
| D | 0 | 122 | 0 |
| Mode M0 | |||
|---|---|---|---|
| Quadrant | BADHDUFLAG | Total packets | Discarded packets |
| A | 0 | 12799 | 1 |
| B | 0 | 13060 | 1 |
| C | 0 | 13069 | 1 |
| D | 0 | 19659 | 2 |
| Quadrant | Total seconds | Saturated seconds | Saturation percentage |
|---|---|---|---|
| A | 6061 | 34 | 0.560964% |
| B | 6062 | 35 | 0.577367% |
| C | 6062 | 59 | 0.973276% |
| D | 6061 | 491 | 8.100973% |
Noise dominated data is calculated using 1-second bins in cleaned event files. If a bin has >2000 counts, and if more than 50% of those come from <1% of pixels, then it is considered to be noise-dominated and hence unusable.
| Quadrant | # 1 sec bins | Bins with >0 counts | Bins with >2000 counts | High rate bins dominated by noise | Noise dominated (total time) | Noise dominated (detector-on time) | Marked lightcurve |
|---|---|---|---|---|---|---|---|
| A | 7206 | 6062 | 18 | 18 | 0.25% | 0.30% | 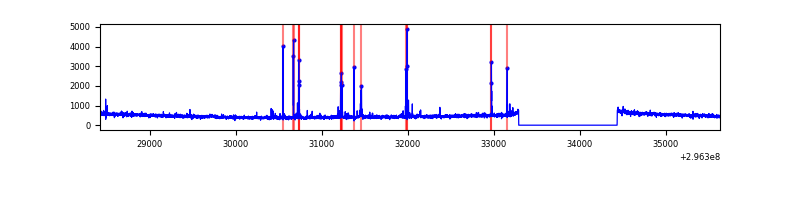 |
| B | 7207 | 6062 | 4 | 4 | 0.06% | 0.07% | 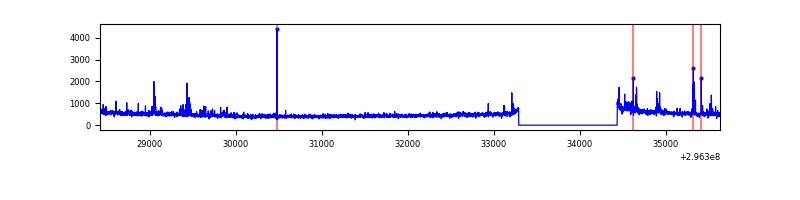 |
| C | 7207 | 6063 | 1 | 1 | 0.01% | 0.02% | 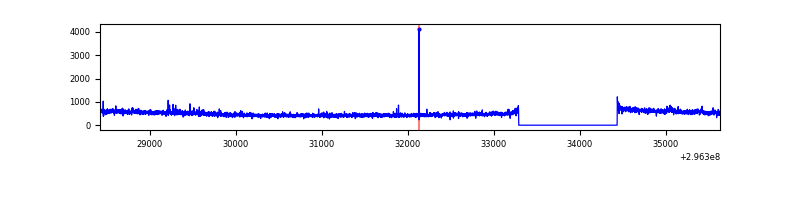 |
| D | 7206 | 6062 | 409 | 409 | 5.68% | 6.75% | 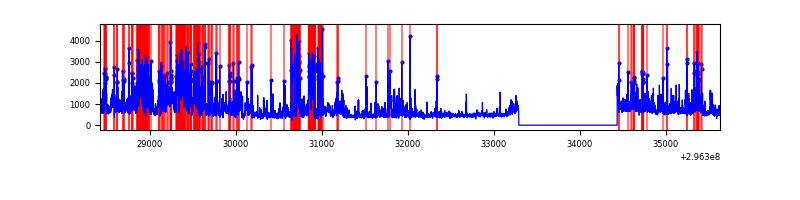 |
Top three noisy pixels from each quadrant. If the there are fewer than three noisy pixels in the level2.evt file, extra rows are filled as -1
| Pixel properties | Quadrant properties | ||||||
|---|---|---|---|---|---|---|---|
| Quadrant | DetID | PixID | Counts | Sigma | Mean | Median | Sigma |
| A | 5 | 16 | 121091 | 824.96 | 720 | 704 | 145.9 |
| A | 11 | 29 | 15165 | 99.1 | 720 | 704 | 145.9 |
| A | 0 | 226 | 6438 | 39.29 | 720 | 704 | 145.9 |
| B | 0 | 197 | 40346 | 290.92 | 727 | 708 | 136.2 |
| B | 4 | 216 | 39284 | 283.13 | 727 | 708 | 136.2 |
| B | 0 | 190 | 36158 | 260.19 | 727 | 708 | 136.2 |
| C | 14 | 238 | 113024 | 686.71 | 708 | 715 | 163.5 |
| C | 3 | 233 | 91301 | 553.88 | 708 | 715 | 163.5 |
| C | 4 | 175 | 11983 | 68.89 | 708 | 715 | 163.5 |
| D | 1 | 52 | 2277274 | 13611.15 | 691 | 668 | 167.3 |
| D | 13 | 172 | 189547 | 1129.25 | 691 | 668 | 167.3 |
| D | 2 | 234 | 28277 | 165.07 | 691 | 668 | 167.3 |
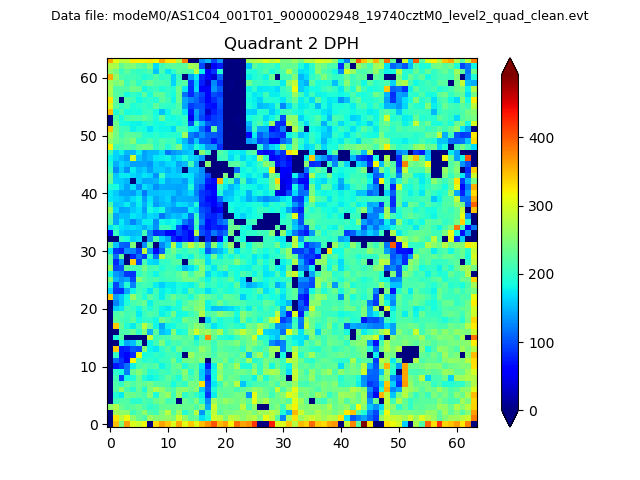
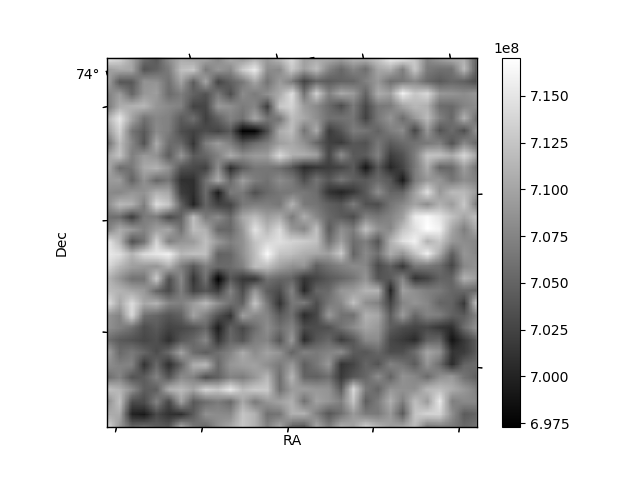
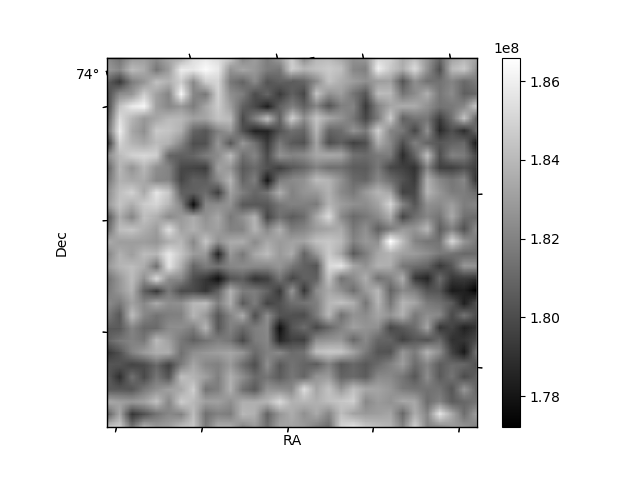
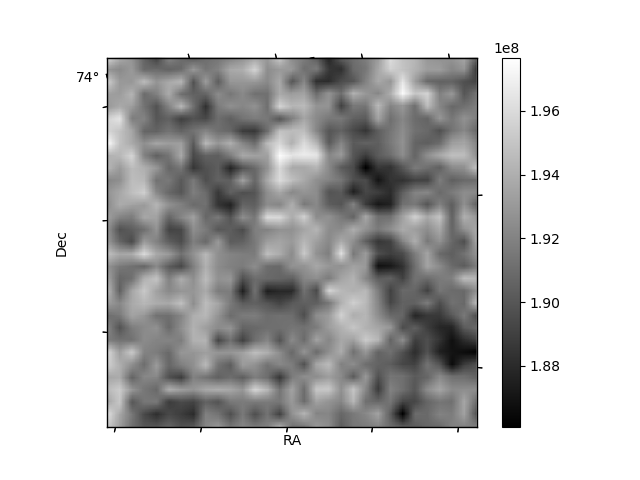
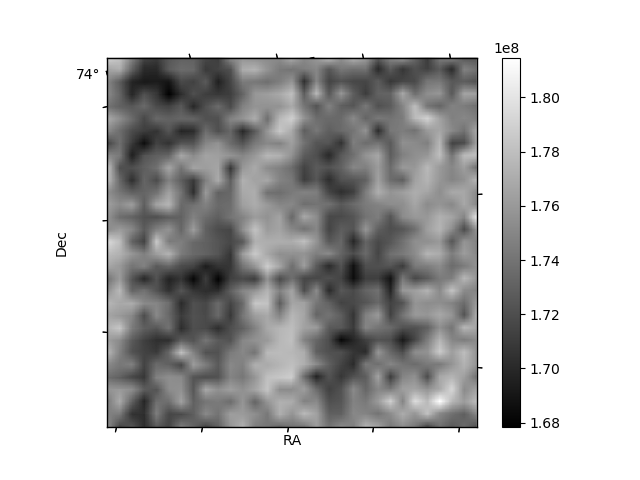
Histogram calculated using DETX and DETY for each event in the final _common_clean file
| Quadrant A | 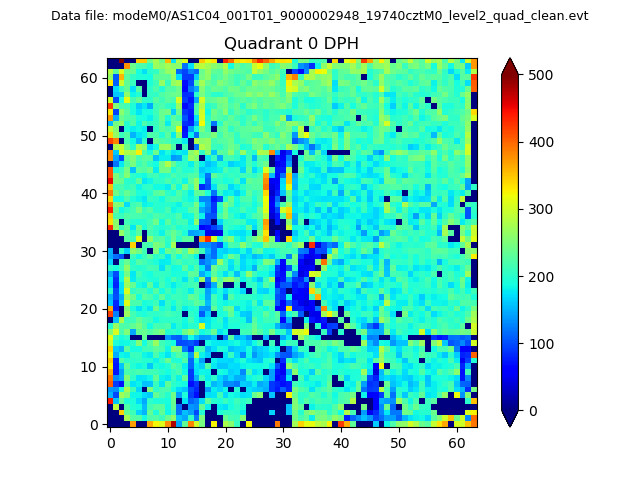 |
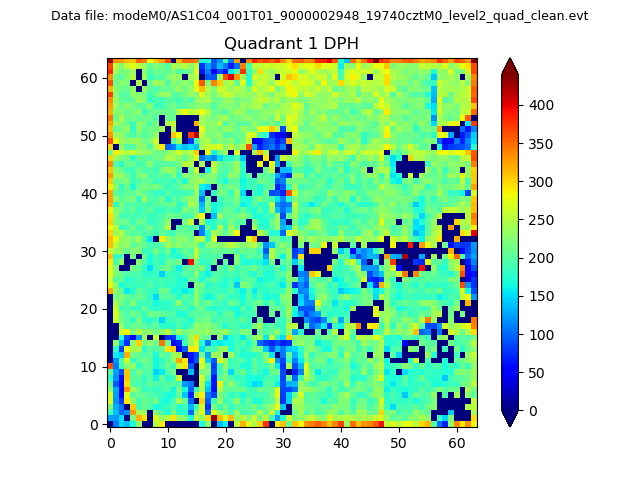 |
Quadrant B |
|---|---|---|---|
| Quadrant D | 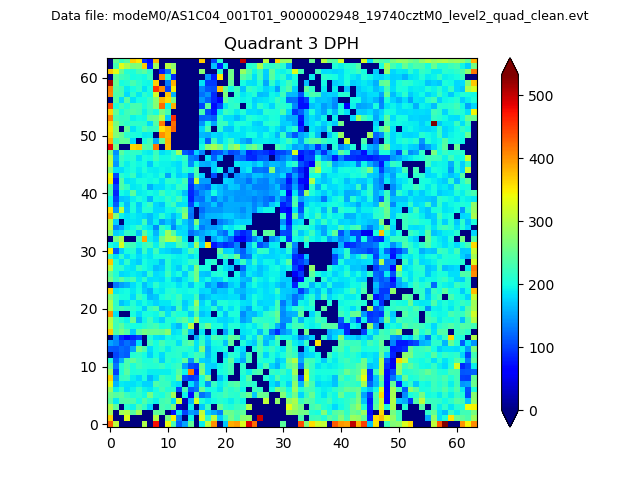 |
 |
Quadrant C |
| Plot type | Count rate plots | Images |
|---|---|---|
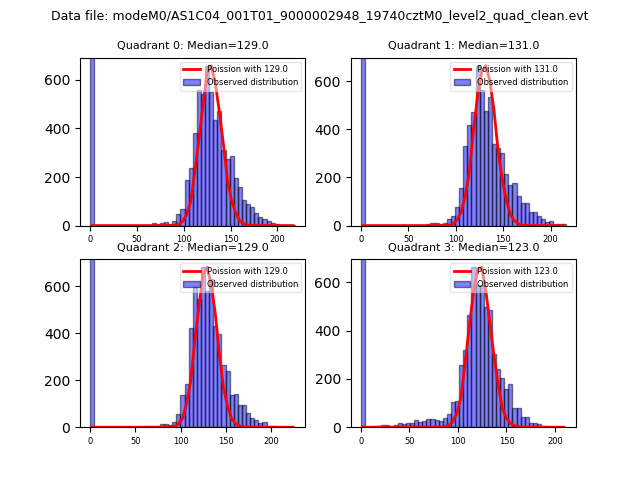
| Comparison with Poisson distribution Blue bars denote a histogram of data divided into 1 sec bins. Red curve is a Poisson curve with rate = median count rate of data. |
 |
 |
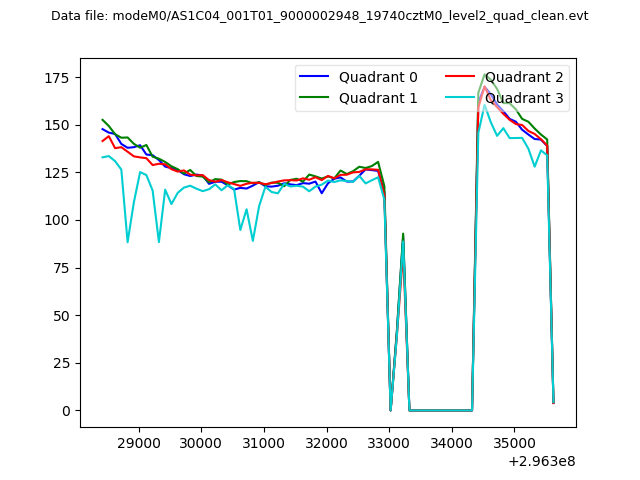
| Quadrant-wise count rates Data is divided into 100 sec bins |
 |
|
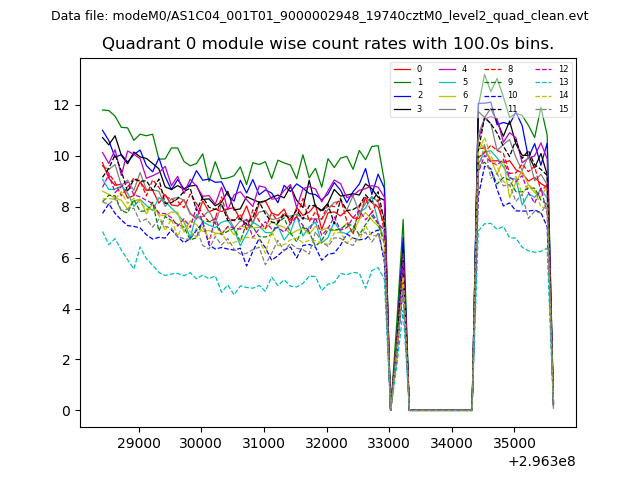
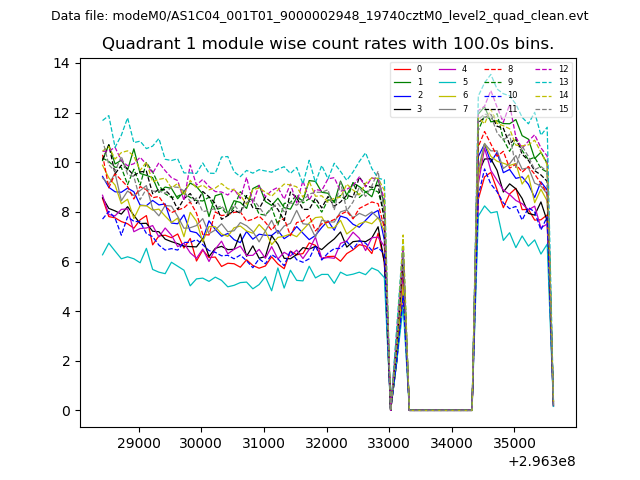
| Module-wise count rates for Quadrant A Data is divided into 100 sec bins |
 |
 |
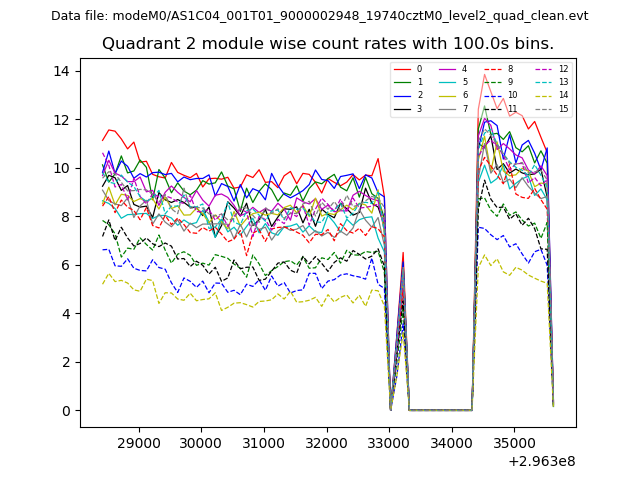
| Module-wise count rates for Quadrant B Data is divided into 100 sec bins |
 |
 |
| Module-wise count rates for Quadrant C Data is divided into 100 sec bins |
 |
 |
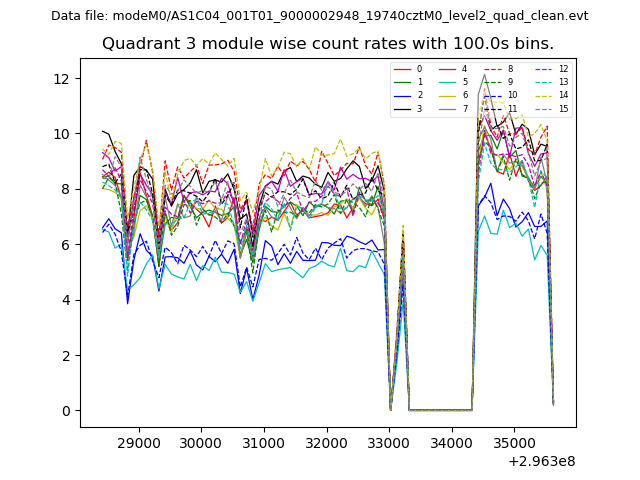
| Module-wise count rates for Quadrant D Data is divided into 100 sec bins |
 |
 |
| Parameter | Plot |
|---|---|
| CZT HV Monitor | 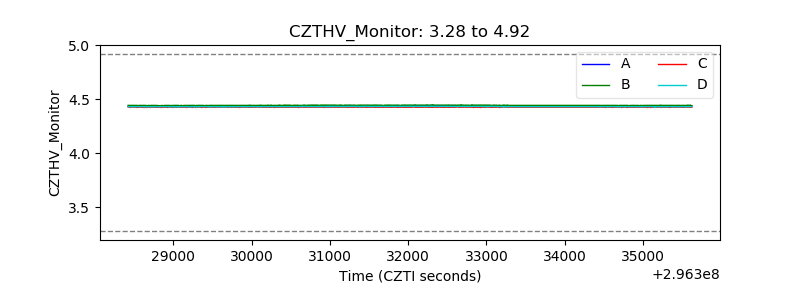 |
| D_VDD | 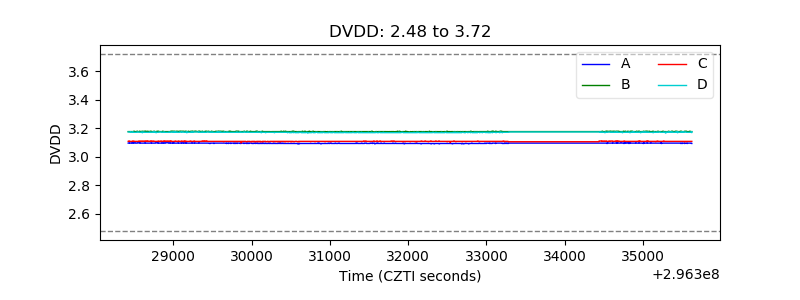 |
| Temperature 1 | 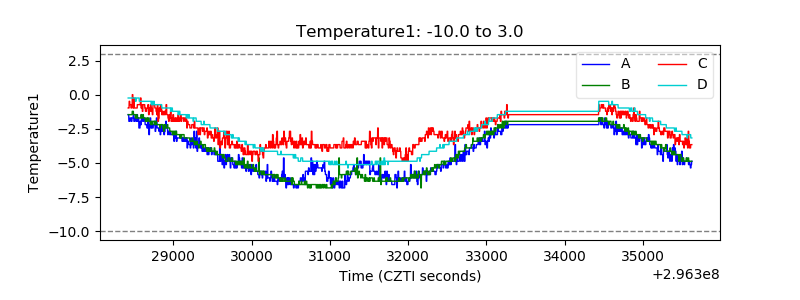 |
| Veto HV Monitor | 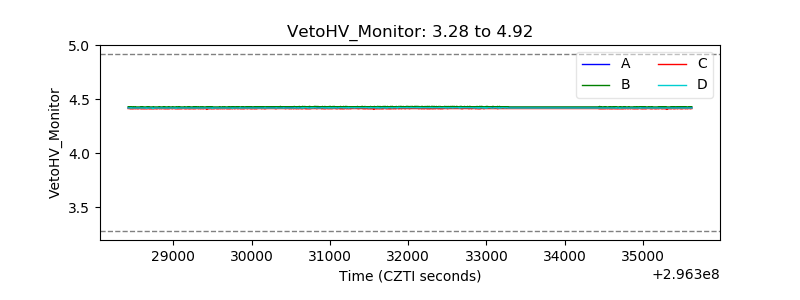 |
| Veto LLD | 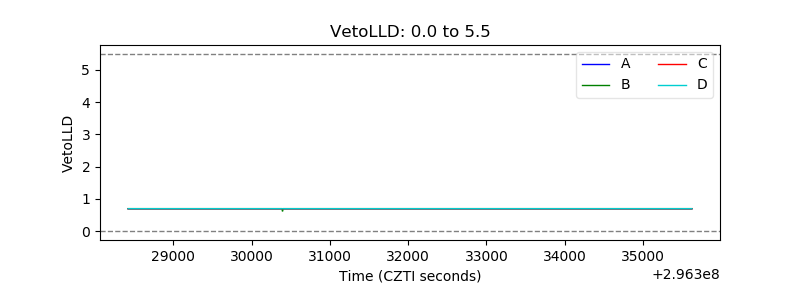 |
| Alpha Counter | 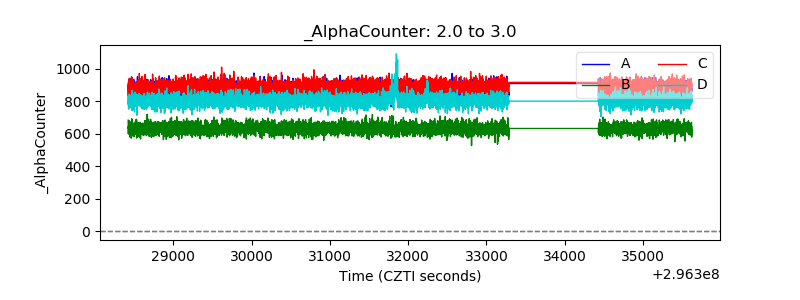 |
| _CPM_Rate | 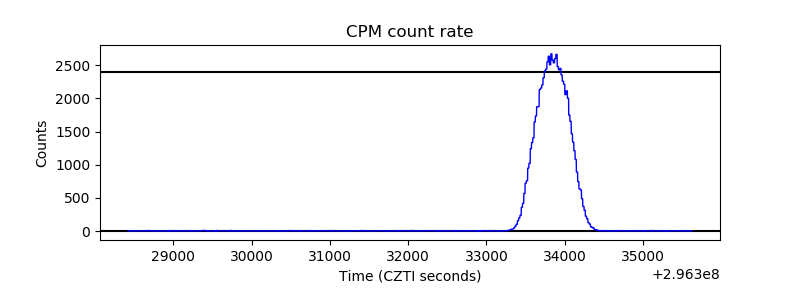 |
| CZT Counter | 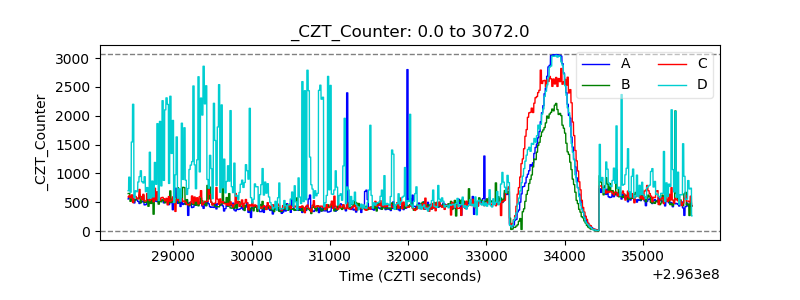 |
| +2.5 Volts monitor |  |
| +5 Volts monitor |  |
| _ROLL_ROT | 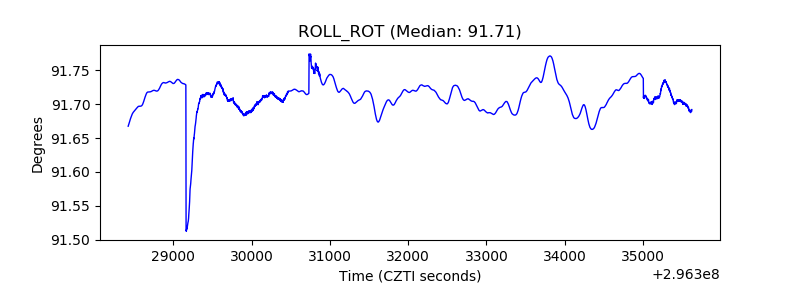 |
| _Roll_DEC | 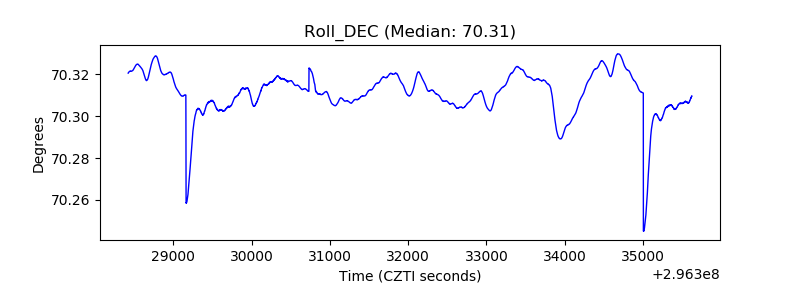 |
| _Roll_RA | 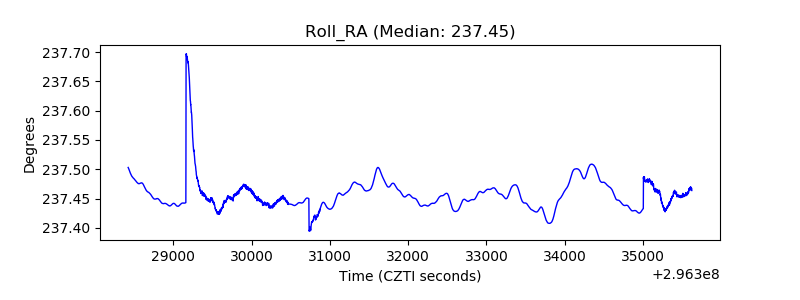 |
| Veto Counter | 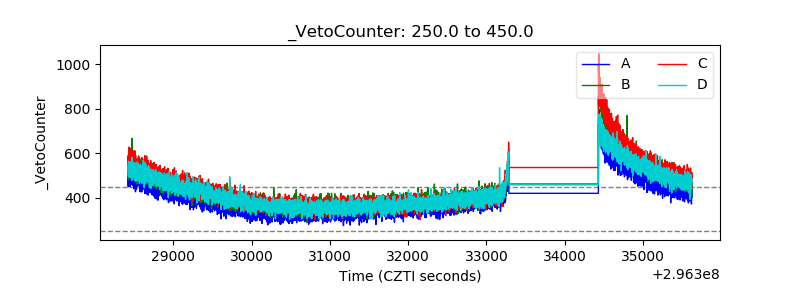 |