| Param | Original file | Final file |
|---|---|---|
| Filename | modeM0/AS1C04_001T01_9000002948_19741cztM0_level2.evt | modeM0/AS1C04_001T01_9000002948_19741cztM0_level2_quad_clean.evt |
| Size (bytes) | 468,008,640 | 124,922,880 |
| Size | 446.3 MB | 119.1 MB |
| Events in quadrant A | 2,985,138 | 836,208 |
| Events in quadrant B | 3,252,344 | 864,789 |
| Events in quadrant C | 3,484,012 | 843,554 |
| Events in quadrant D | 4,027,978 | 802,998 |
| Mode M9 | |||
|---|---|---|---|
| Quadrant | BADHDUFLAG | Total packets | Discarded packets |
| A | 0 | 12 | 0 |
| B | 0 | 12 | 0 |
| C | 0 | 12 | 0 |
| D | 0 | 12 | 0 |
| Mode SS | |||
|---|---|---|---|
| Quadrant | BADHDUFLAG | Total packets | Discarded packets |
| A | 0 | 128 | 0 |
| B | 0 | 128 | 0 |
| C | 0 | 128 | 0 |
| D | 0 | 128 | 0 |
| Mode M0 | |||
|---|---|---|---|
| Quadrant | BADHDUFLAG | Total packets | Discarded packets |
| A | 0 | 13149 | 2 |
| B | 0 | 13912 | 2 |
| C | 0 | 14722 | 2 |
| D | 0 | 16486 | 2 |
| Quadrant | Total seconds | Saturated seconds | Saturation percentage |
|---|---|---|---|
| A | 6243 | 15 | 0.240269% |
| B | 6244 | 68 | 1.089045% |
| C | 6243 | 97 | 1.553740% |
| D | 6243 | 181 | 2.899247% |
Noise dominated data is calculated using 1-second bins in cleaned event files. If a bin has >2000 counts, and if more than 50% of those come from <1% of pixels, then it is considered to be noise-dominated and hence unusable.
| Quadrant | # 1 sec bins | Bins with >0 counts | Bins with >2000 counts | High rate bins dominated by noise | Noise dominated (total time) | Noise dominated (detector-on time) | Marked lightcurve |
|---|---|---|---|---|---|---|---|
| A | 7483 | 6244 | 0 | 0 | 0.00% | 0.00% | 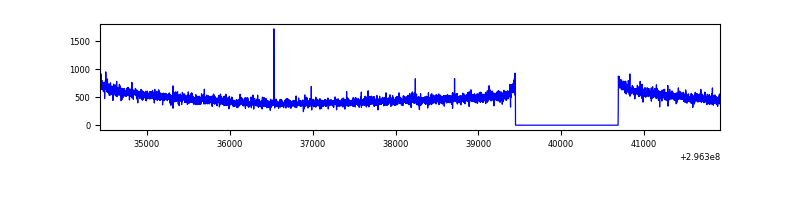 |
| B | 7484 | 6245 | 8 | 8 | 0.11% | 0.13% | 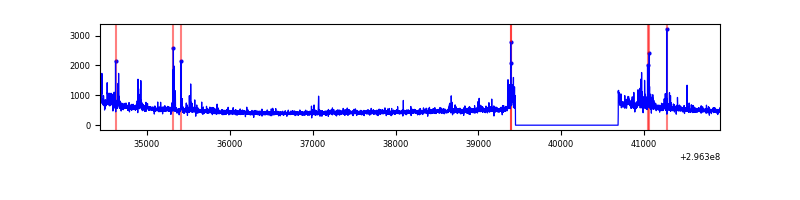 |
| C | 7483 | 6244 | 8 | 8 | 0.11% | 0.13% | 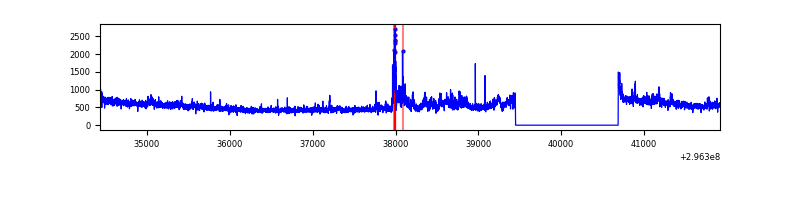 |
| D | 7483 | 6244 | 138 | 138 | 1.84% | 2.21% | 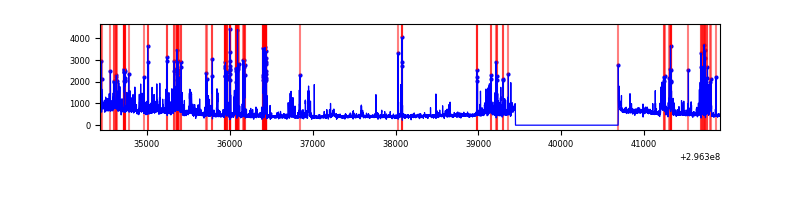 |
Top three noisy pixels from each quadrant. If the there are fewer than three noisy pixels in the level2.evt file, extra rows are filled as -1
| Pixel properties | Quadrant properties | ||||||
|---|---|---|---|---|---|---|---|
| Quadrant | DetID | PixID | Counts | Sigma | Mean | Median | Sigma |
| A | 11 | 29 | 18132 | 113.42 | 765 | 749 | 153.3 |
| A | 0 | 226 | 6875 | 39.97 | 765 | 749 | 153.3 |
| A | 3 | 1 | 6838 | 39.73 | 765 | 749 | 153.3 |
| B | 0 | 197 | 54533 | 375.68 | 777 | 759 | 143.1 |
| B | 7 | 220 | 40271 | 276.04 | 777 | 759 | 143.1 |
| B | 0 | 190 | 38966 | 266.92 | 777 | 759 | 143.1 |
| C | 3 | 233 | 374722 | 2143.26 | 757 | 763 | 174.5 |
| C | 14 | 238 | 120291 | 685.05 | 757 | 763 | 174.5 |
| C | 7 | 247 | 21092 | 116.51 | 757 | 763 | 174.5 |
| D | 1 | 52 | 784915 | 4370.8 | 751 | 730 | 179.4 |
| D | 13 | 172 | 152960 | 848.48 | 751 | 730 | 179.4 |
| D | 9 | 1 | 93867 | 519.12 | 751 | 730 | 179.4 |
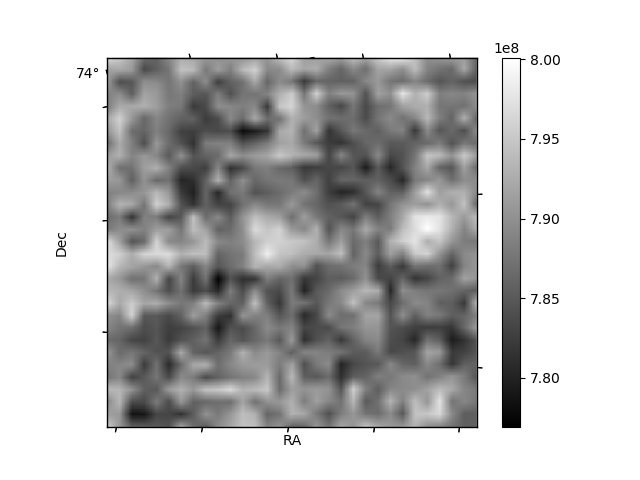
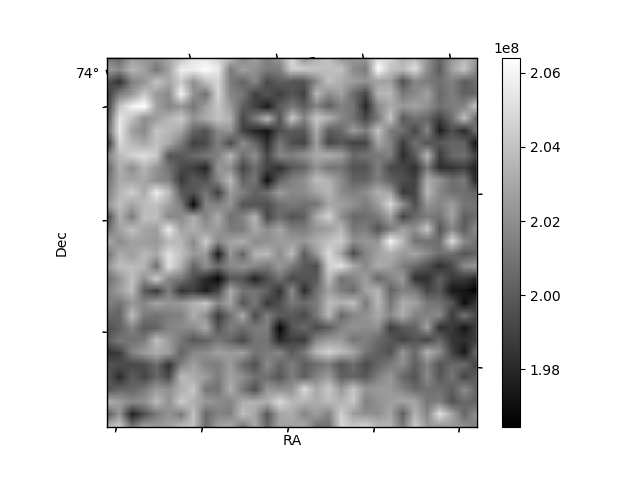
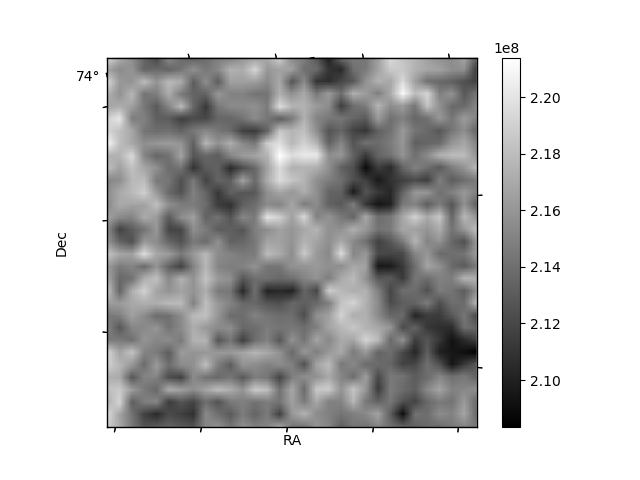
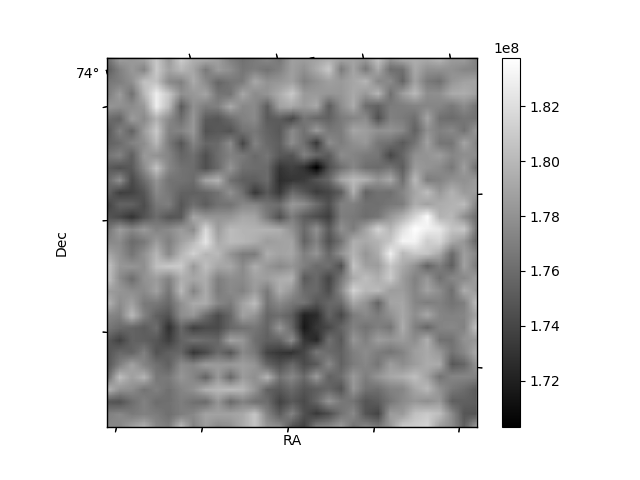
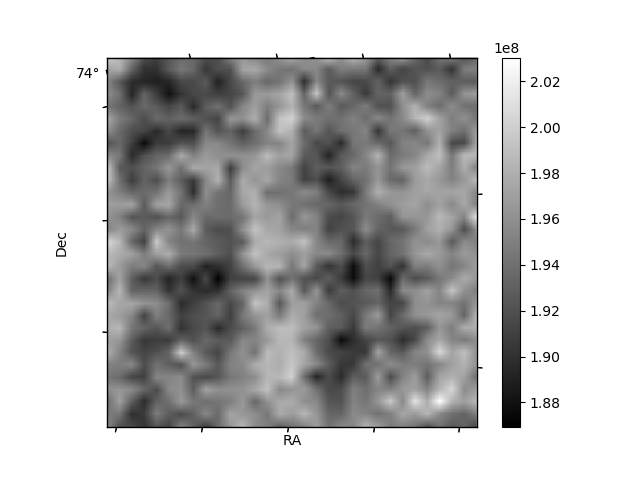
Histogram calculated using DETX and DETY for each event in the final _common_clean file
| Quadrant A | 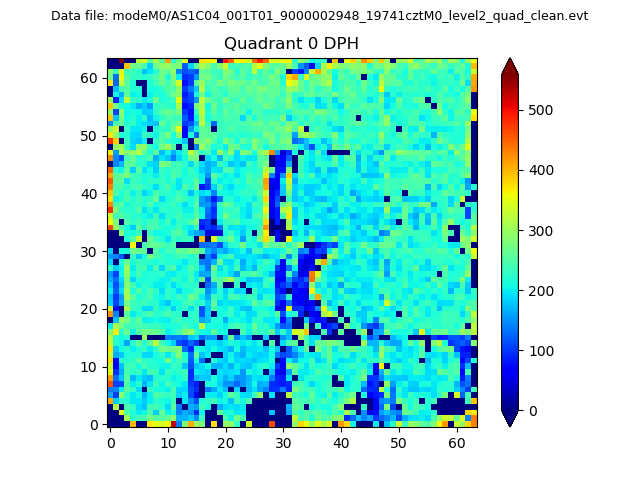 |
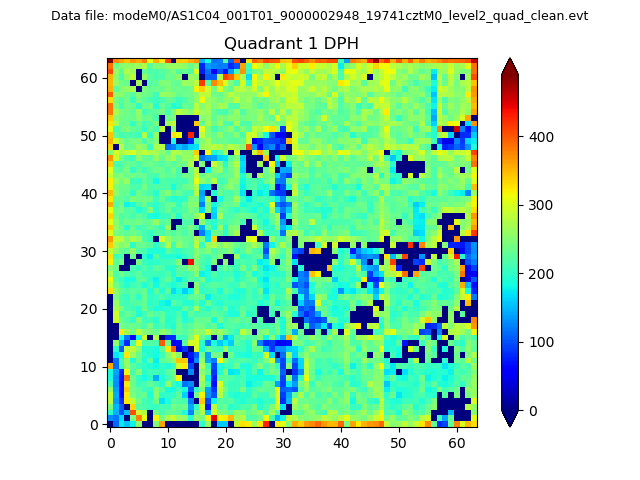 |
Quadrant B |
|---|---|---|---|
| Quadrant D | 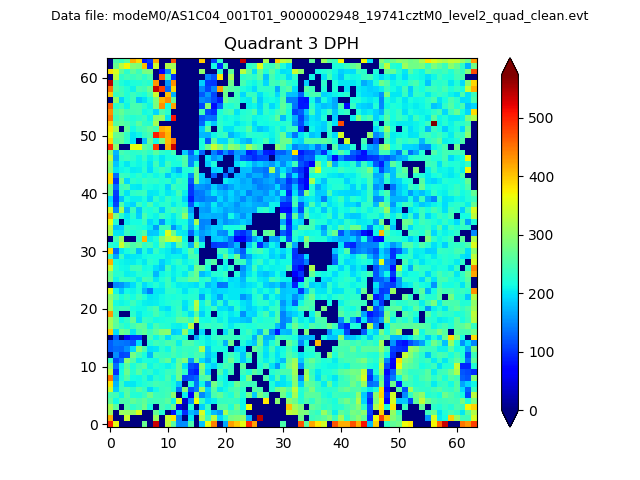 |
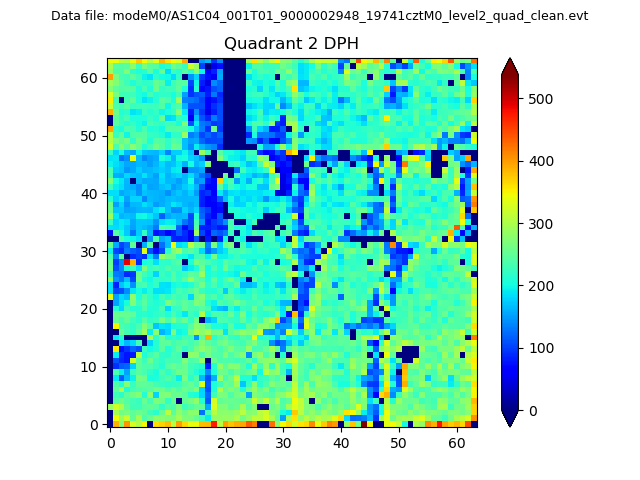 |
Quadrant C |
| Plot type | Count rate plots | Images |
|---|---|---|
| Comparison with Poisson distribution Blue bars denote a histogram of data divided into 1 sec bins. Red curve is a Poisson curve with rate = median count rate of data. |
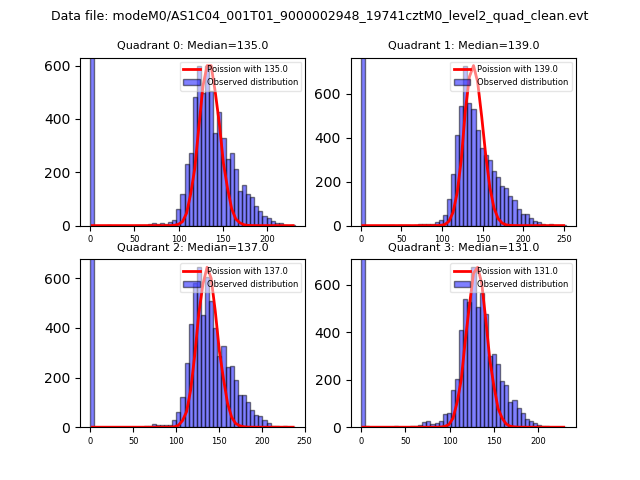 |
 |
| Quadrant-wise count rates Data is divided into 100 sec bins |
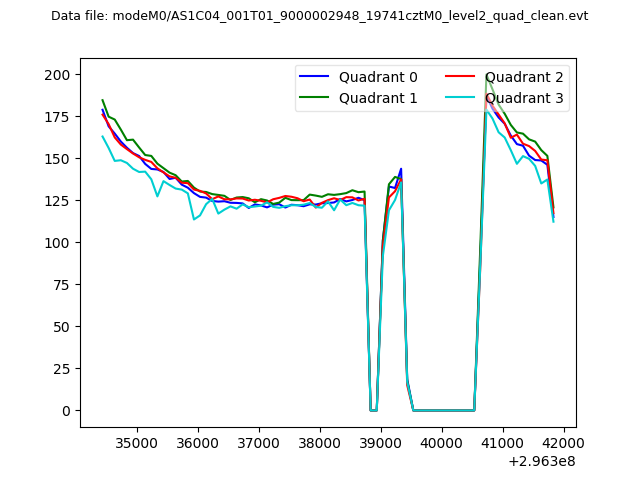 |
|
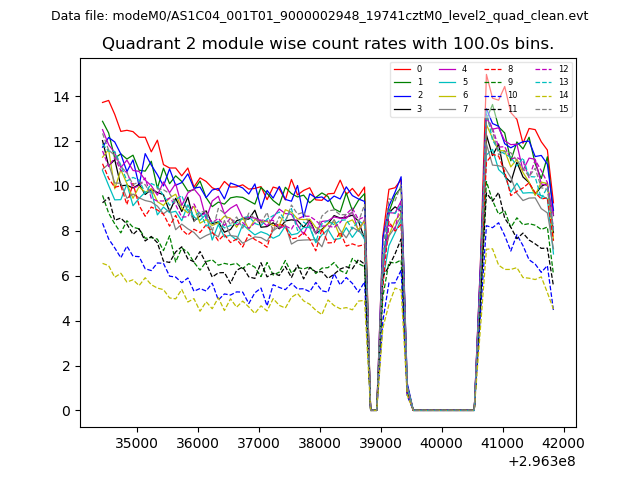
| Module-wise count rates for Quadrant A Data is divided into 100 sec bins |
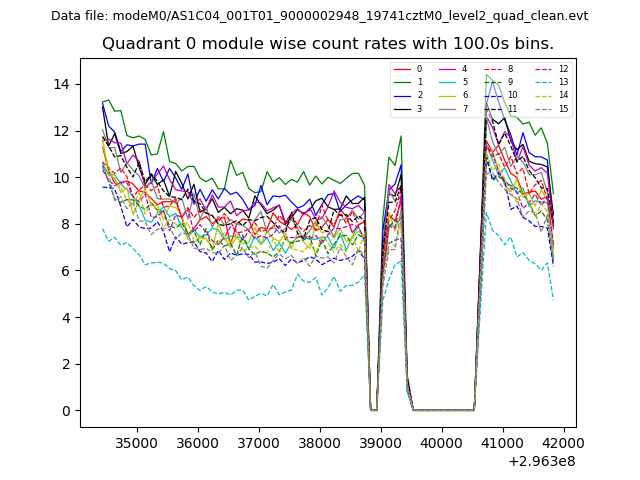 |
 |
| Module-wise count rates for Quadrant B Data is divided into 100 sec bins |
 |
 |
| Module-wise count rates for Quadrant C Data is divided into 100 sec bins |
 |
 |
| Module-wise count rates for Quadrant D Data is divided into 100 sec bins |
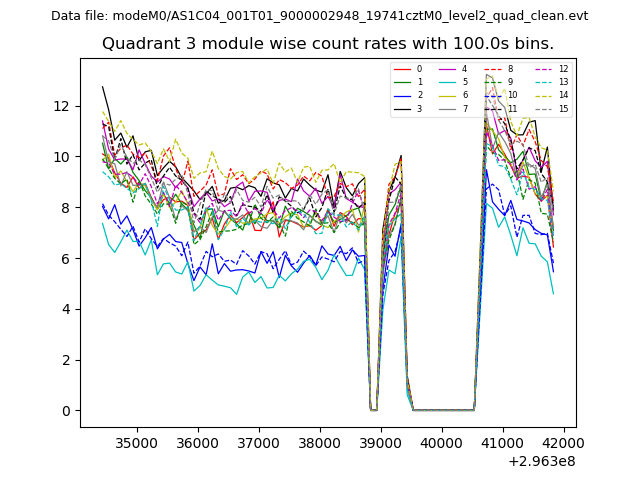 |
 |
| Parameter | Plot |
|---|---|
| CZT HV Monitor | 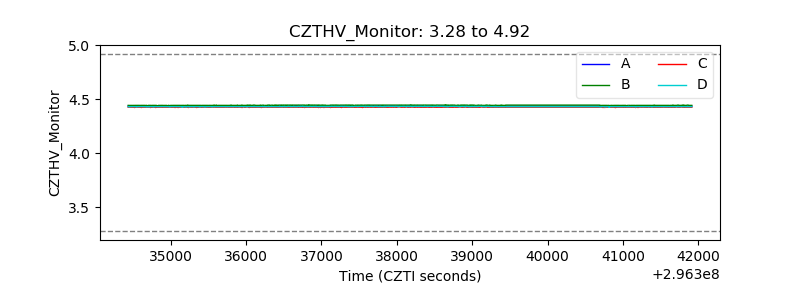 |
| D_VDD | 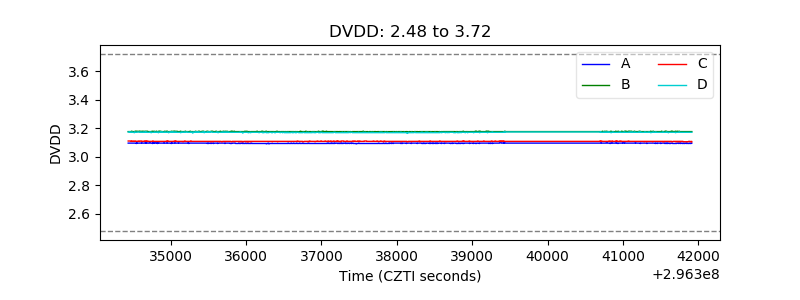 |
| Temperature 1 |  |
| Veto HV Monitor | 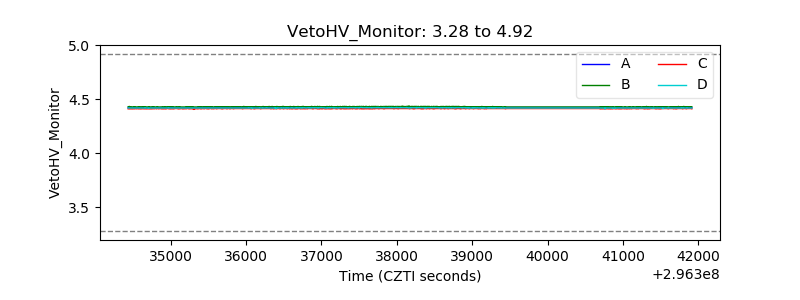 |
| Veto LLD | 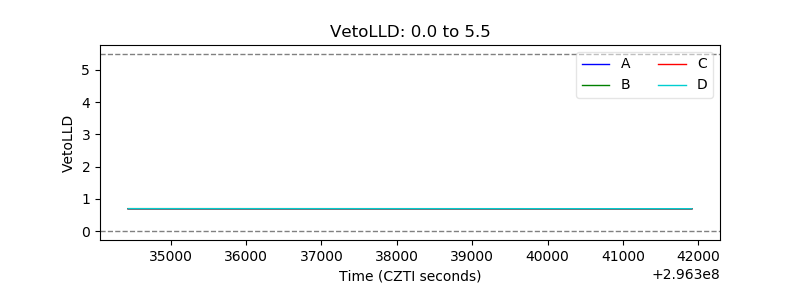 |
| Alpha Counter | 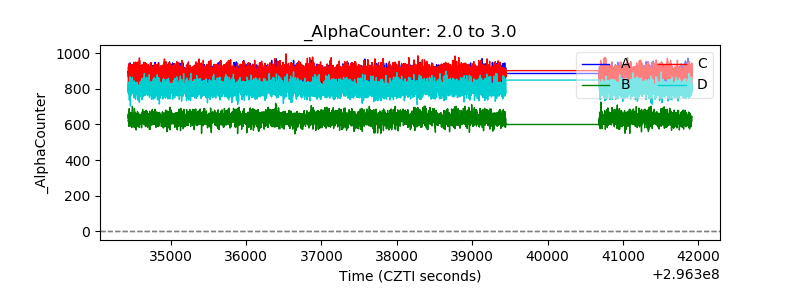 |
| _CPM_Rate | 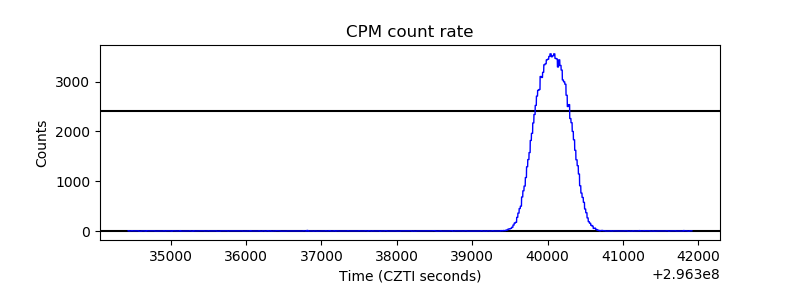 |
| CZT Counter | 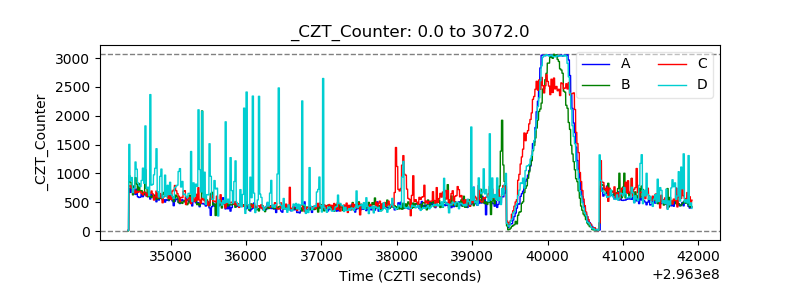 |
| +2.5 Volts monitor |  |
| +5 Volts monitor |  |
| _ROLL_ROT | 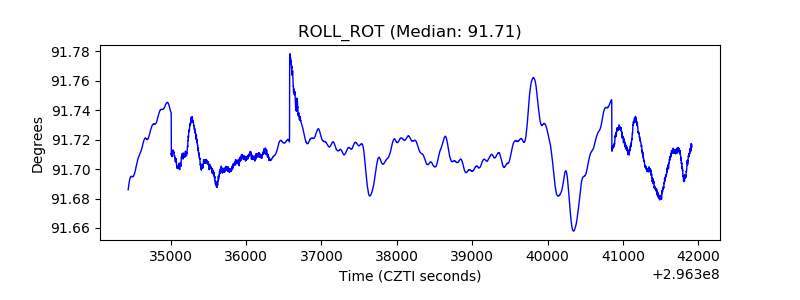 |
| _Roll_DEC |  |
| _Roll_RA | 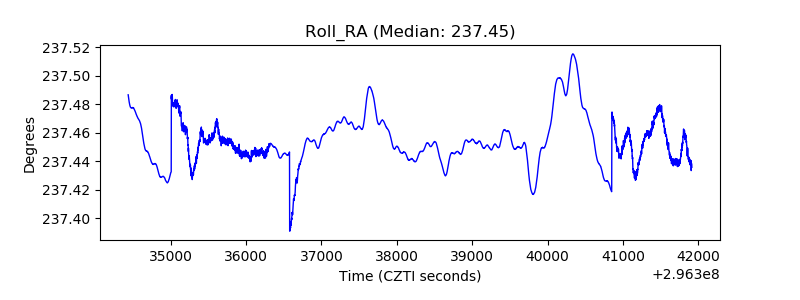 |
| Veto Counter |  |