| Param | Original file | Final file |
|---|---|---|
| Filename | modeM0/AS1C04_001T01_9000002948_19743cztM0_level2.evt | modeM0/AS1C04_001T01_9000002948_19743cztM0_level2_quad_clean.evt |
| Size (bytes) | 436,386,240 | 125,046,720 |
| Size | 416.2 MB | 119.3 MB |
| Events in quadrant A | 2,915,048 | 842,523 |
| Events in quadrant B | 3,081,704 | 876,651 |
| Events in quadrant C | 3,266,865 | 845,807 |
| Events in quadrant D | 3,539,784 | 798,677 |
| Mode M9 | |||
|---|---|---|---|
| Quadrant | BADHDUFLAG | Total packets | Discarded packets |
| A | 0 | 18 | 0 |
| B | 0 | 19 | 0 |
| C | 0 | 19 | 0 |
| D | 0 | 19 | 0 |
| Mode SS | |||
|---|---|---|---|
| Quadrant | BADHDUFLAG | Total packets | Discarded packets |
| A | 0 | 124 | 0 |
| B | 0 | 124 | 0 |
| C | 0 | 124 | 0 |
| D | 0 | 124 | 0 |
| Mode M0 | |||
|---|---|---|---|
| Quadrant | BADHDUFLAG | Total packets | Discarded packets |
| A | 0 | 12623 | 2 |
| B | 0 | 13026 | 2 |
| C | 0 | 13606 | 2 |
| D | 0 | 14792 | 2 |
| Quadrant | Total seconds | Saturated seconds | Saturation percentage |
|---|---|---|---|
| A | 6070 | 5 | 0.082372% |
| B | 6070 | 24 | 0.395387% |
| C | 6070 | 59 | 0.971993% |
| D | 6070 | 121 | 1.993410% |
Noise dominated data is calculated using 1-second bins in cleaned event files. If a bin has >2000 counts, and if more than 50% of those come from <1% of pixels, then it is considered to be noise-dominated and hence unusable.
| Quadrant | # 1 sec bins | Bins with >0 counts | Bins with >2000 counts | High rate bins dominated by noise | Noise dominated (total time) | Noise dominated (detector-on time) | Marked lightcurve |
|---|---|---|---|---|---|---|---|
| A | 7475 | 6071 | 0 | 0 | 0.00% | 0.00% | 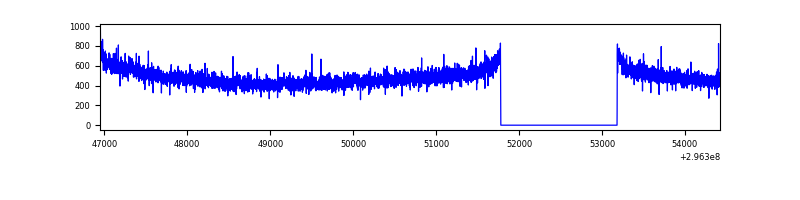 |
| B | 7475 | 6071 | 0 | 0 | 0.00% | 0.00% | 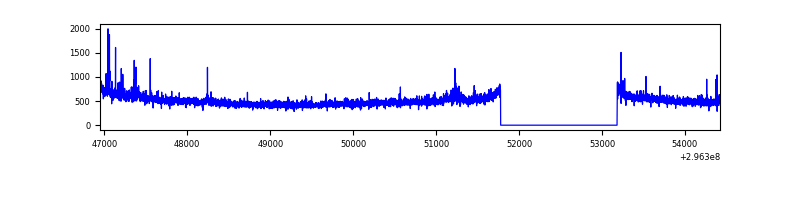 |
| C | 7475 | 6071 | 0 | 0 | 0.00% | 0.00% | 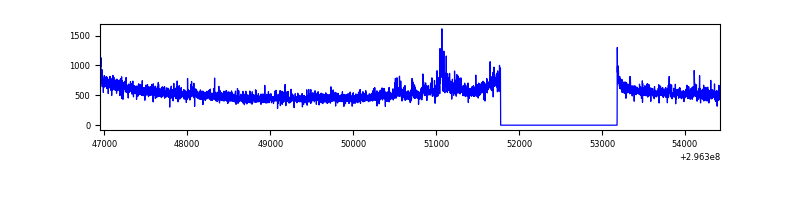 |
| D | 7475 | 6071 | 86 | 86 | 1.15% | 1.42% | 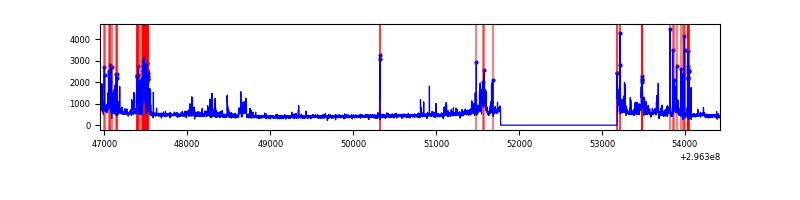 |
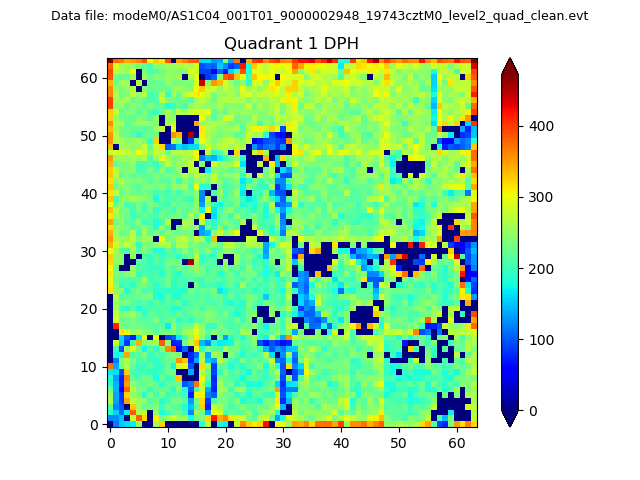
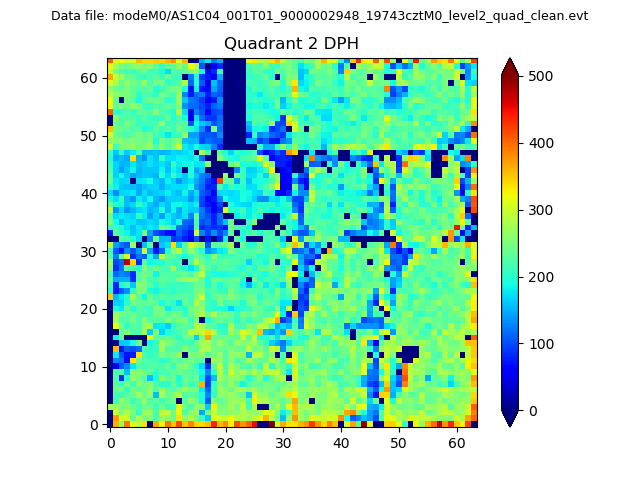
Top three noisy pixels from each quadrant. If the there are fewer than three noisy pixels in the level2.evt file, extra rows are filled as -1
| Pixel properties | Quadrant properties | ||||||
|---|---|---|---|---|---|---|---|
| Quadrant | DetID | PixID | Counts | Sigma | Mean | Median | Sigma |
| A | 11 | 29 | 17215 | 110.04 | 753 | 740 | 149.7 |
| A | 0 | 226 | 6507 | 38.52 | 753 | 740 | 149.7 |
| A | 13 | 254 | 6440 | 38.07 | 753 | 740 | 149.7 |
| B | 7 | 220 | 22776 | 155.8 | 768 | 750 | 141.4 |
| B | 12 | 111 | 15875 | 106.98 | 768 | 750 | 141.4 |
| B | 4 | 142 | 15398 | 103.61 | 768 | 750 | 141.4 |
| C | 3 | 233 | 240007 | 1414.78 | 740 | 747 | 169.1 |
| C | 14 | 238 | 118788 | 697.99 | 740 | 747 | 169.1 |
| C | 7 | 247 | 15066 | 84.67 | 740 | 747 | 169.1 |
| D | 1 | 52 | 582656 | 3320.24 | 728 | 707 | 175.3 |
| D | 12 | 225 | 47899 | 269.25 | 728 | 707 | 175.3 |
| D | 13 | 172 | 35820 | 200.33 | 728 | 707 | 175.3 |
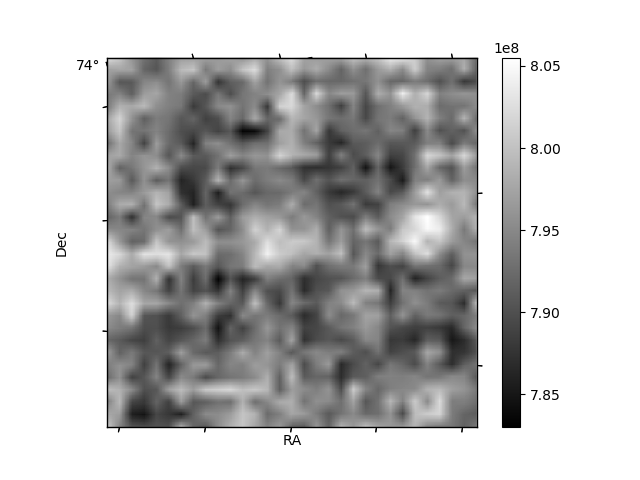
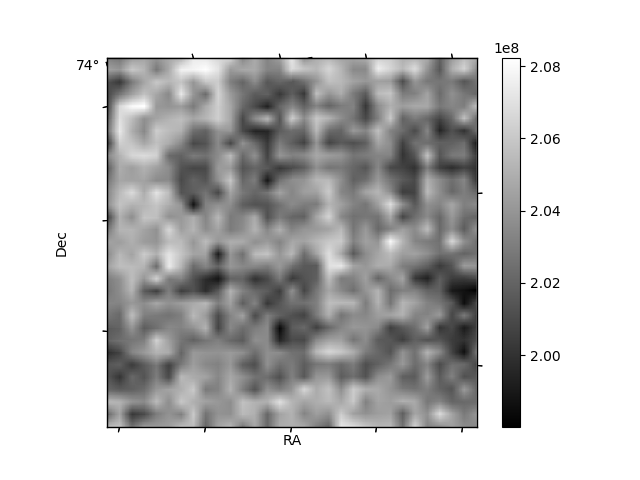
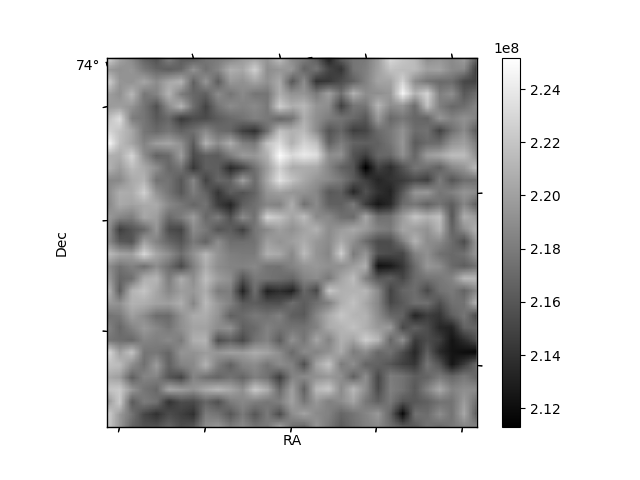
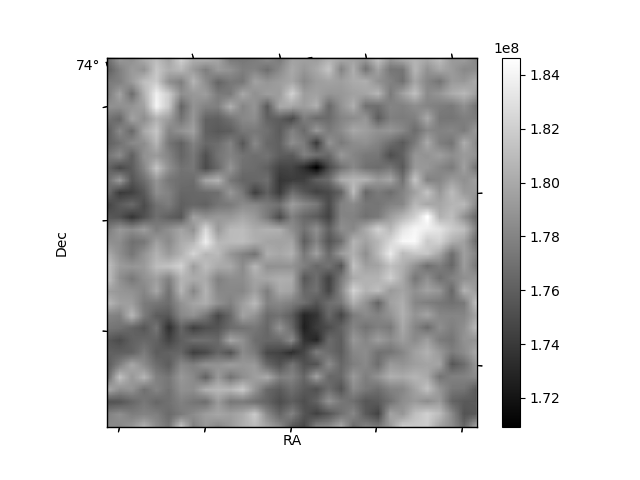
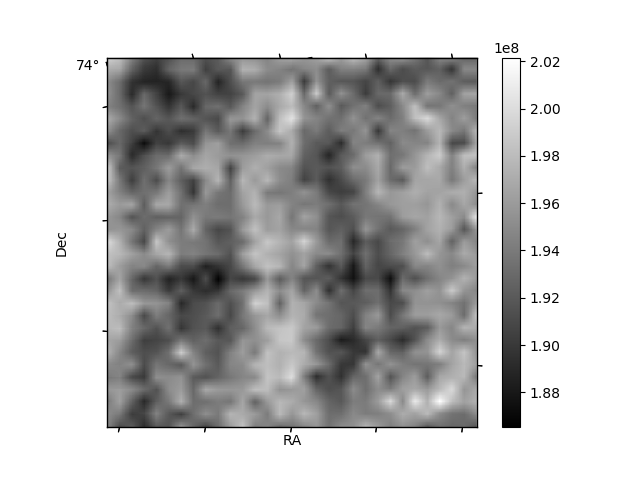
Histogram calculated using DETX and DETY for each event in the final _common_clean file
| Quadrant A | 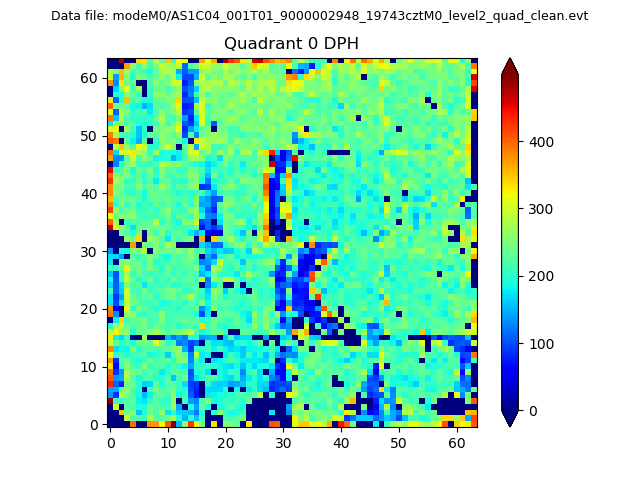 |
 |
Quadrant B |
|---|---|---|---|
| Quadrant D | 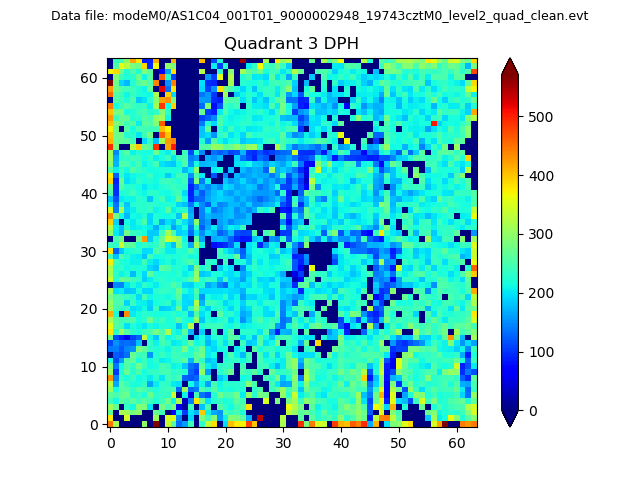 |
 |
Quadrant C |
| Plot type | Count rate plots | Images |
|---|---|---|
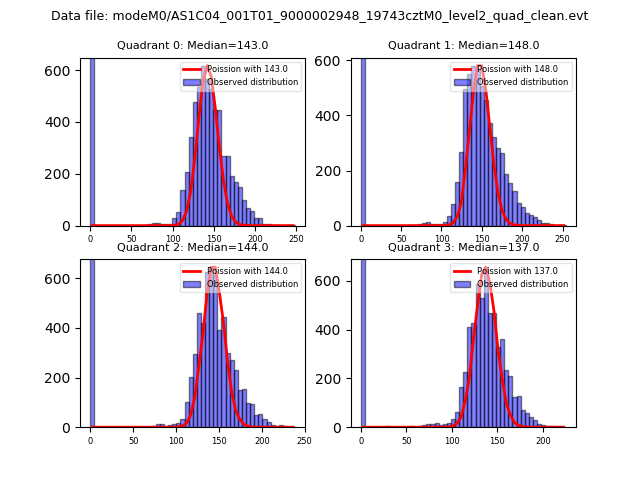
| Comparison with Poisson distribution Blue bars denote a histogram of data divided into 1 sec bins. Red curve is a Poisson curve with rate = median count rate of data. |
 |
 |
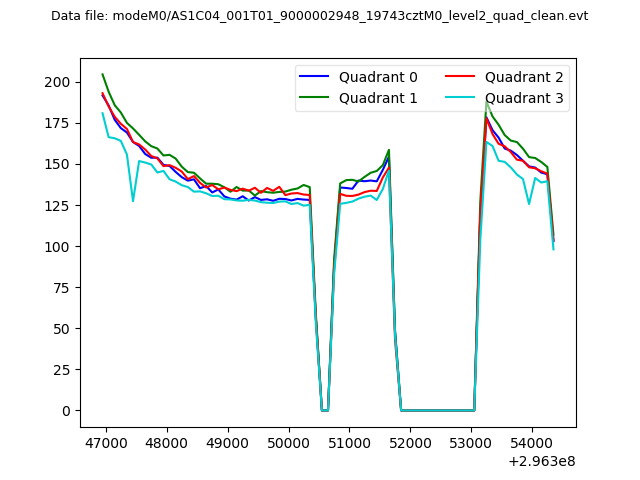
| Quadrant-wise count rates Data is divided into 100 sec bins |
 |
|
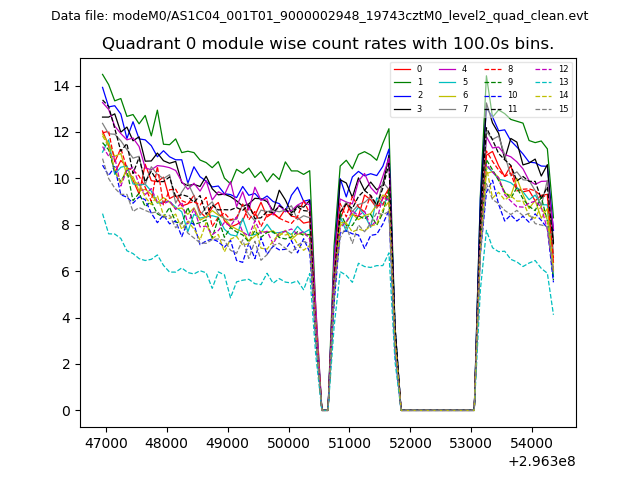
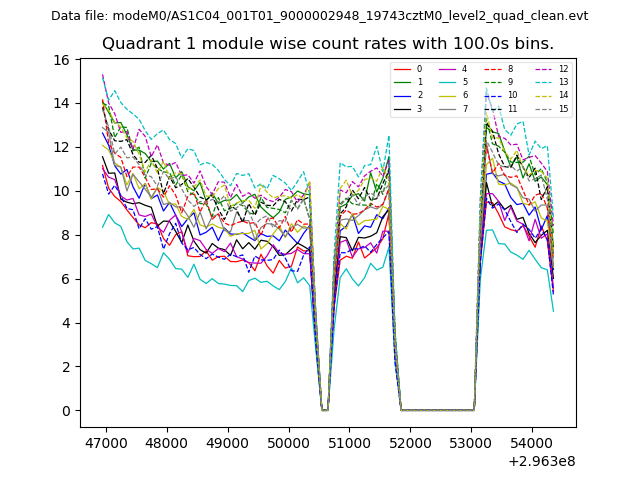
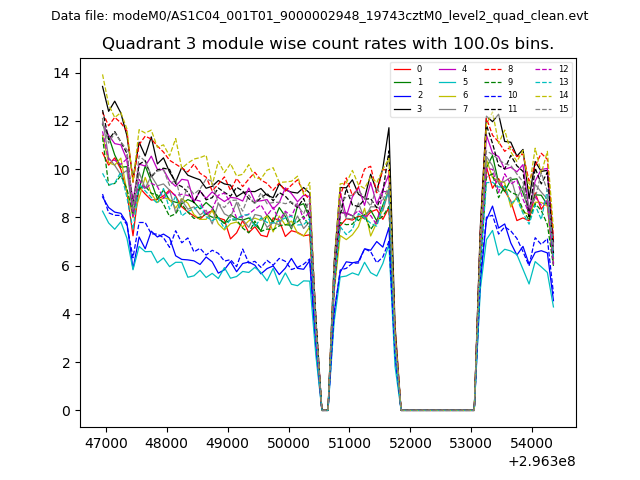
| Module-wise count rates for Quadrant A Data is divided into 100 sec bins |
 |
 |
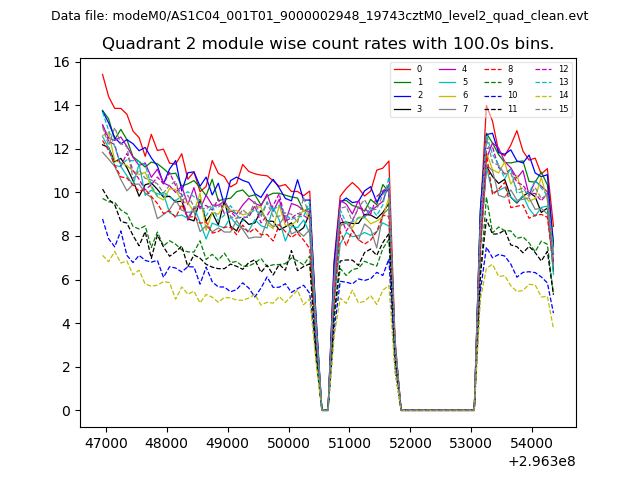
| Module-wise count rates for Quadrant B Data is divided into 100 sec bins |
 |
 |
| Module-wise count rates for Quadrant C Data is divided into 100 sec bins |
 |
 |
| Module-wise count rates for Quadrant D Data is divided into 100 sec bins |
 |
 |
| Parameter | Plot |
|---|---|
| CZT HV Monitor | 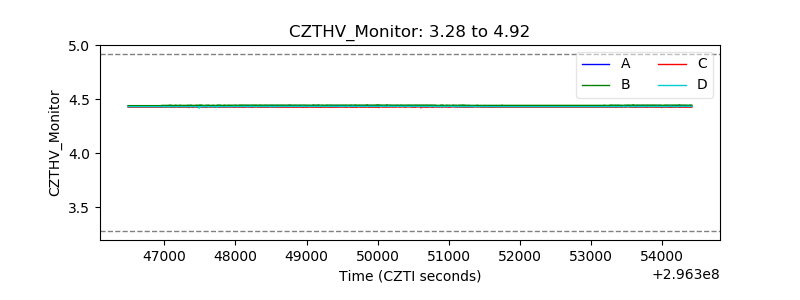 |
| D_VDD | 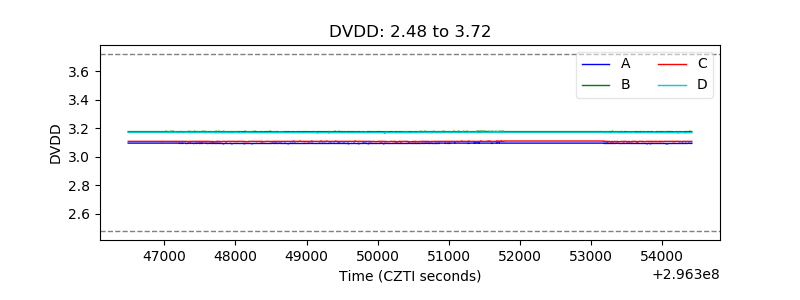 |
| Temperature 1 | 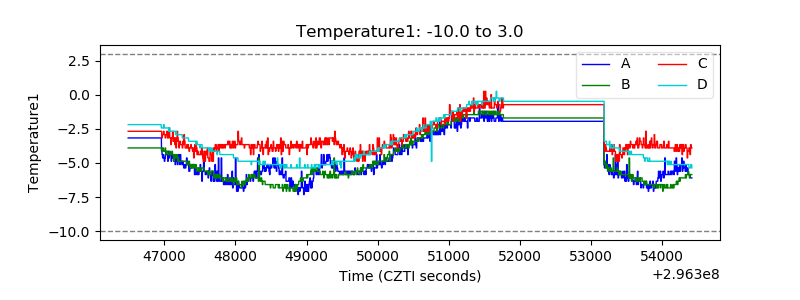 |
| Veto HV Monitor | 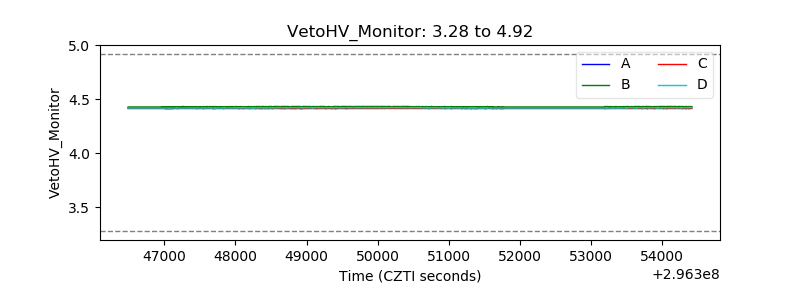 |
| Veto LLD | 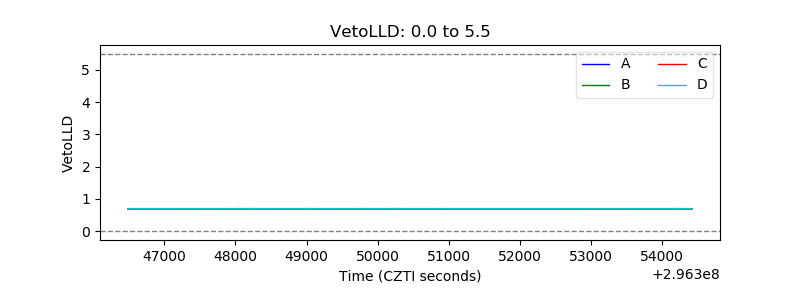 |
| Alpha Counter | 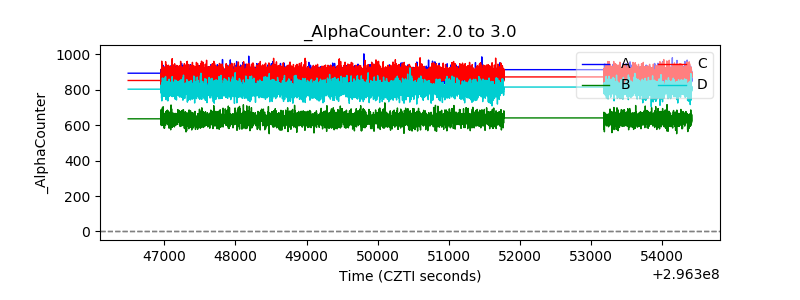 |
| _CPM_Rate | 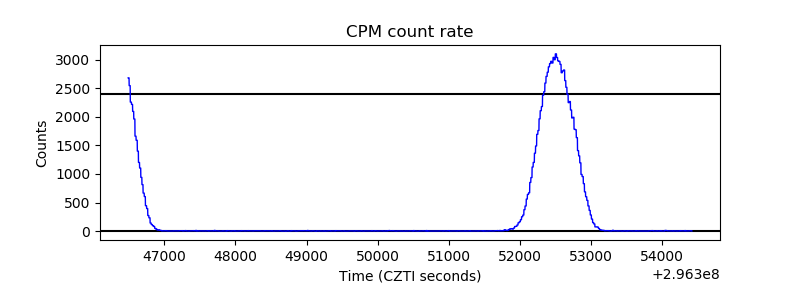 |
| CZT Counter | 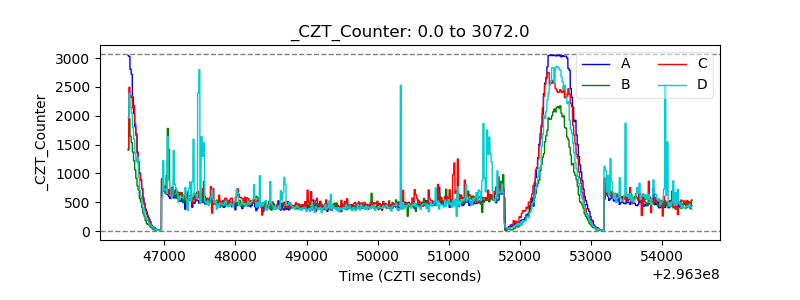 |
| +2.5 Volts monitor |  |
| +5 Volts monitor |  |
| _ROLL_ROT | 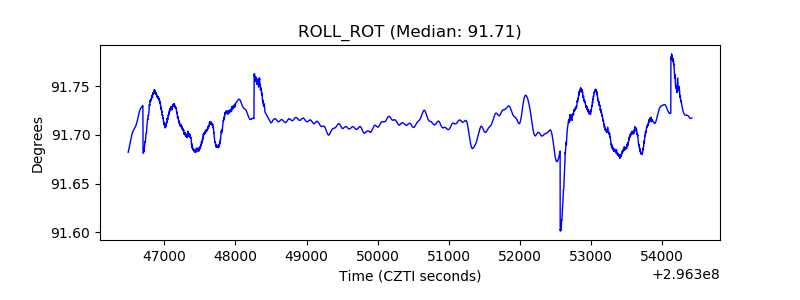 |
| _Roll_DEC | 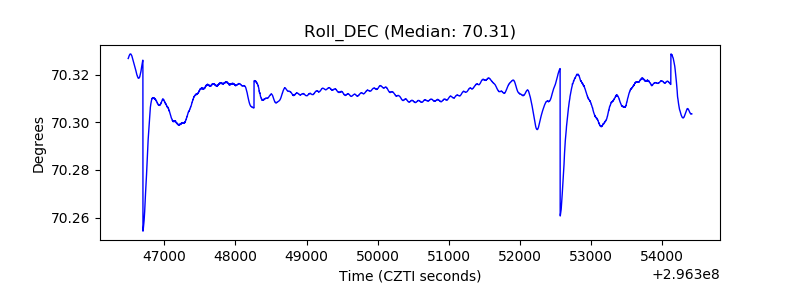 |
| _Roll_RA | 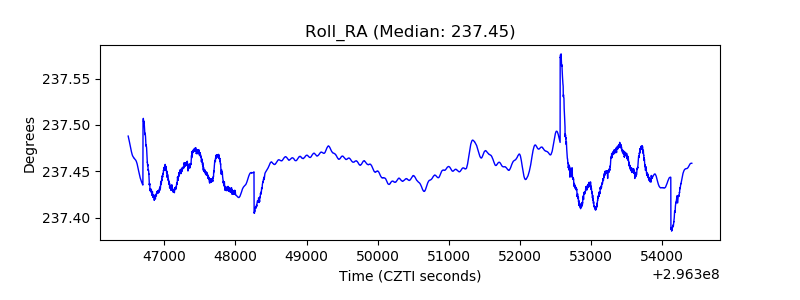 |
| Veto Counter | 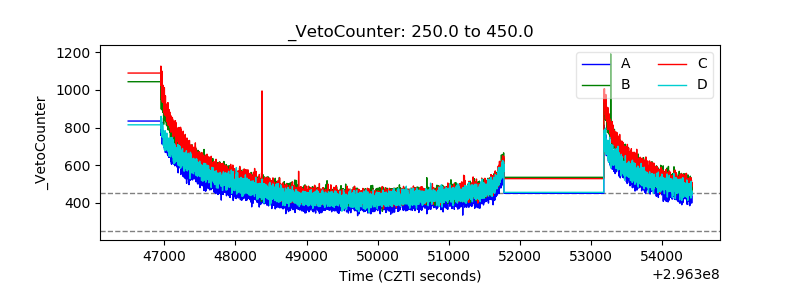 |