| Param | Original file | Final file |
|---|---|---|
| Filename | modeM0/AS1C04_001T01_9000002948_19744cztM0_level2.evt | modeM0/AS1C04_001T01_9000002948_19744cztM0_level2_quad_clean.evt |
| Size (bytes) | 465,935,040 | 128,373,120 |
| Size | 444.4 MB | 122.4 MB |
| Events in quadrant A | 3,052,482 | 867,506 |
| Events in quadrant B | 3,273,550 | 895,509 |
| Events in quadrant C | 3,593,302 | 858,567 |
| Events in quadrant D | 3,752,661 | 815,924 |
| Mode M9 | |||
|---|---|---|---|
| Quadrant | BADHDUFLAG | Total packets | Discarded packets |
| A | 0 | 21 | 0 |
| B | 0 | 22 | 0 |
| C | 0 | 22 | 0 |
| D | 0 | 22 | 0 |
| Mode SS | |||
|---|---|---|---|
| Quadrant | BADHDUFLAG | Total packets | Discarded packets |
| A | 0 | 130 | 0 |
| B | 0 | 130 | 0 |
| C | 0 | 130 | 0 |
| D | 0 | 130 | 0 |
| Mode M0 | |||
|---|---|---|---|
| Quadrant | BADHDUFLAG | Total packets | Discarded packets |
| A | 0 | 13375 | 3 |
| B | 0 | 13888 | 2 |
| C | 0 | 14754 | 2 |
| D | 0 | 15694 | 2 |
| Quadrant | Total seconds | Saturated seconds | Saturation percentage |
|---|---|---|---|
| A | 6464 | 19 | 0.293936% |
| B | 6464 | 50 | 0.773515% |
| C | 6464 | 74 | 1.144802% |
| D | 6464 | 130 | 2.011139% |
Noise dominated data is calculated using 1-second bins in cleaned event files. If a bin has >2000 counts, and if more than 50% of those come from <1% of pixels, then it is considered to be noise-dominated and hence unusable.
| Quadrant | # 1 sec bins | Bins with >0 counts | Bins with >2000 counts | High rate bins dominated by noise | Noise dominated (total time) | Noise dominated (detector-on time) | Marked lightcurve |
|---|---|---|---|---|---|---|---|
| A | 7794 | 6465 | 0 | 0 | 0.00% | 0.00% |  |
| B | 7794 | 6465 | 14 | 14 | 0.18% | 0.22% | 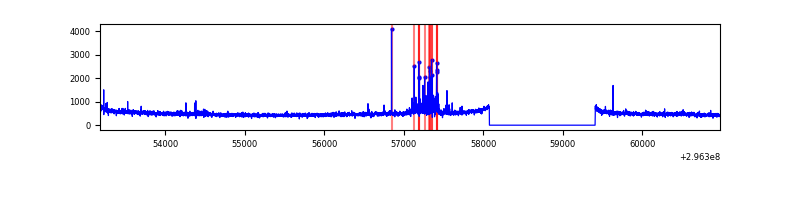 |
| C | 7794 | 6465 | 0 | 0 | 0.00% | 0.00% | 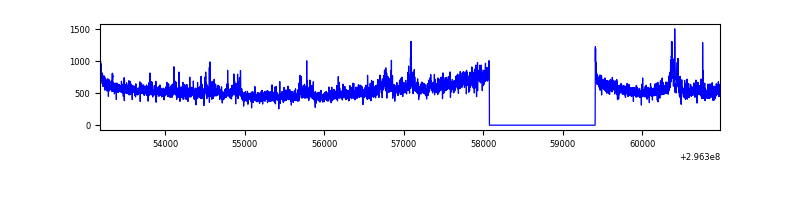 |
| D | 7794 | 6465 | 84 | 84 | 1.08% | 1.30% | 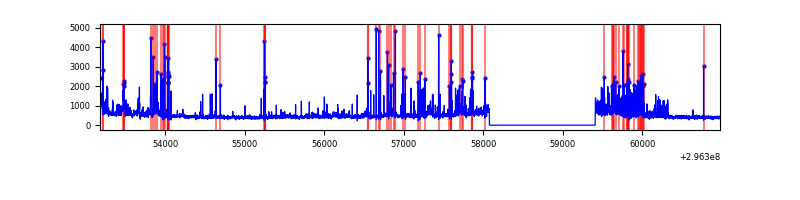 |
Top three noisy pixels from each quadrant. If the there are fewer than three noisy pixels in the level2.evt file, extra rows are filled as -1
| Pixel properties | Quadrant properties | ||||||
|---|---|---|---|---|---|---|---|
| Quadrant | DetID | PixID | Counts | Sigma | Mean | Median | Sigma |
| A | 11 | 29 | 30154 | 188.59 | 783 | 767 | 155.8 |
| A | 0 | 226 | 6832 | 38.92 | 783 | 767 | 155.8 |
| A | 13 | 254 | 6436 | 36.38 | 783 | 767 | 155.8 |
| B | 7 | 220 | 108984 | 737.32 | 796 | 778 | 146.8 |
| B | 12 | 111 | 16770 | 108.97 | 796 | 778 | 146.8 |
| B | 0 | 198 | 15148 | 97.92 | 796 | 778 | 146.8 |
| C | 3 | 233 | 453957 | 2593.71 | 762 | 770 | 174.7 |
| C | 14 | 238 | 121788 | 692.62 | 762 | 770 | 174.7 |
| C | 7 | 247 | 36081 | 202.09 | 762 | 770 | 174.7 |
| D | 1 | 52 | 678948 | 3761.36 | 750 | 729 | 180.3 |
| D | 12 | 225 | 97476 | 536.55 | 750 | 729 | 180.3 |
| D | 7 | 238 | 54864 | 300.23 | 750 | 729 | 180.3 |
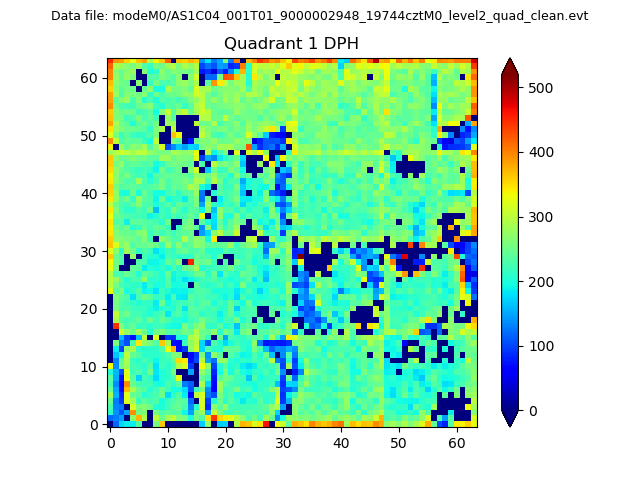
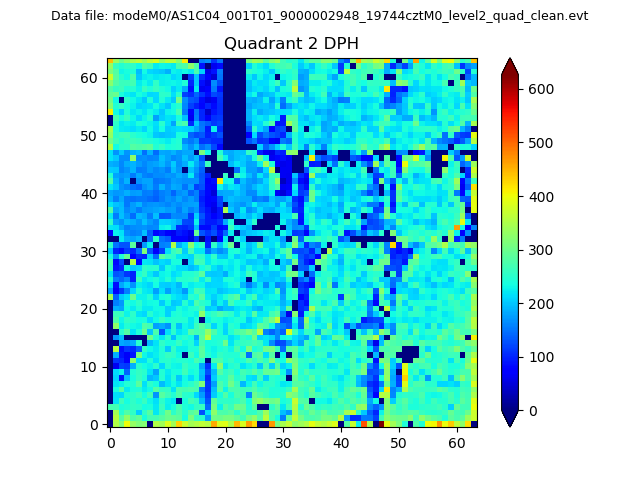
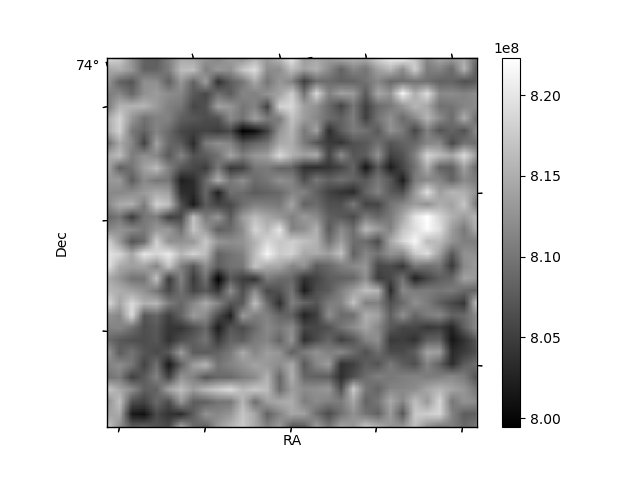
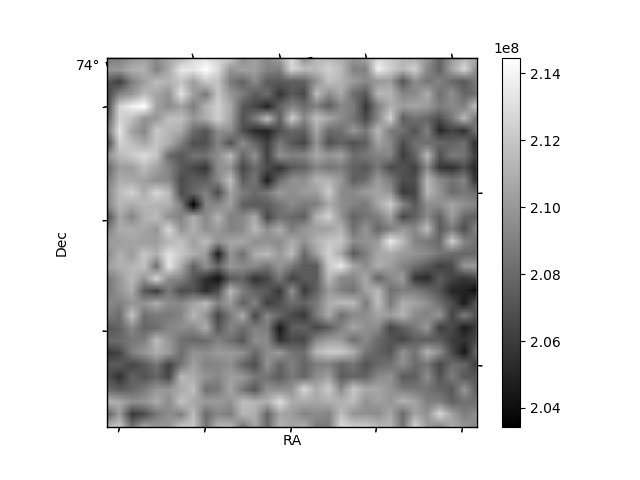
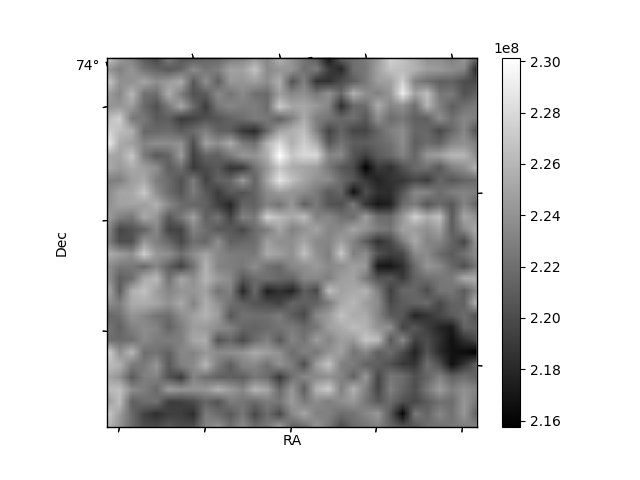
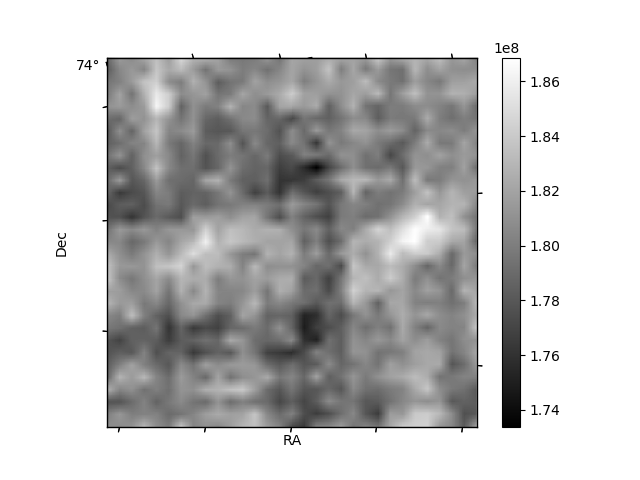
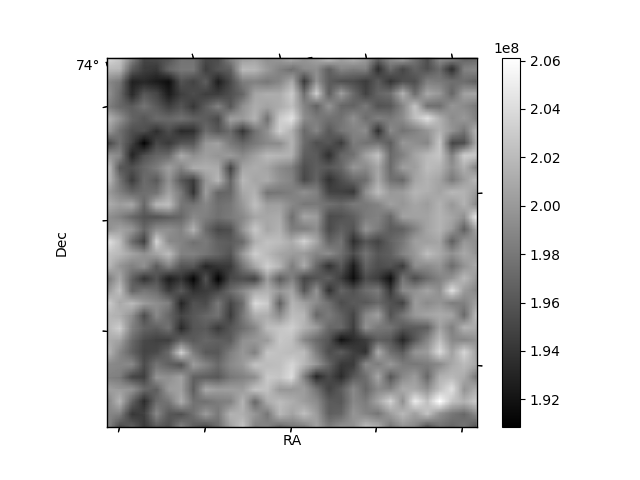
Histogram calculated using DETX and DETY for each event in the final _common_clean file
| Quadrant A | 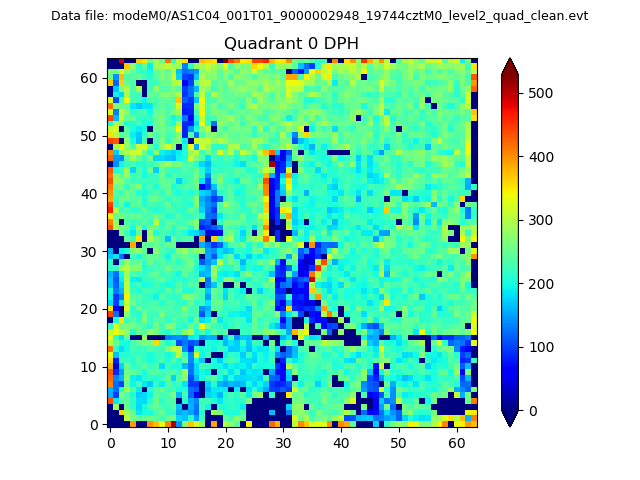 |
 |
Quadrant B |
|---|---|---|---|
| Quadrant D | 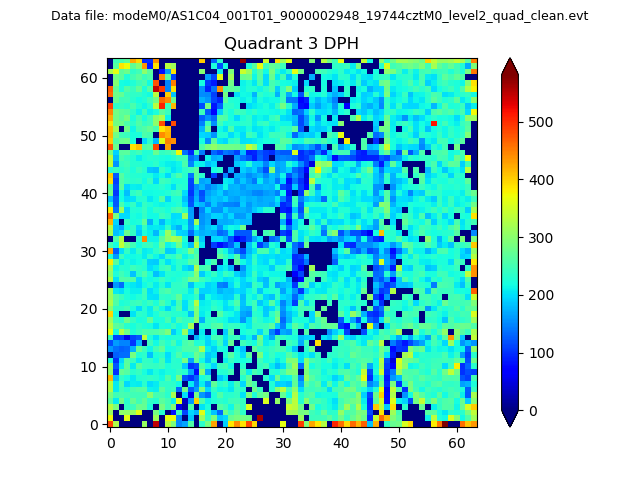 |
 |
Quadrant C |
| Plot type | Count rate plots | Images |
|---|---|---|
| Comparison with Poisson distribution Blue bars denote a histogram of data divided into 1 sec bins. Red curve is a Poisson curve with rate = median count rate of data. |
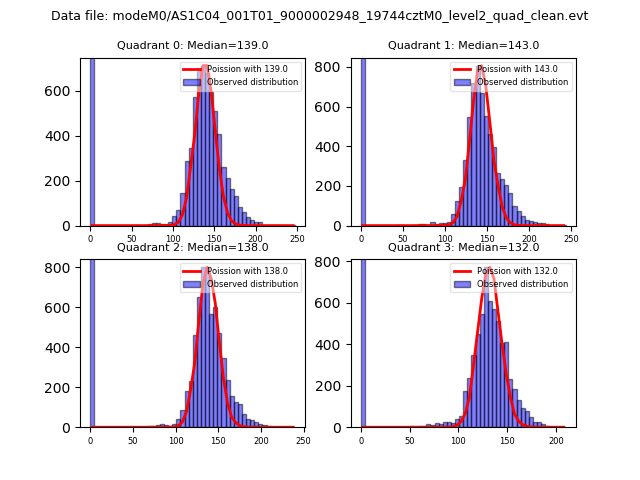 |
 |
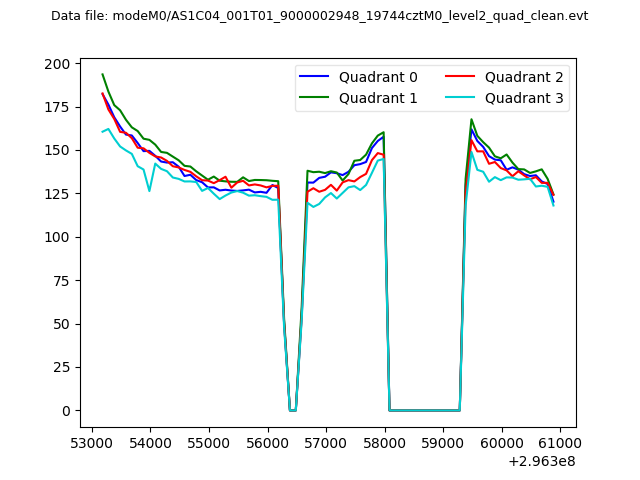
| Quadrant-wise count rates Data is divided into 100 sec bins |
 |
|
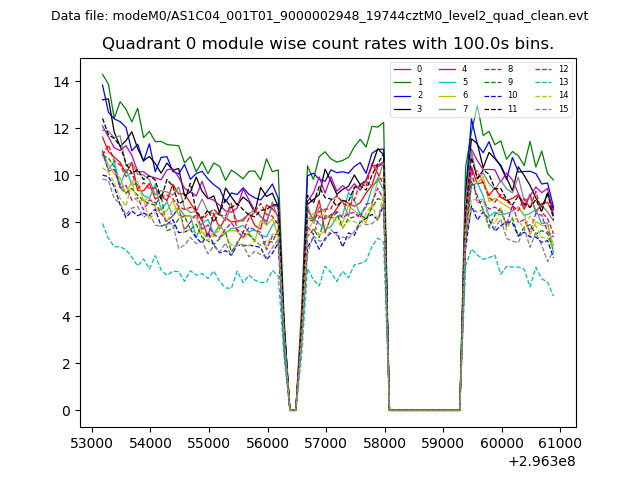
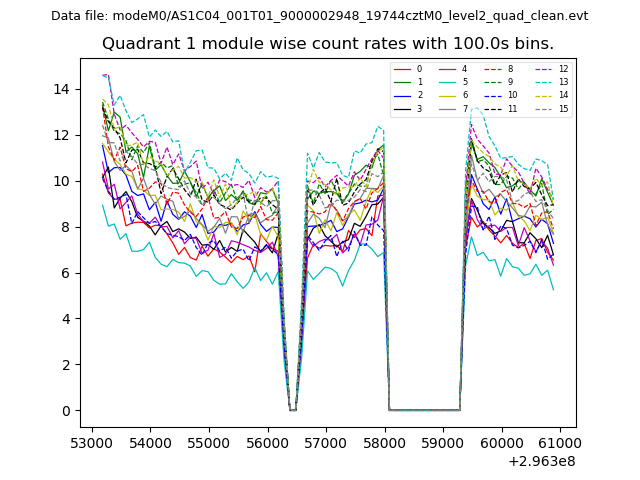
| Module-wise count rates for Quadrant A Data is divided into 100 sec bins |
 |
 |
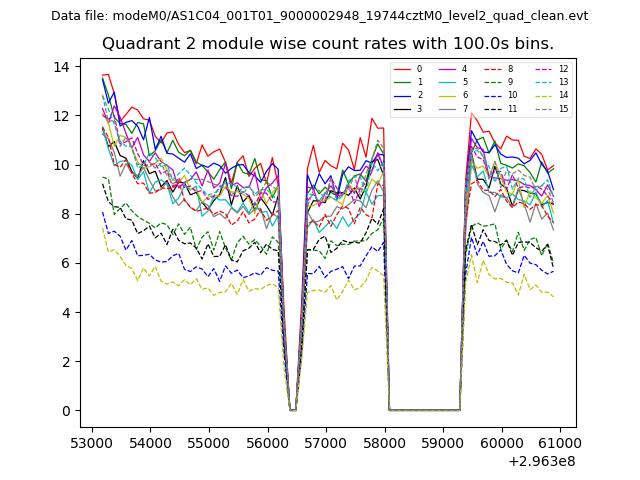
| Module-wise count rates for Quadrant B Data is divided into 100 sec bins |
 |
 |
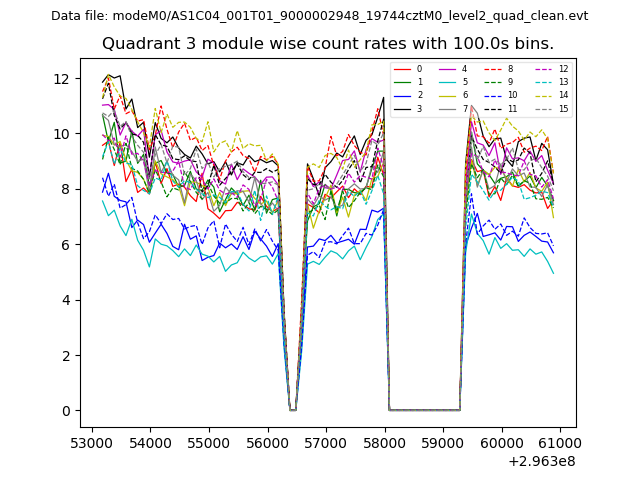
| Module-wise count rates for Quadrant C Data is divided into 100 sec bins |
 |
 |
| Module-wise count rates for Quadrant D Data is divided into 100 sec bins |
 |
 |
| Parameter | Plot |
|---|---|
| CZT HV Monitor | 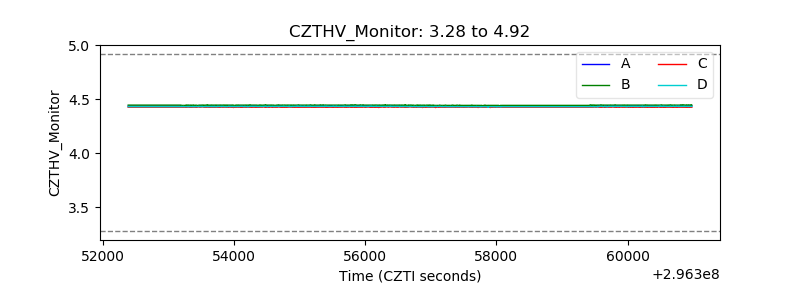 |
| D_VDD | 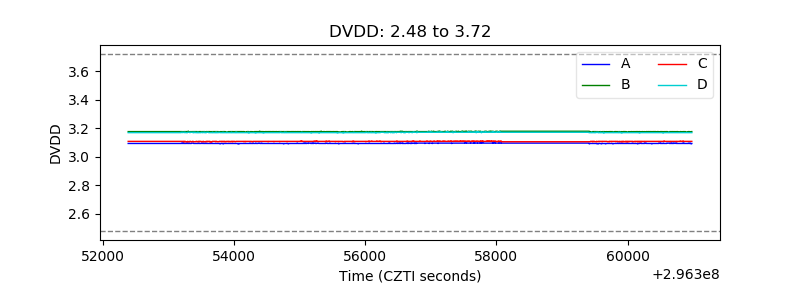 |
| Temperature 1 | 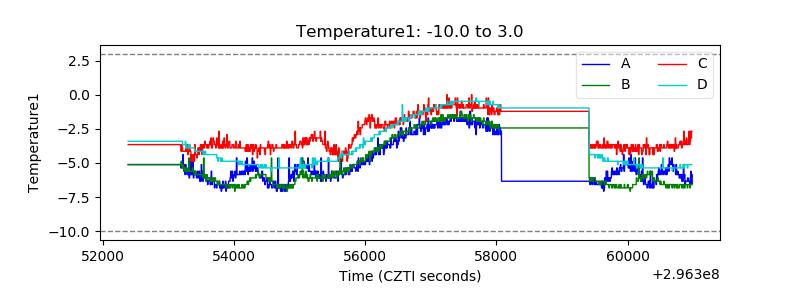 |
| Veto HV Monitor |  |
| Veto LLD | 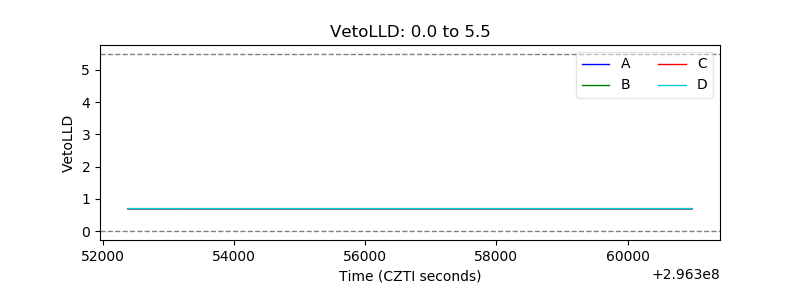 |
| Alpha Counter | 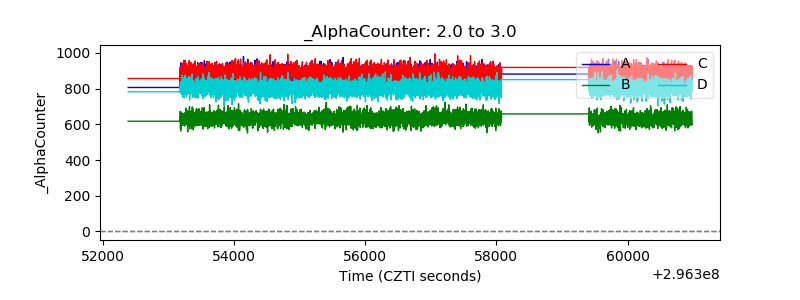 |
| _CPM_Rate | 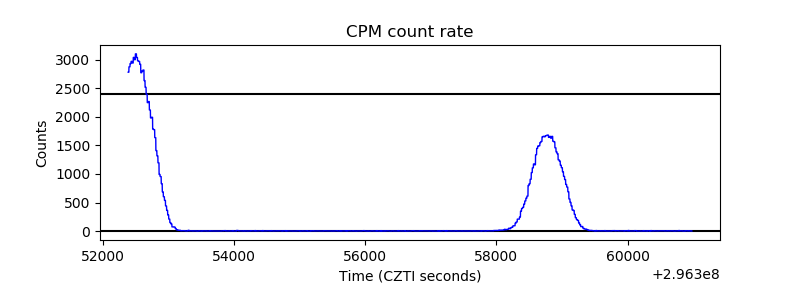 |
| CZT Counter | 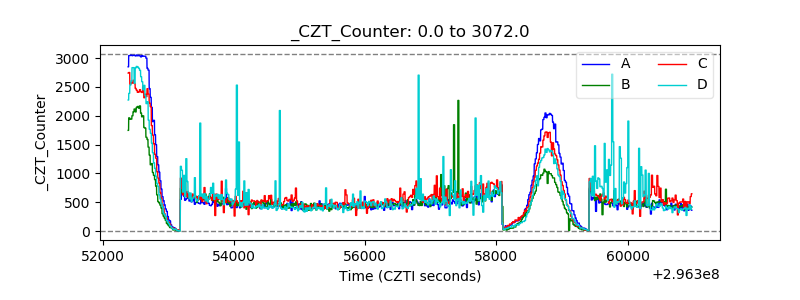 |
| +2.5 Volts monitor |  |
| +5 Volts monitor |  |
| _ROLL_ROT | 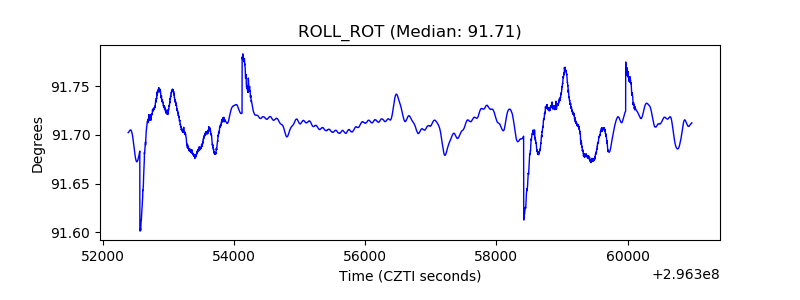 |
| _Roll_DEC | 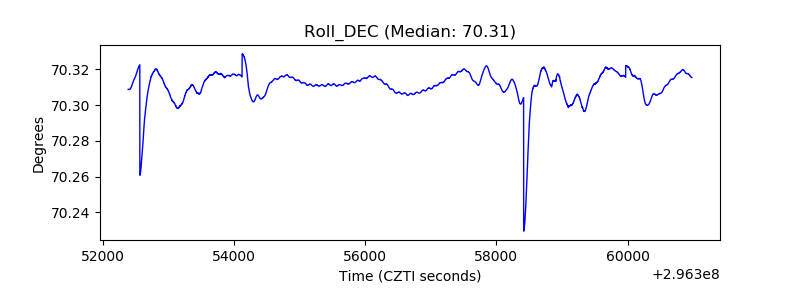 |
| _Roll_RA | 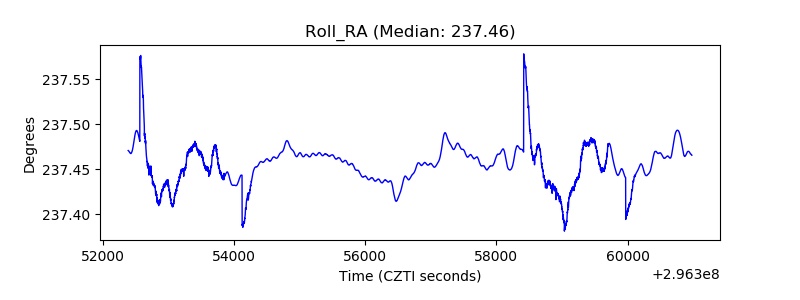 |
| Veto Counter | 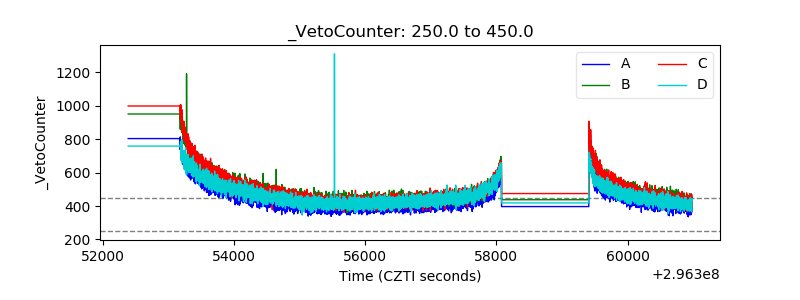 |