| Param | Original file | Final file |
|---|---|---|
| Filename | modeM0/AS1C04_001T01_9000002948_19745cztM0_level2.evt | modeM0/AS1C04_001T01_9000002948_19745cztM0_level2_quad_clean.evt |
| Size (bytes) | 495,907,200 | 127,068,480 |
| Size | 472.9 MB | 121.2 MB |
| Events in quadrant A | 3,097,220 | 858,673 |
| Events in quadrant B | 3,345,016 | 877,385 |
| Events in quadrant C | 4,487,397 | 828,586 |
| Events in quadrant D | 3,630,710 | 813,570 |
| Mode M9 | |||
|---|---|---|---|
| Quadrant | BADHDUFLAG | Total packets | Discarded packets |
| A | 0 | 11 | 0 |
| B | 0 | 12 | 0 |
| C | 0 | 12 | 0 |
| D | 0 | 12 | 0 |
| Mode SS | |||
|---|---|---|---|
| Quadrant | BADHDUFLAG | Total packets | Discarded packets |
| A | 0 | 136 | 0 |
| B | 0 | 136 | 0 |
| C | 0 | 136 | 0 |
| D | 0 | 136 | 0 |
| Mode M0 | |||
|---|---|---|---|
| Quadrant | BADHDUFLAG | Total packets | Discarded packets |
| A | 0 | 13798 | 2 |
| B | 0 | 14365 | 2 |
| C | 0 | 17652 | 2 |
| D | 0 | 15737 | 3 |
| Quadrant | Total seconds | Saturated seconds | Saturation percentage |
|---|---|---|---|
| A | 6752 | 27 | 0.399882% |
| B | 6752 | 79 | 1.170024% |
| C | 6752 | 344 | 5.094787% |
| D | 6751 | 83 | 1.229447% |
Noise dominated data is calculated using 1-second bins in cleaned event files. If a bin has >2000 counts, and if more than 50% of those come from <1% of pixels, then it is considered to be noise-dominated and hence unusable.
| Quadrant | # 1 sec bins | Bins with >0 counts | Bins with >2000 counts | High rate bins dominated by noise | Noise dominated (total time) | Noise dominated (detector-on time) | Marked lightcurve |
|---|---|---|---|---|---|---|---|
| A | 7867 | 6753 | 0 | 0 | 0.00% | 0.00% |  |
| B | 7867 | 6753 | 16 | 16 | 0.20% | 0.24% |  |
| C | 7867 | 6753 | 123 | 123 | 1.56% | 1.82% |  |
| D | 7866 | 6752 | 67 | 67 | 0.85% | 0.99% |  |
Top three noisy pixels from each quadrant. If the there are fewer than three noisy pixels in the level2.evt file, extra rows are filled as -1
| Pixel properties | Quadrant properties | ||||||
|---|---|---|---|---|---|---|---|
| Quadrant | DetID | PixID | Counts | Sigma | Mean | Median | Sigma |
| A | 11 | 29 | 14733 | 87.75 | 800 | 783 | 159.0 |
| A | 0 | 226 | 6951 | 38.8 | 800 | 783 | 159.0 |
| A | 13 | 254 | 6092 | 33.4 | 800 | 783 | 159.0 |
| B | 7 | 220 | 124747 | 815.95 | 806 | 785 | 151.9 |
| B | 4 | 216 | 27957 | 178.85 | 806 | 785 | 151.9 |
| B | 0 | 214 | 17757 | 111.71 | 806 | 785 | 151.9 |
| C | 3 | 233 | 1326163 | 7530.85 | 761 | 765 | 176.0 |
| C | 14 | 238 | 121485 | 685.93 | 761 | 765 | 176.0 |
| C | 7 | 247 | 73166 | 411.38 | 761 | 765 | 176.0 |
| D | 1 | 52 | 514889 | 2807.2 | 766 | 744 | 183.2 |
| D | 7 | 238 | 119019 | 645.77 | 766 | 744 | 183.2 |
| D | 2 | 234 | 36817 | 196.95 | 766 | 744 | 183.2 |
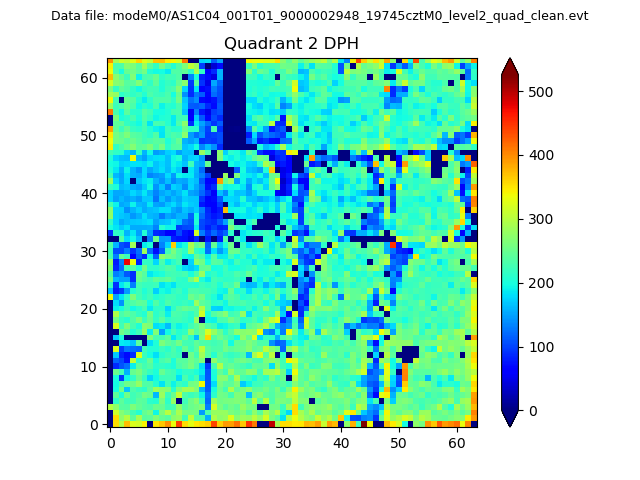
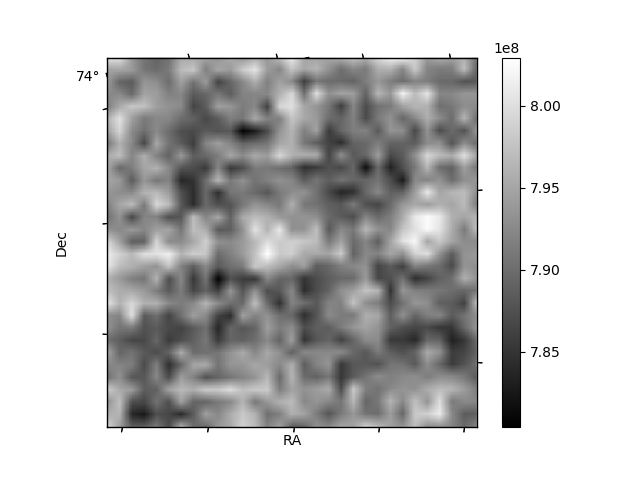
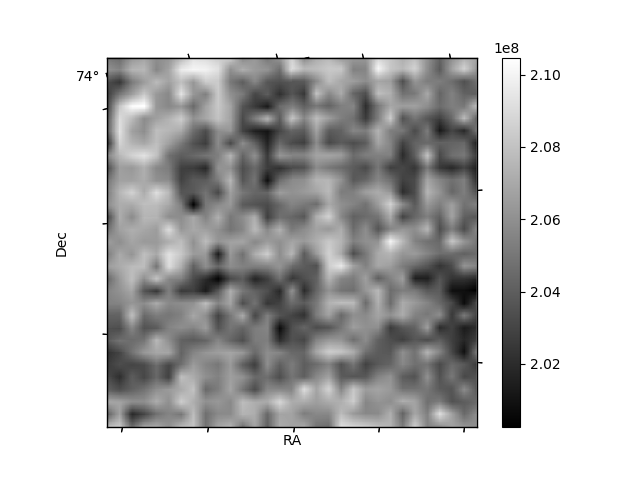
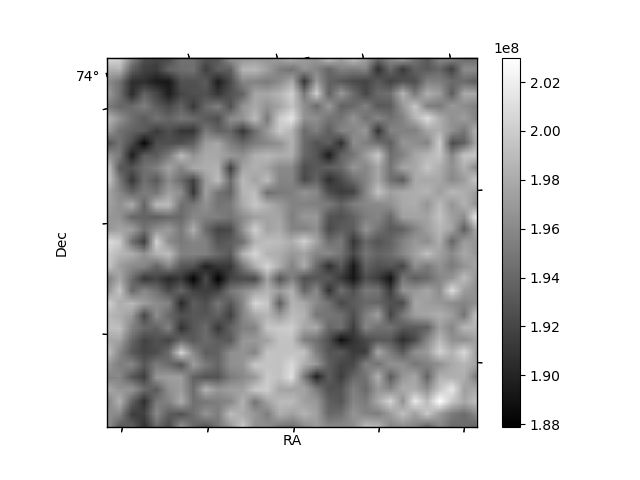
Histogram calculated using DETX and DETY for each event in the final _common_clean file
| Quadrant A | 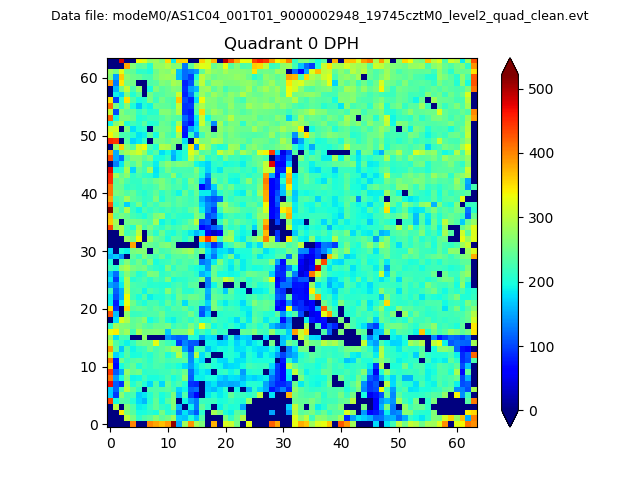 |
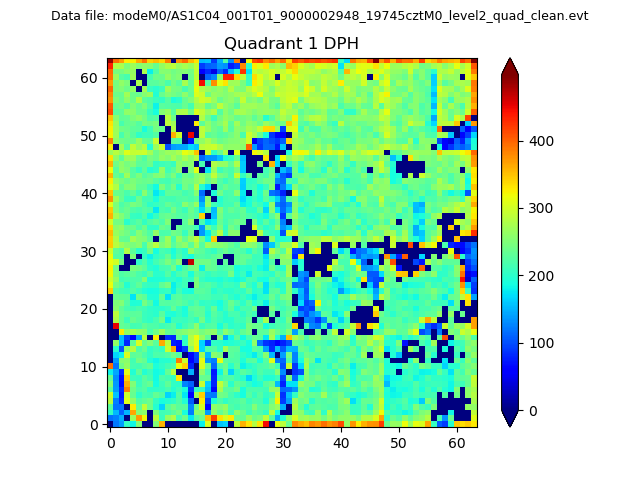 |
Quadrant B |
|---|---|---|---|
| Quadrant D | 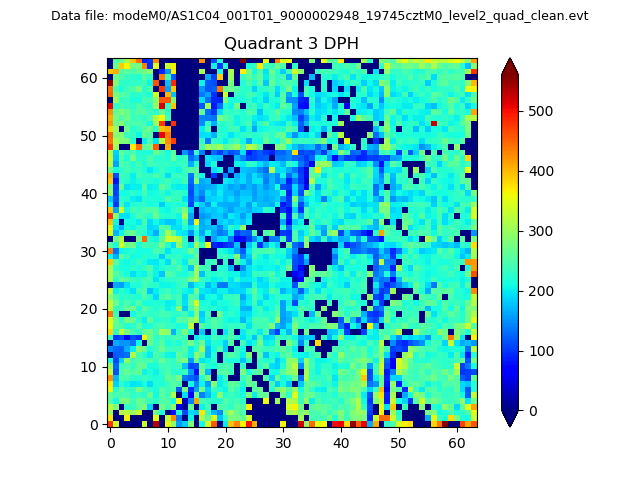 |
 |
Quadrant C |
| Plot type | Count rate plots | Images |
|---|---|---|
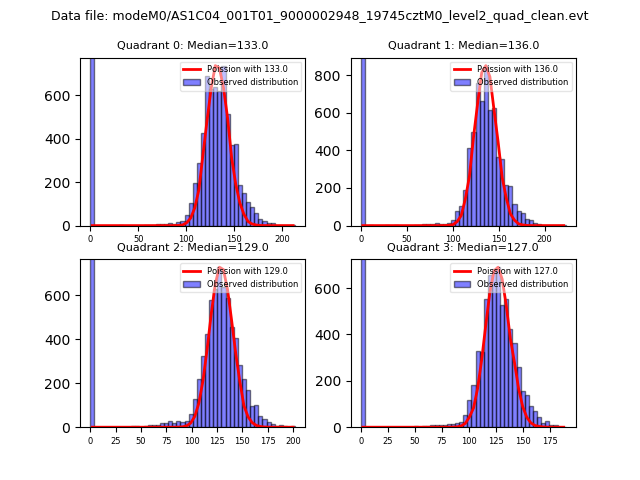
| Comparison with Poisson distribution Blue bars denote a histogram of data divided into 1 sec bins. Red curve is a Poisson curve with rate = median count rate of data. |
 |
 |
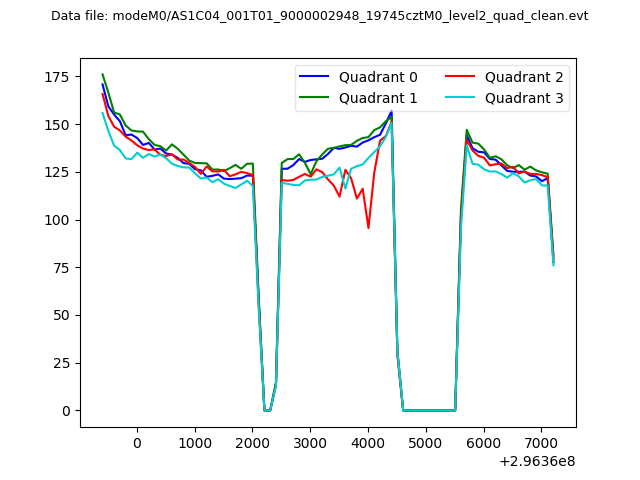
| Quadrant-wise count rates Data is divided into 100 sec bins |
 |
|
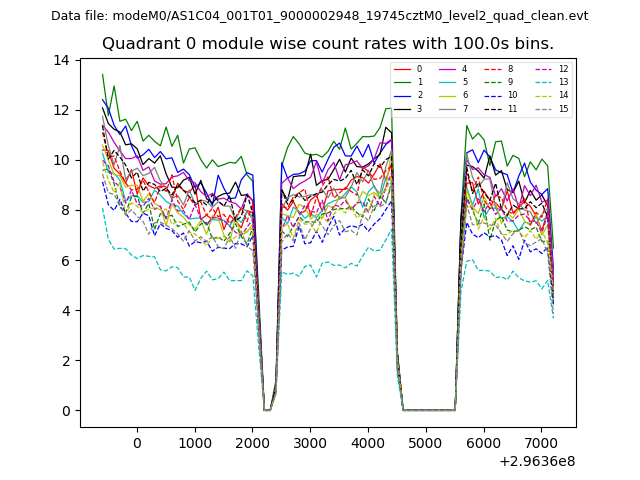
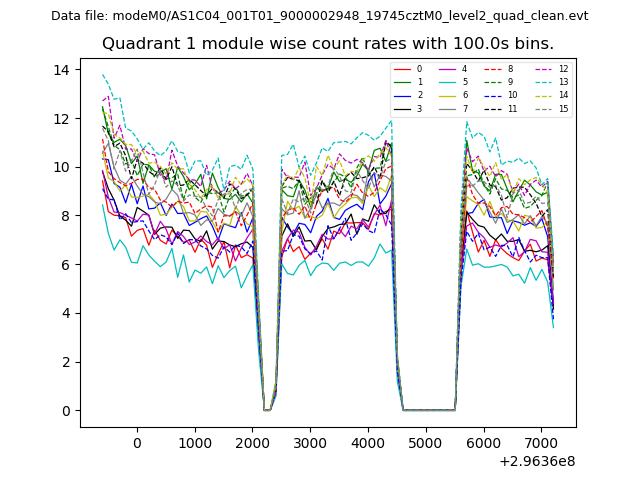
| Module-wise count rates for Quadrant A Data is divided into 100 sec bins |
 |
 |
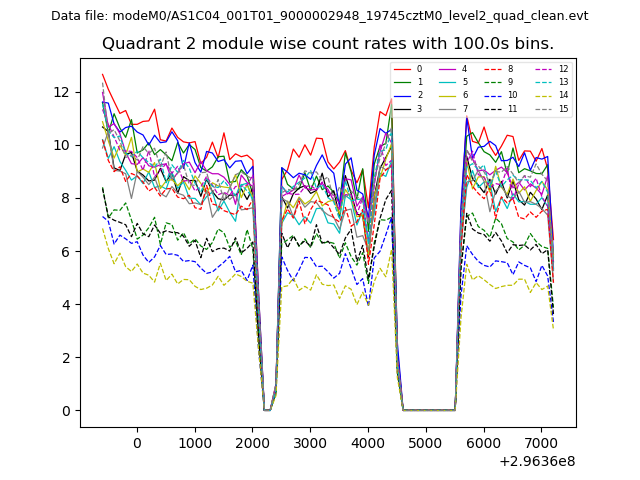
| Module-wise count rates for Quadrant B Data is divided into 100 sec bins |
 |
 |
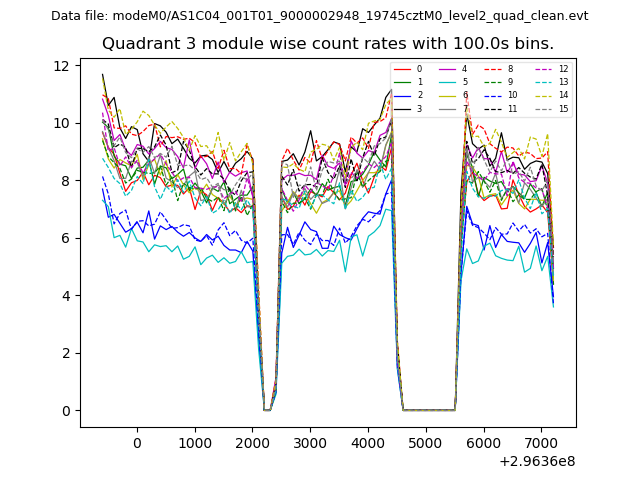
| Module-wise count rates for Quadrant C Data is divided into 100 sec bins |
 |
 |
| Module-wise count rates for Quadrant D Data is divided into 100 sec bins |
 |
 |
| Parameter | Plot |
|---|---|
| CZT HV Monitor | 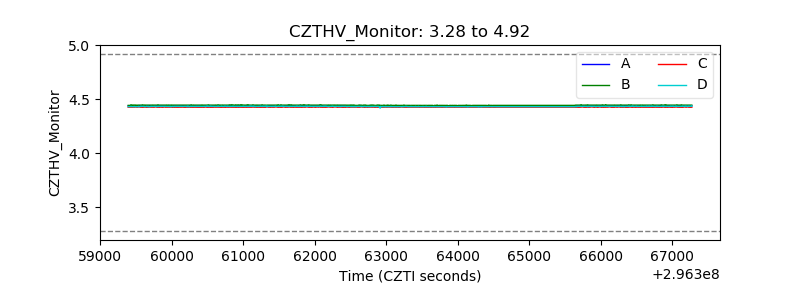 |
| D_VDD | 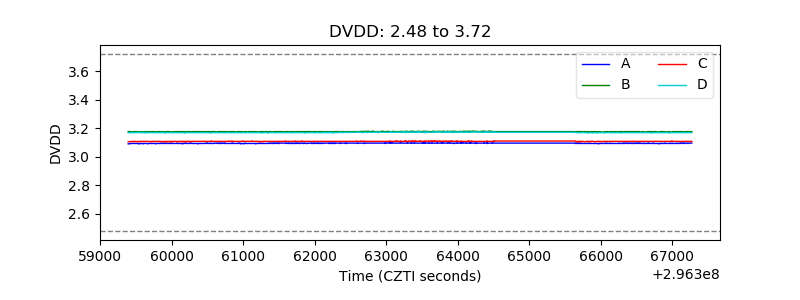 |
| Temperature 1 | 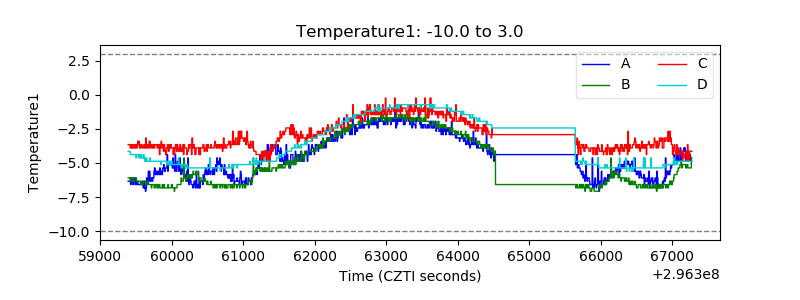 |
| Veto HV Monitor | 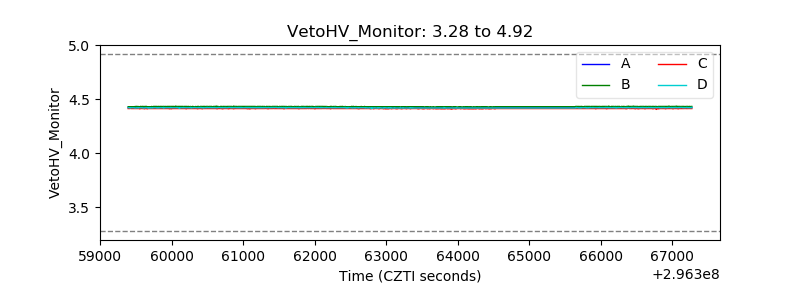 |
| Veto LLD | 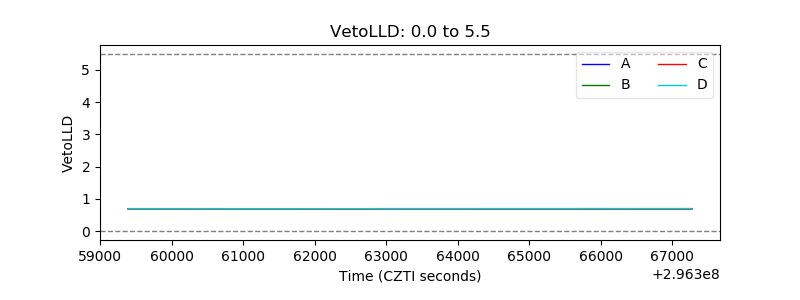 |
| Alpha Counter | 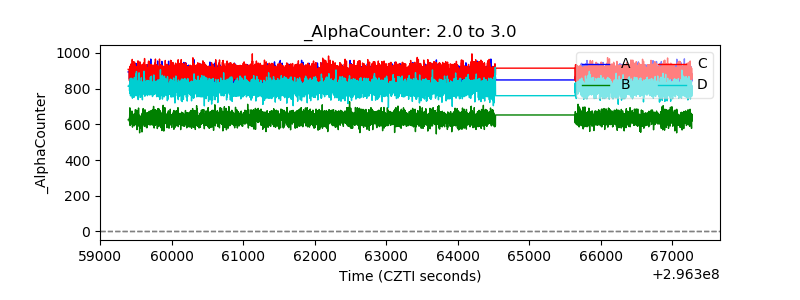 |
| _CPM_Rate | 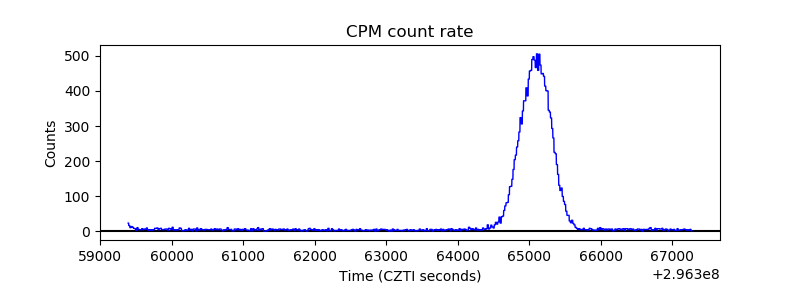 |
| CZT Counter | 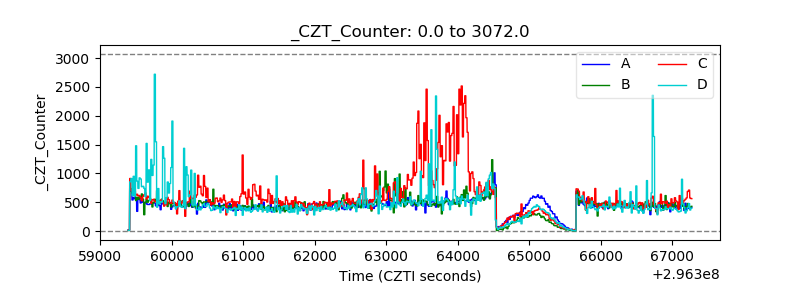 |
| +2.5 Volts monitor |  |
| +5 Volts monitor |  |
| _ROLL_ROT | 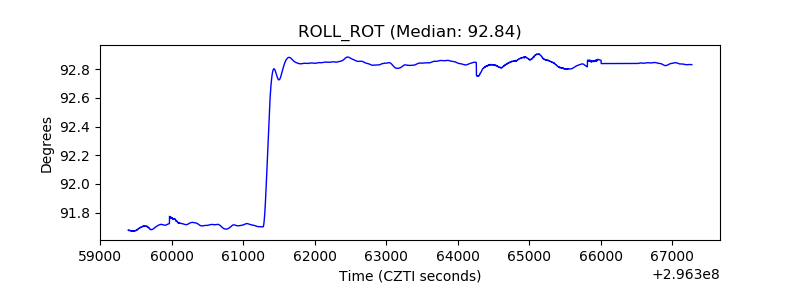 |
| _Roll_DEC | 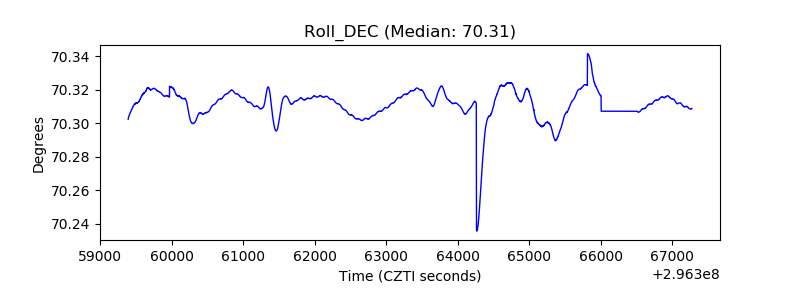 |
| _Roll_RA | 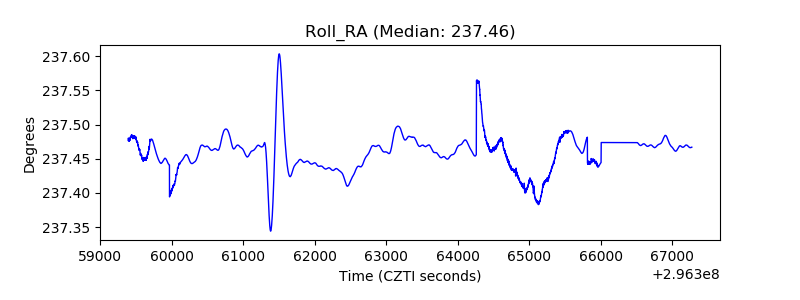 |
| Veto Counter | 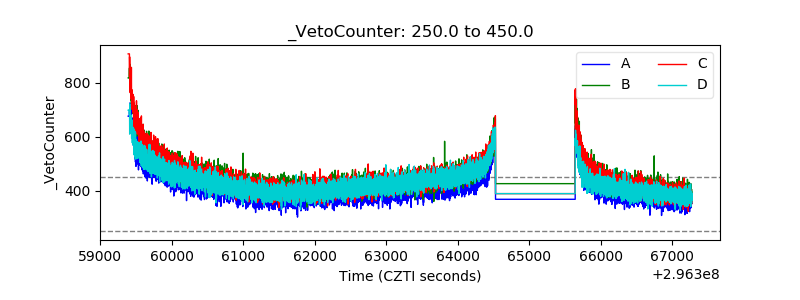 |