| Param | Original file | Final file |
|---|---|---|
| Filename | modeM0/AS1C04_001T01_9000002948_19746cztM0_level2.evt | modeM0/AS1C04_001T01_9000002948_19746cztM0_level2_quad_clean.evt |
| Size (bytes) | 524,689,920 | 108,803,520 |
| Size | 500.4 MB | 103.8 MB |
| Events in quadrant A | 2,791,490 | 734,030 |
| Events in quadrant B | 2,908,004 | 751,548 |
| Events in quadrant C | 6,736,727 | 668,020 |
| Events in quadrant D | 3,032,908 | 708,116 |
| Mode M9 | |||
|---|---|---|---|
| Quadrant | BADHDUFLAG | Total packets | Discarded packets |
| A | 0 | 7 | 0 |
| B | 0 | 7 | 0 |
| C | 0 | 7 | 0 |
| D | 0 | 7 | 0 |
| Mode SS | |||
|---|---|---|---|
| Quadrant | BADHDUFLAG | Total packets | Discarded packets |
| A | 0 | 126 | 0 |
| B | 0 | 126 | 0 |
| C | 0 | 126 | 0 |
| D | 0 | 126 | 0 |
| Mode M0 | |||
|---|---|---|---|
| Quadrant | BADHDUFLAG | Total packets | Discarded packets |
| A | 0 | 12594 | 2 |
| B | 0 | 12871 | 1 |
| C | 0 | 24302 | 1 |
| D | 0 | 13492 | 1 |
| Quadrant | Total seconds | Saturated seconds | Saturation percentage |
|---|---|---|---|
| A | 6204 | 59 | 0.950999% |
| B | 6205 | 87 | 1.402095% |
| C | 6205 | 1212 | 19.532635% |
| D | 6205 | 50 | 0.805802% |
Noise dominated data is calculated using 1-second bins in cleaned event files. If a bin has >2000 counts, and if more than 50% of those come from <1% of pixels, then it is considered to be noise-dominated and hence unusable.
| Quadrant | # 1 sec bins | Bins with >0 counts | Bins with >2000 counts | High rate bins dominated by noise | Noise dominated (total time) | Noise dominated (detector-on time) | Marked lightcurve |
|---|---|---|---|---|---|---|---|
| A | 6924 | 6205 | 0 | 0 | 0.00% | 0.00% | 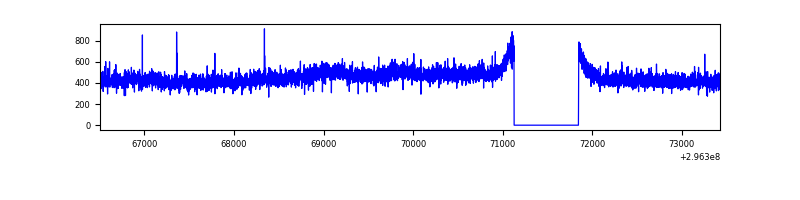 |
| B | 6925 | 6206 | 2 | 2 | 0.03% | 0.03% | 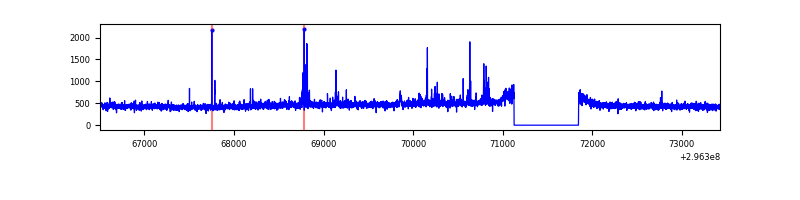 |
| C | 6925 | 6206 | 729 | 729 | 10.53% | 11.75% | 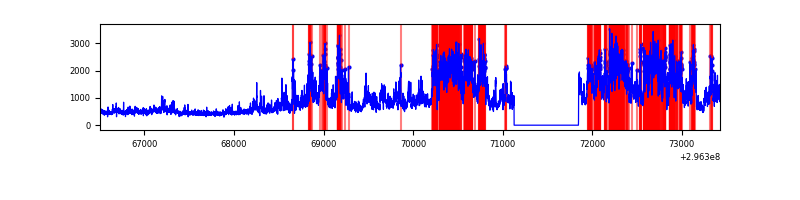 |
| D | 6925 | 6206 | 33 | 33 | 0.48% | 0.53% | 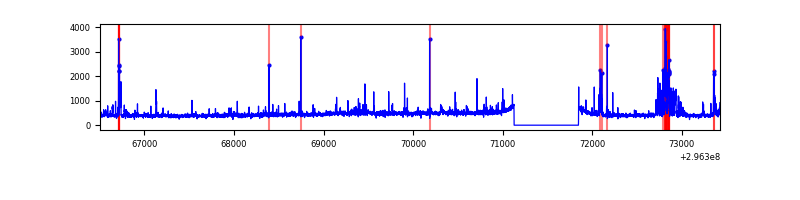 |
Top three noisy pixels from each quadrant. If the there are fewer than three noisy pixels in the level2.evt file, extra rows are filled as -1
| Pixel properties | Quadrant properties | ||||||
|---|---|---|---|---|---|---|---|
| Quadrant | DetID | PixID | Counts | Sigma | Mean | Median | Sigma |
| A | 11 | 29 | 34094 | 233.45 | 716 | 701 | 143.0 |
| A | 0 | 226 | 6192 | 38.39 | 716 | 701 | 143.0 |
| A | 3 | 137 | 5605 | 34.28 | 716 | 701 | 143.0 |
| B | 0 | 197 | 34384 | 247.73 | 719 | 699 | 136.0 |
| B | 7 | 220 | 25733 | 184.11 | 719 | 699 | 136.0 |
| B | 12 | 111 | 16294 | 114.69 | 719 | 699 | 136.0 |
| C | 3 | 233 | 4026883 | 26585.47 | 654 | 658 | 151.4 |
| C | 14 | 238 | 104030 | 682.57 | 654 | 658 | 151.4 |
| C | 7 | 247 | 52176 | 340.18 | 654 | 658 | 151.4 |
| D | 1 | 52 | 314044 | 1878.69 | 694 | 672 | 166.8 |
| D | 5 | 32 | 28959 | 169.58 | 694 | 672 | 166.8 |
| D | 2 | 234 | 26787 | 156.56 | 694 | 672 | 166.8 |
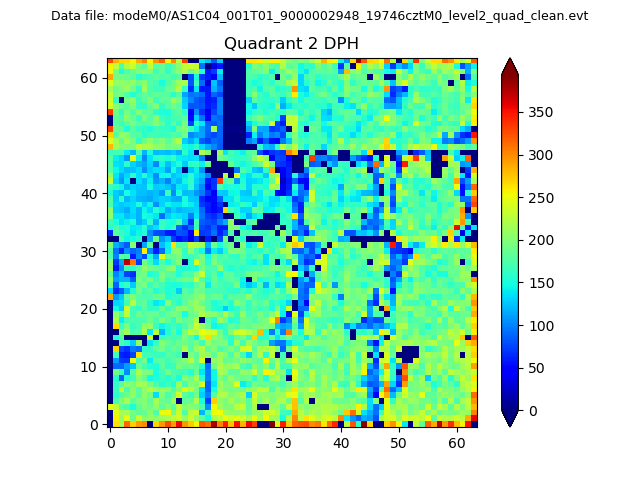
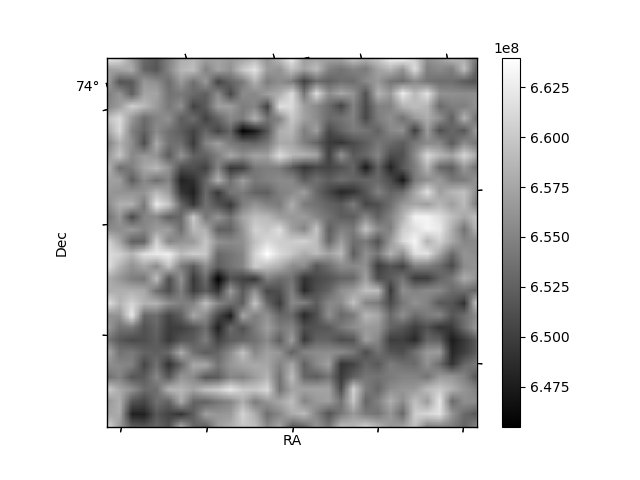
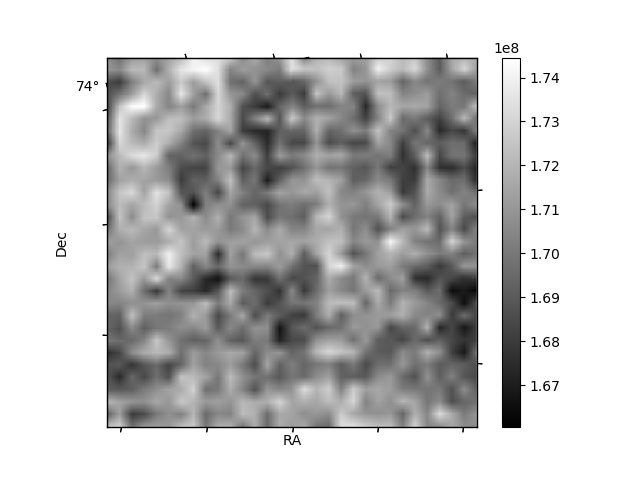
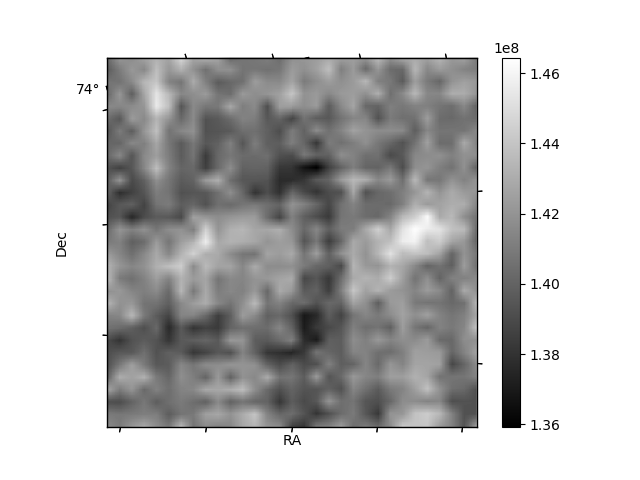
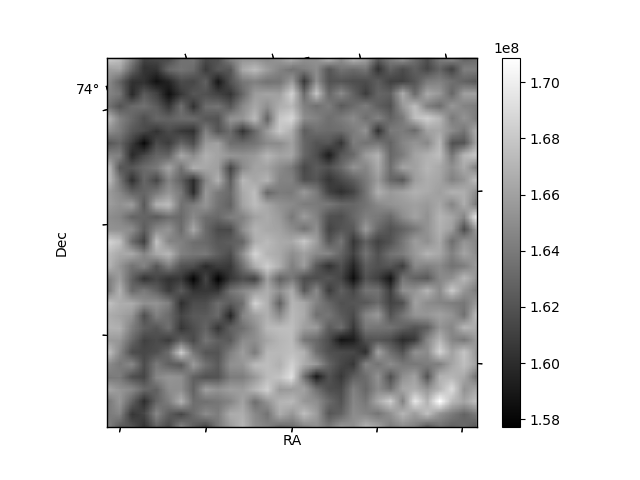
Histogram calculated using DETX and DETY for each event in the final _common_clean file
| Quadrant A | 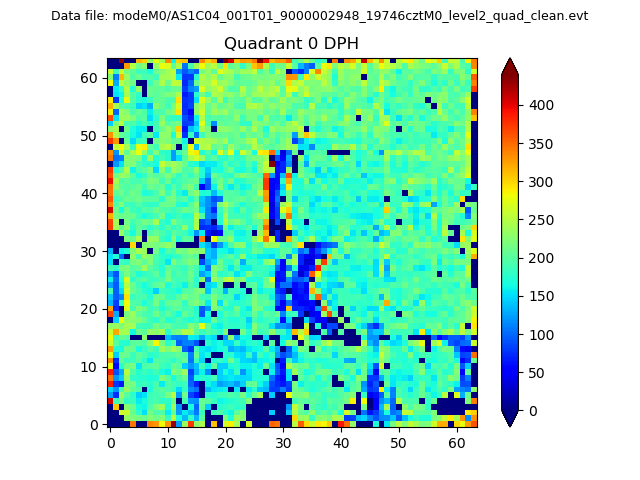 |
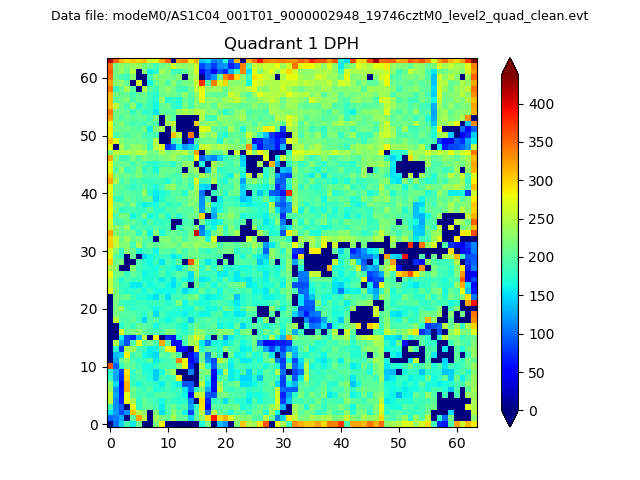 |
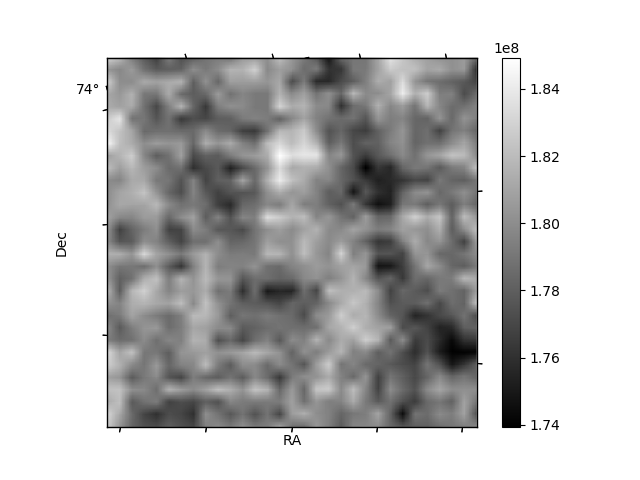
Quadrant B |
|---|---|---|---|
| Quadrant D | 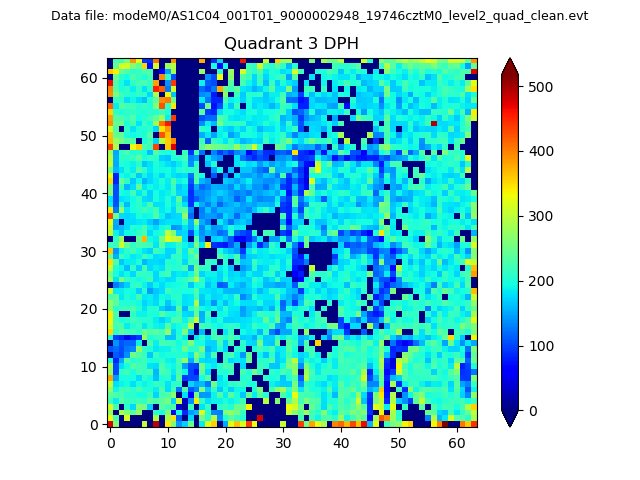 |
 |
Quadrant C |
| Plot type | Count rate plots | Images |
|---|---|---|
| Comparison with Poisson distribution Blue bars denote a histogram of data divided into 1 sec bins. Red curve is a Poisson curve with rate = median count rate of data. |
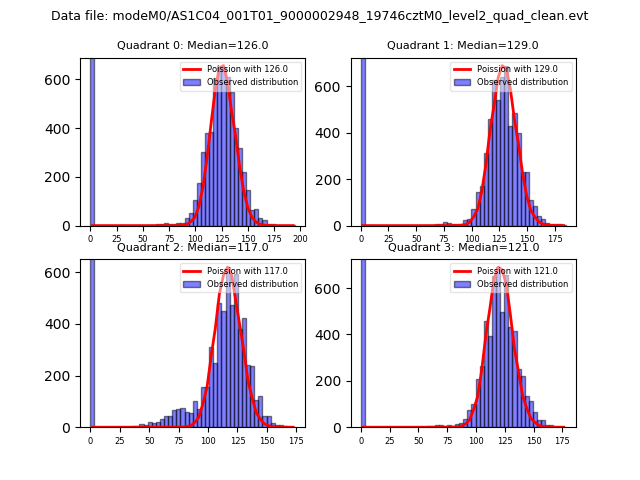 |
 |
| Quadrant-wise count rates Data is divided into 100 sec bins |
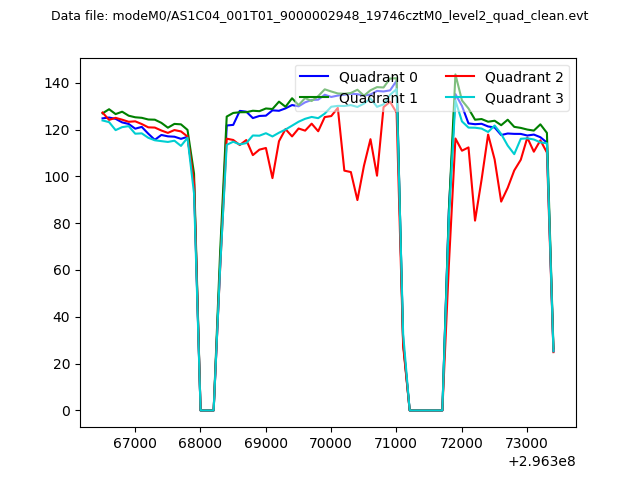 |
|
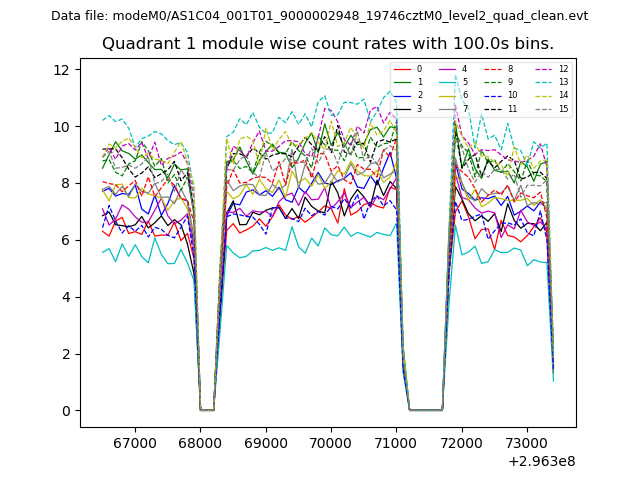
| Module-wise count rates for Quadrant A Data is divided into 100 sec bins |
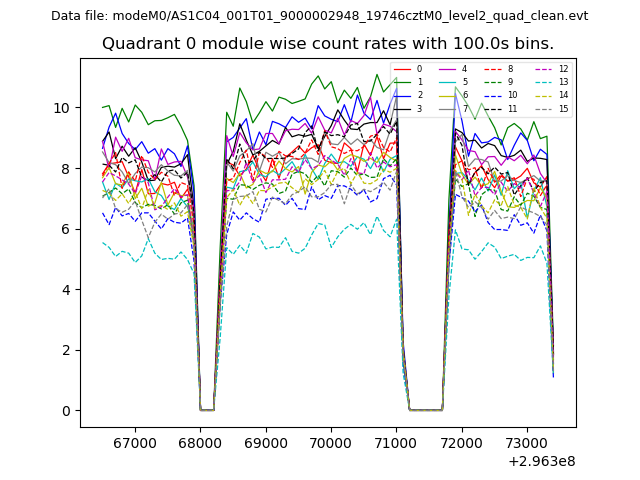 |
 |
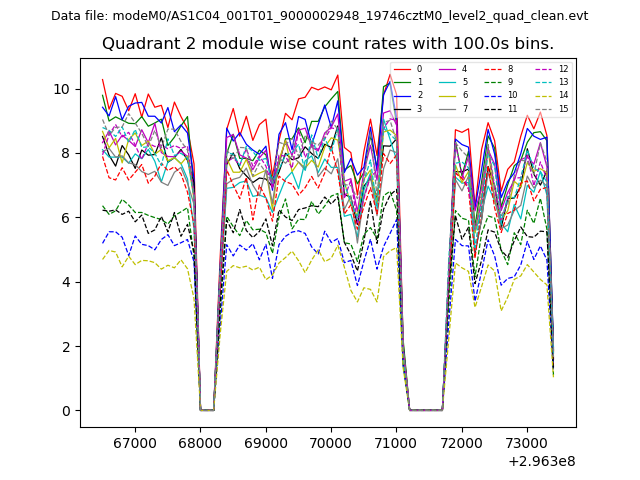
| Module-wise count rates for Quadrant B Data is divided into 100 sec bins |
 |
 |
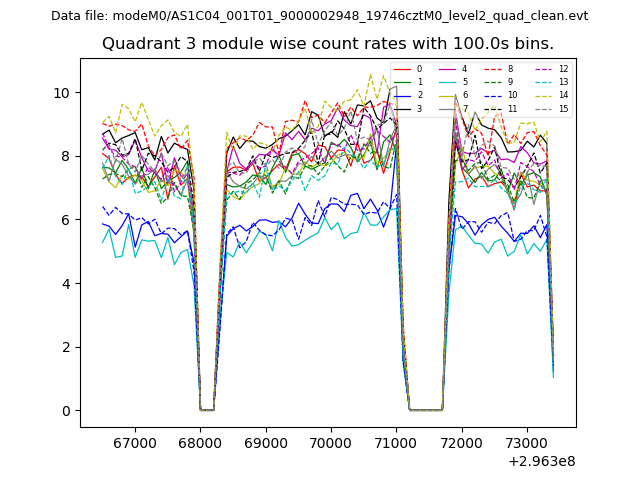
| Module-wise count rates for Quadrant C Data is divided into 100 sec bins |
 |
 |
| Module-wise count rates for Quadrant D Data is divided into 100 sec bins |
 |
 |
| Parameter | Plot |
|---|---|
| CZT HV Monitor | 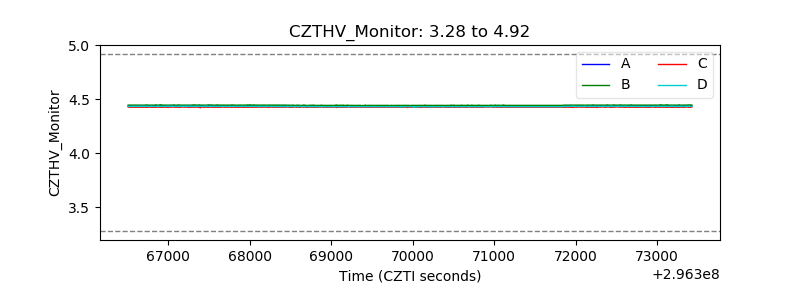 |
| D_VDD | 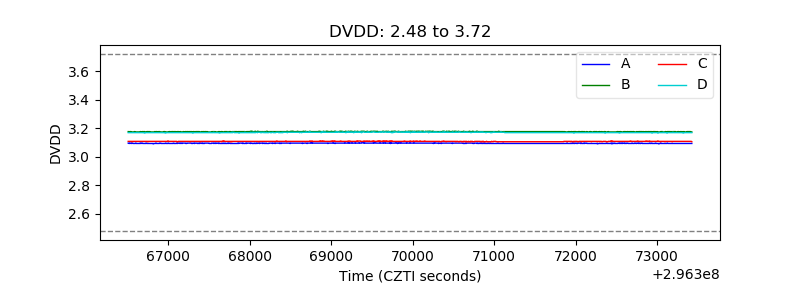 |
| Temperature 1 | 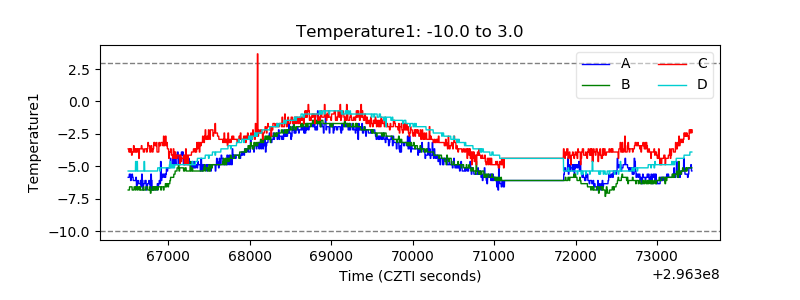 |
| Veto HV Monitor | 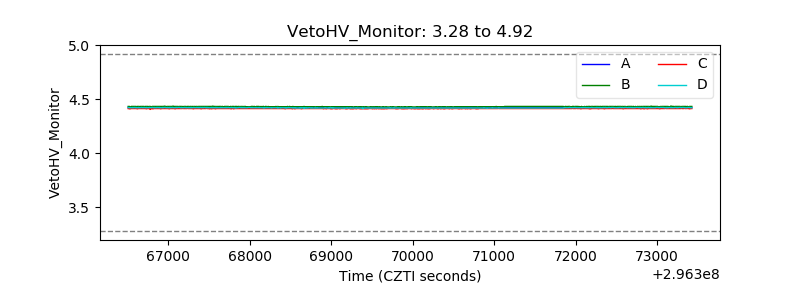 |
| Veto LLD | 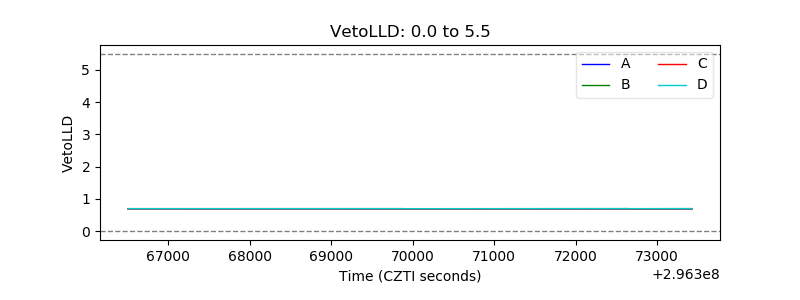 |
| Alpha Counter | 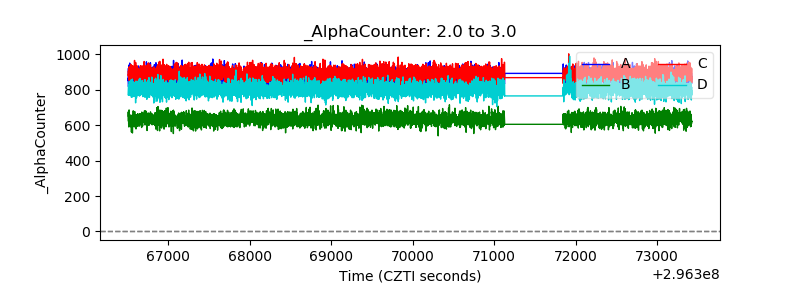 |
| _CPM_Rate | 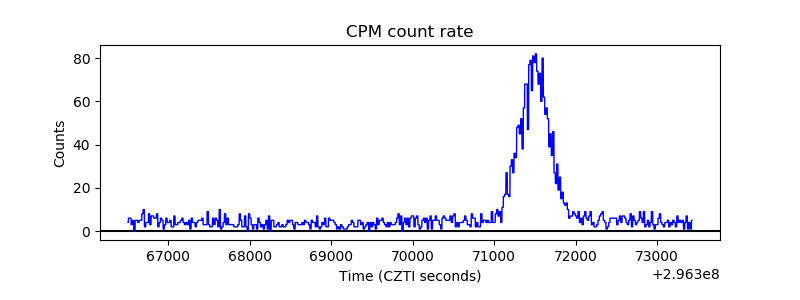 |
| CZT Counter | 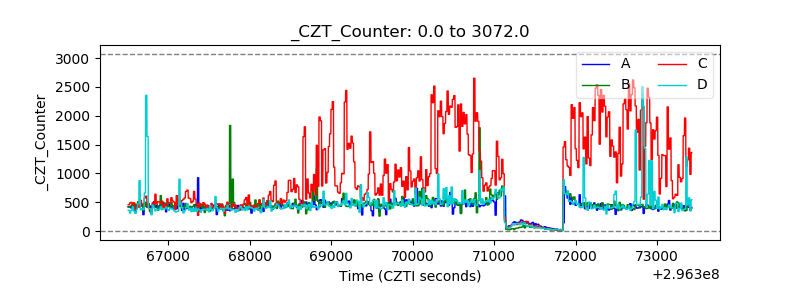 |
| +2.5 Volts monitor |  |
| +5 Volts monitor |  |
| _ROLL_ROT | 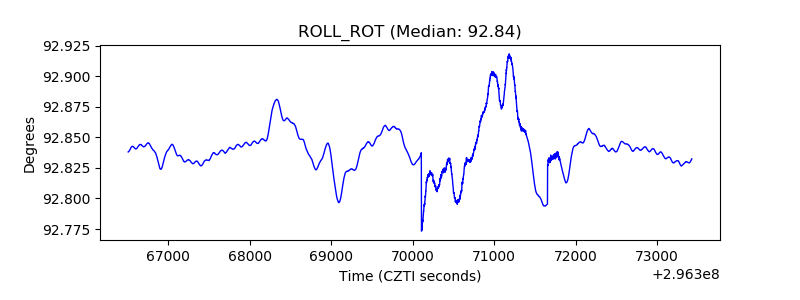 |
| _Roll_DEC | 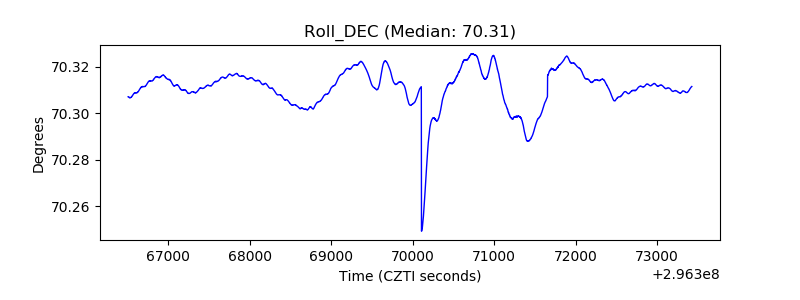 |
| _Roll_RA | 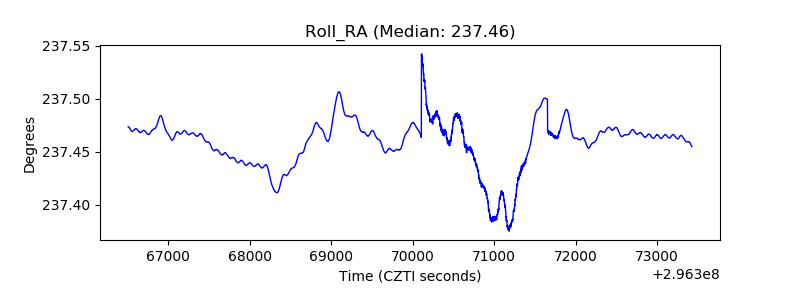 |
| Veto Counter | 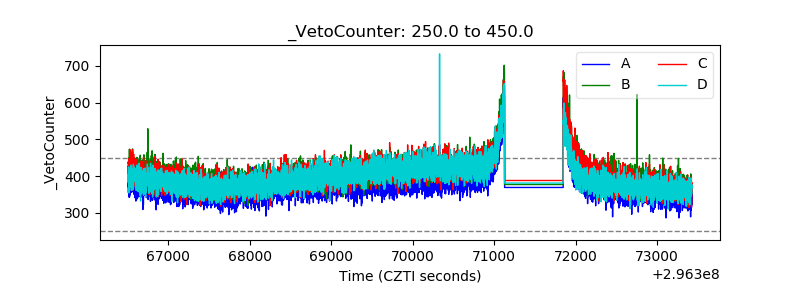 |