| Param | Original file | Final file |
|---|---|---|
| Filename | modeM0/AS1C04_001T01_9000002948_19747cztM0_level2.evt | modeM0/AS1C04_001T01_9000002948_19747cztM0_level2_quad_clean.evt |
| Size (bytes) | 649,621,440 | 119,073,600 |
| Size | 619.5 MB | 113.6 MB |
| Events in quadrant A | 5,230,174 | 751,012 |
| Events in quadrant B | 3,374,149 | 829,506 |
| Events in quadrant C | 6,084,428 | 772,385 |
| Events in quadrant D | 4,510,082 | 764,175 |
| Mode M9 | |||
|---|---|---|---|
| Quadrant | BADHDUFLAG | Total packets | Discarded packets |
| A | 0 | 2 | 0 |
| B | 0 | 2 | 0 |
| C | 0 | 2 | 0 |
| D | 0 | 2 | 0 |
| Mode SS | |||
|---|---|---|---|
| Quadrant | BADHDUFLAG | Total packets | Discarded packets |
| A | 0 | 144 | 0 |
| B | 0 | 144 | 0 |
| C | 0 | 144 | 0 |
| D | 0 | 144 | 0 |
| Mode M0 | |||
|---|---|---|---|
| Quadrant | BADHDUFLAG | Total packets | Discarded packets |
| A | 0 | 20471 | 1 |
| B | 0 | 14781 | 1 |
| C | 0 | 22841 | 1 |
| D | 0 | 18373 | 1 |
| Quadrant | Total seconds | Saturated seconds | Saturation percentage |
|---|---|---|---|
| A | 7004 | 1025 | 14.634495% |
| B | 7005 | 171 | 2.441113% |
| C | 7005 | 634 | 9.050678% |
| D | 7005 | 395 | 5.638829% |
Noise dominated data is calculated using 1-second bins in cleaned event files. If a bin has >2000 counts, and if more than 50% of those come from <1% of pixels, then it is considered to be noise-dominated and hence unusable.
| Quadrant | # 1 sec bins | Bins with >0 counts | Bins with >2000 counts | High rate bins dominated by noise | Noise dominated (total time) | Noise dominated (detector-on time) | Marked lightcurve |
|---|---|---|---|---|---|---|---|
| A | 7249 | 7004 | 750 | 750 | 10.35% | 10.71% | 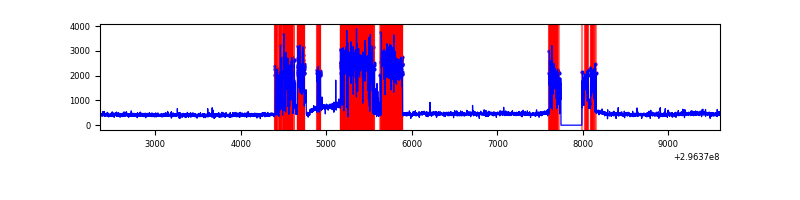 |
| B | 7250 | 7006 | 10 | 10 | 0.14% | 0.14% | 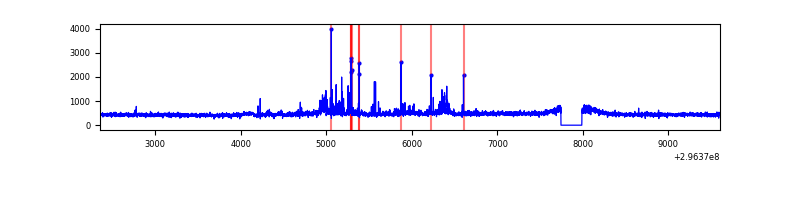 |
| C | 7250 | 7006 | 331 | 331 | 4.57% | 4.72% | 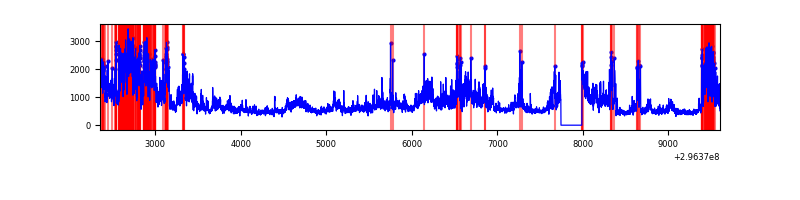 |
| D | 7250 | 7006 | 201 | 201 | 2.77% | 2.87% | 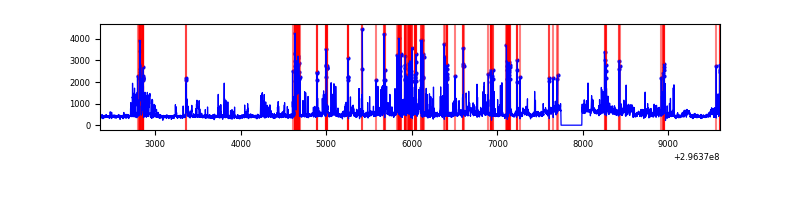 |
Top three noisy pixels from each quadrant. If the there are fewer than three noisy pixels in the level2.evt file, extra rows are filled as -1
| Pixel properties | Quadrant properties | ||||||
|---|---|---|---|---|---|---|---|
| Quadrant | DetID | PixID | Counts | Sigma | Mean | Median | Sigma |
| A | 0 | 23 | 2170952 | 14237.97 | 755 | 738 | 152.4 |
| A | 0 | 226 | 138018 | 900.64 | 755 | 738 | 152.4 |
| A | 12 | 16 | 14570 | 90.75 | 755 | 738 | 152.4 |
| B | 7 | 220 | 125093 | 806.43 | 808 | 785 | 154.1 |
| B | 4 | 216 | 30949 | 195.68 | 808 | 785 | 154.1 |
| B | 0 | 197 | 29007 | 183.08 | 808 | 785 | 154.1 |
| C | 3 | 233 | 2916490 | 16530.16 | 759 | 762 | 176.4 |
| C | 14 | 238 | 118674 | 668.48 | 759 | 762 | 176.4 |
| C | 7 | 220 | 44772 | 249.51 | 759 | 762 | 176.4 |
| D | 1 | 52 | 1300855 | 7003.32 | 766 | 742 | 185.6 |
| D | 7 | 238 | 142995 | 766.27 | 766 | 742 | 185.6 |
| D | 10 | 230 | 93326 | 498.72 | 766 | 742 | 185.6 |
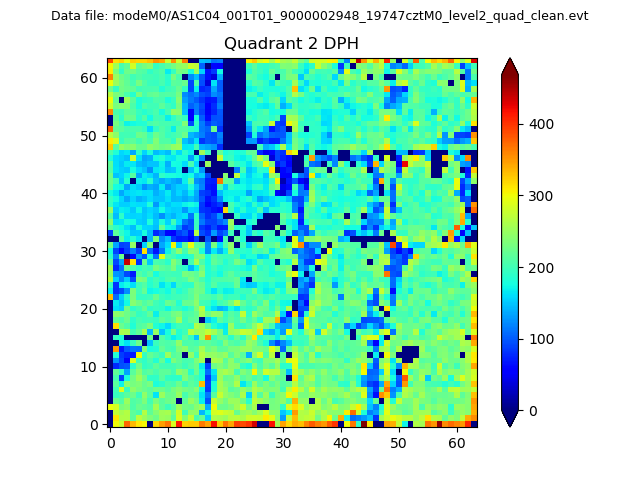
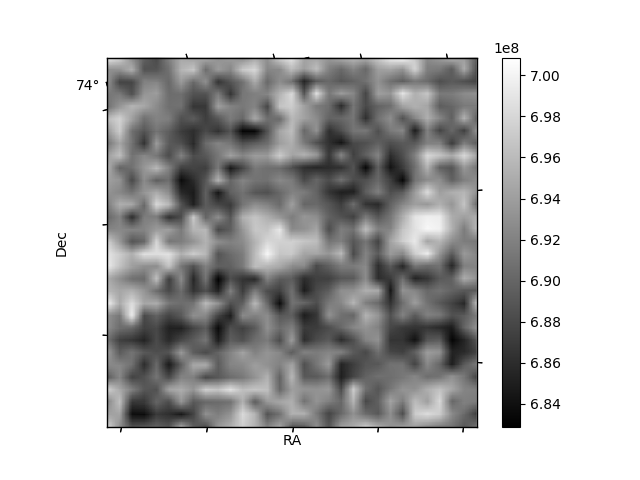
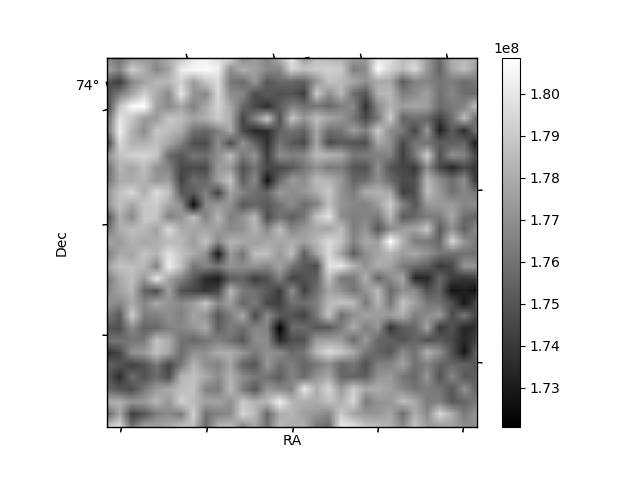
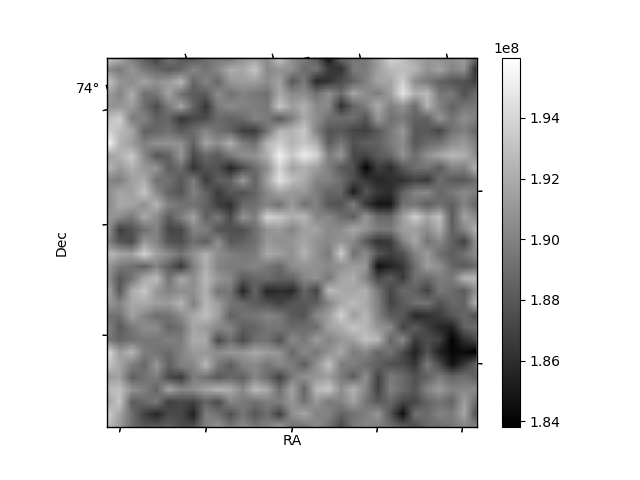
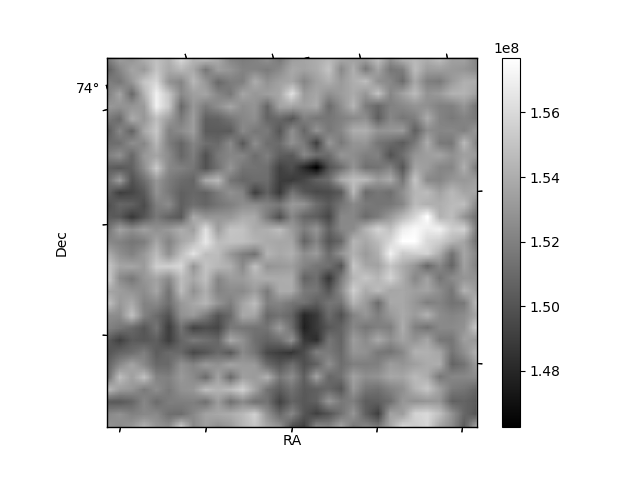
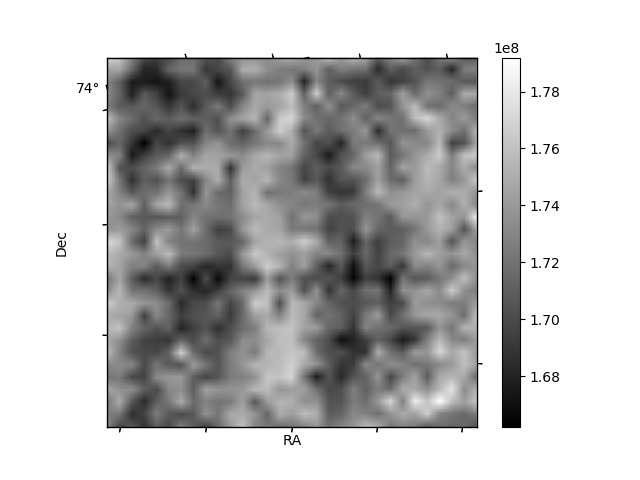
Histogram calculated using DETX and DETY for each event in the final _common_clean file
| Quadrant A | 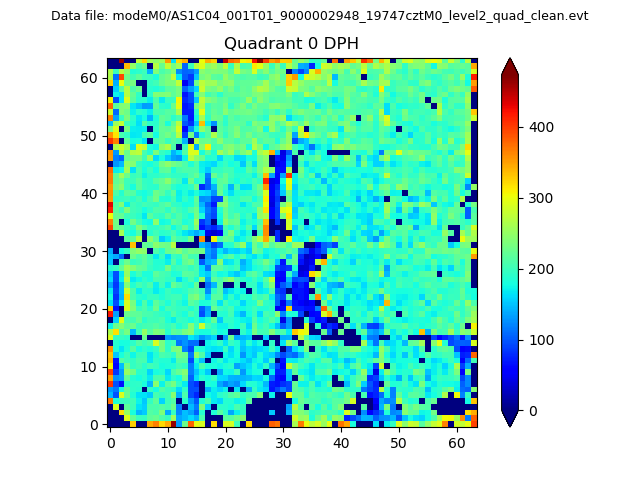 |
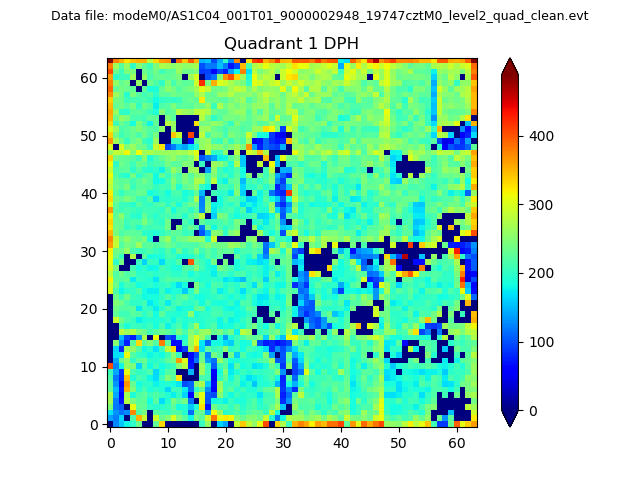 |
Quadrant B |
|---|---|---|---|
| Quadrant D | 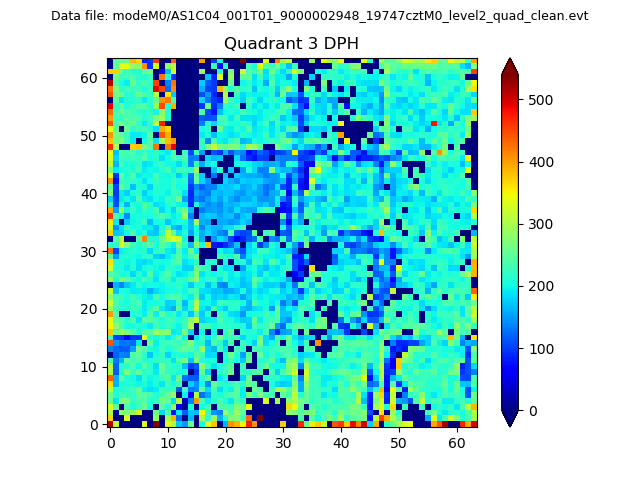 |
 |
Quadrant C |
| Plot type | Count rate plots | Images |
|---|---|---|
| Comparison with Poisson distribution Blue bars denote a histogram of data divided into 1 sec bins. Red curve is a Poisson curve with rate = median count rate of data. |
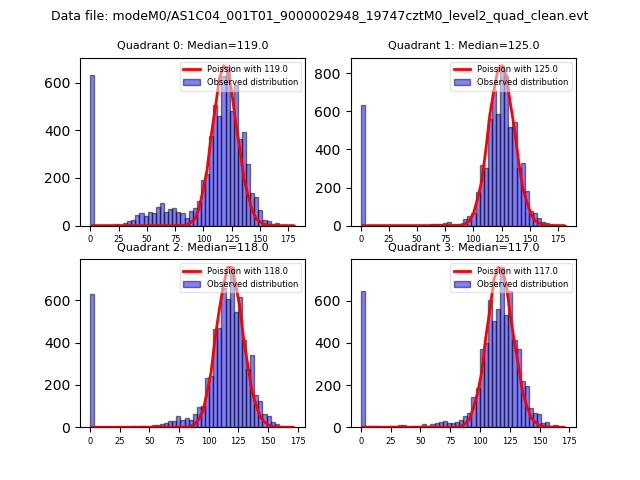 |
 |
| Quadrant-wise count rates Data is divided into 100 sec bins |
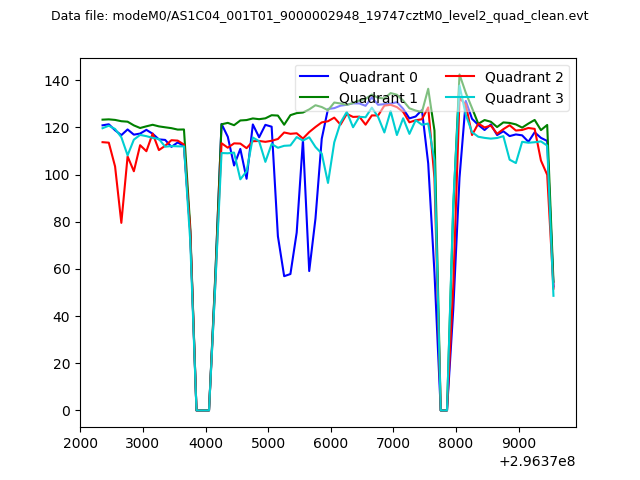 |
|
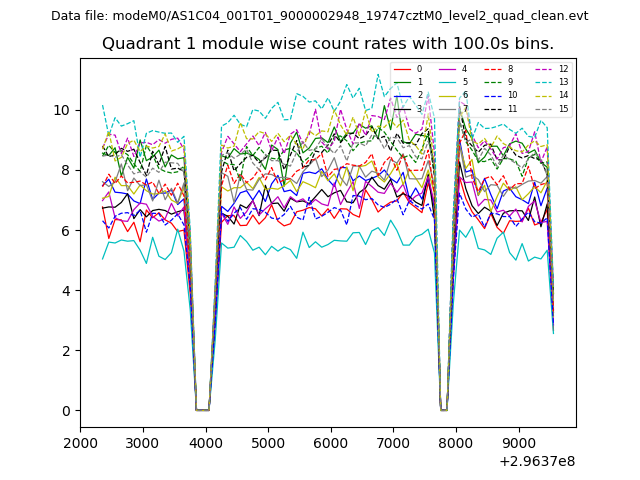
| Module-wise count rates for Quadrant A Data is divided into 100 sec bins |
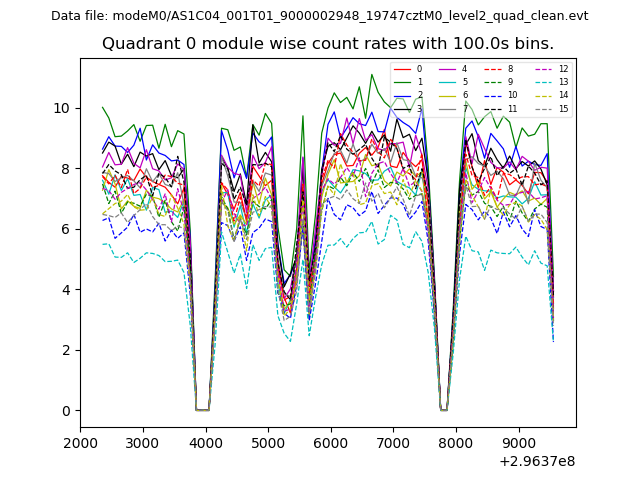 |
 |
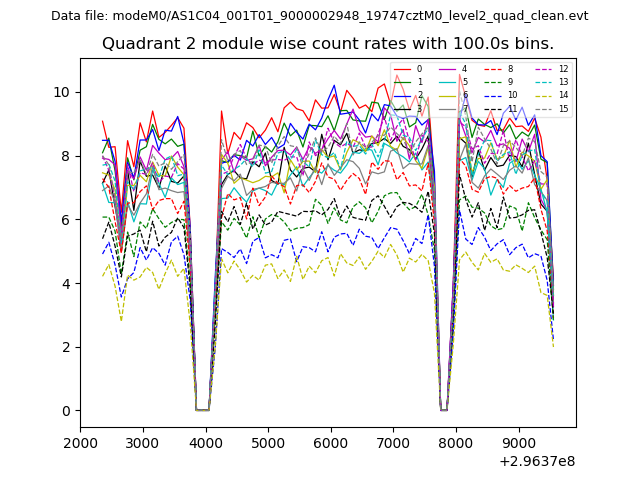
| Module-wise count rates for Quadrant B Data is divided into 100 sec bins |
 |
 |
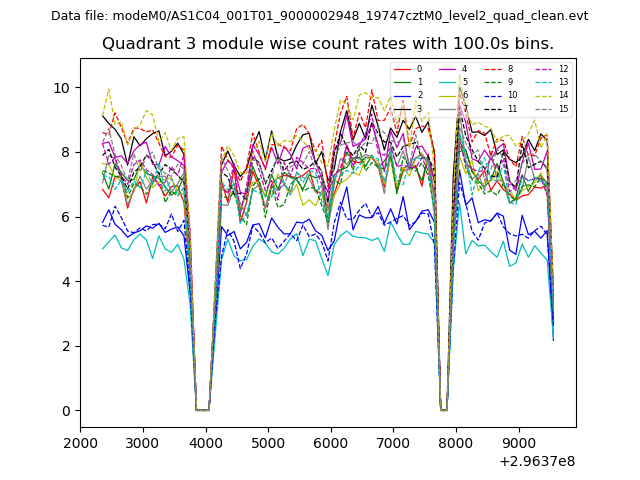
| Module-wise count rates for Quadrant C Data is divided into 100 sec bins |
 |
 |
| Module-wise count rates for Quadrant D Data is divided into 100 sec bins |
 |
 |
| Parameter | Plot |
|---|---|
| CZT HV Monitor | 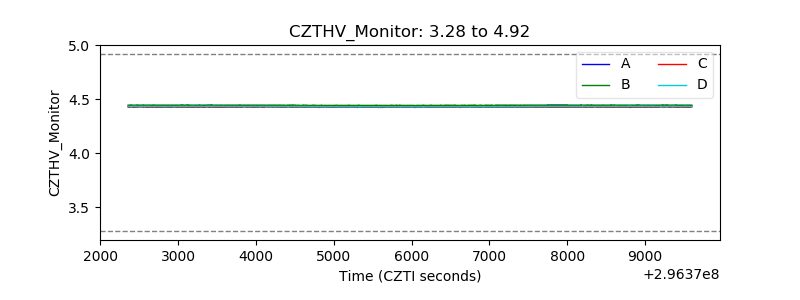 |
| D_VDD | 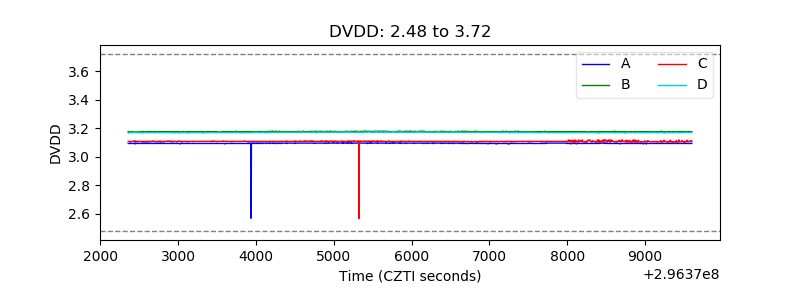 |
| Temperature 1 | 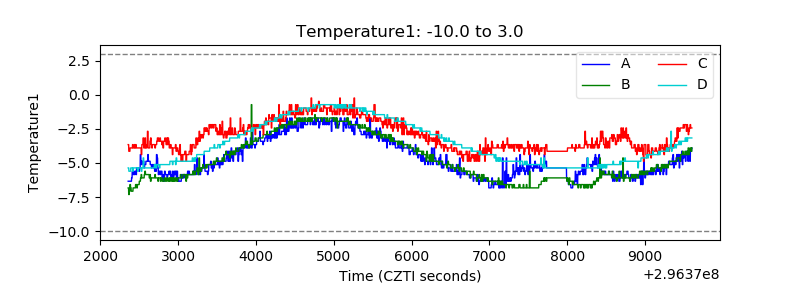 |
| Veto HV Monitor | 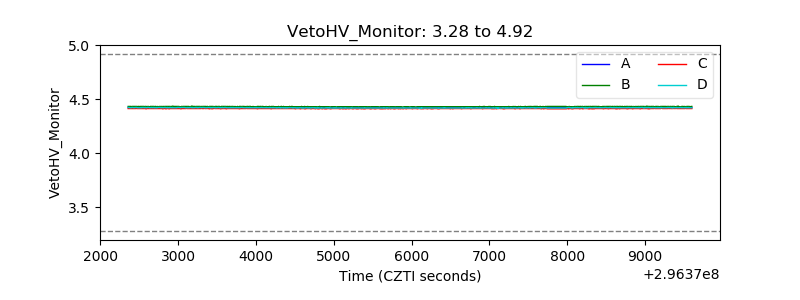 |
| Veto LLD | 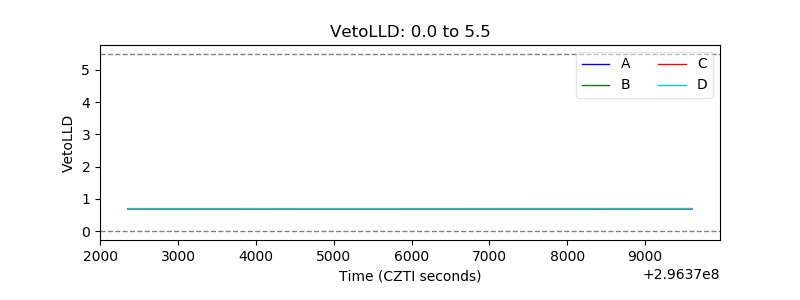 |
| Alpha Counter | 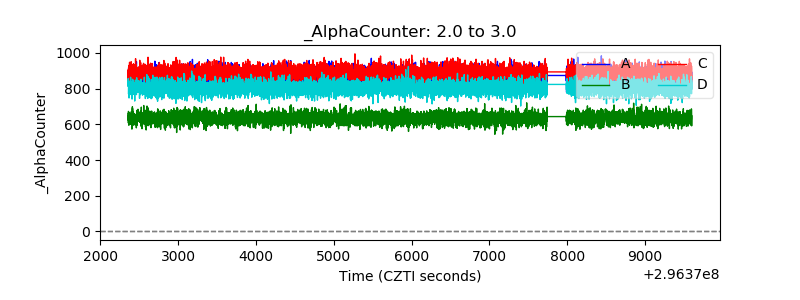 |
| _CPM_Rate | 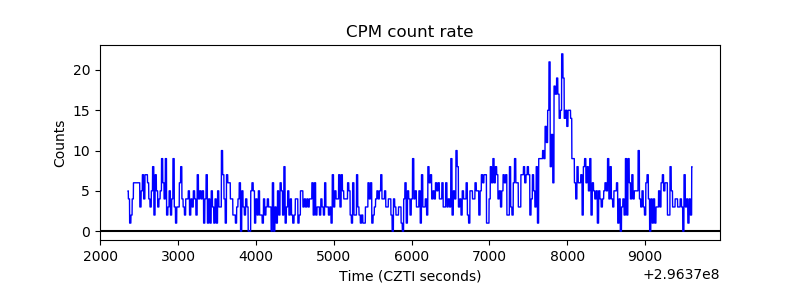 |
| CZT Counter | 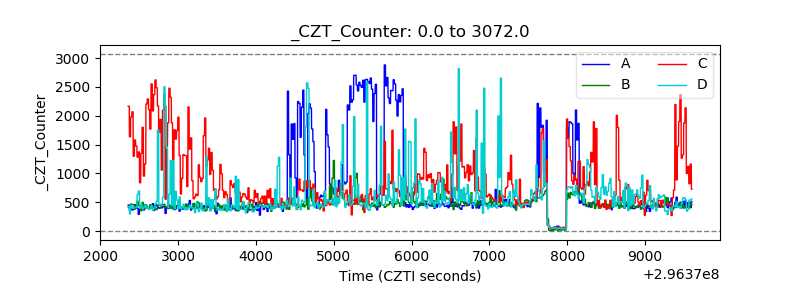 |
| +2.5 Volts monitor |  |
| +5 Volts monitor | 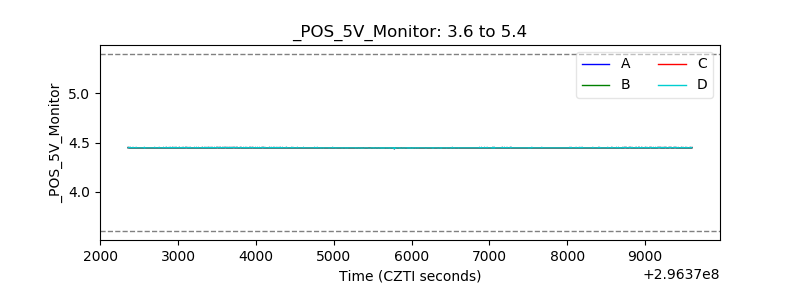 |
| _ROLL_ROT | 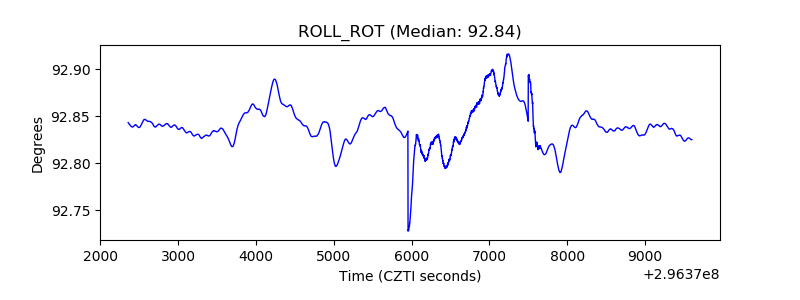 |
| _Roll_DEC | 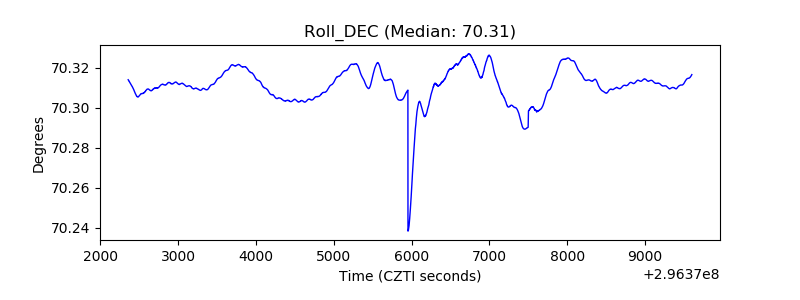 |
| _Roll_RA | 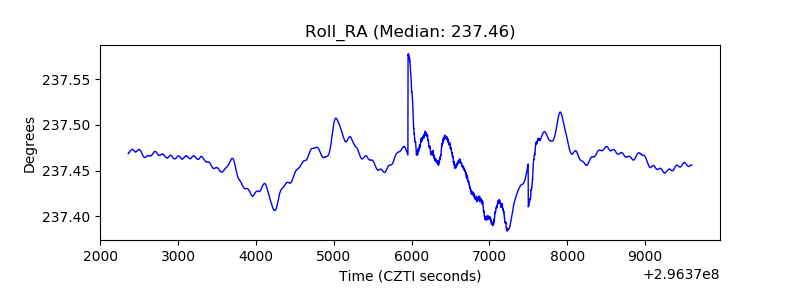 |
| Veto Counter | 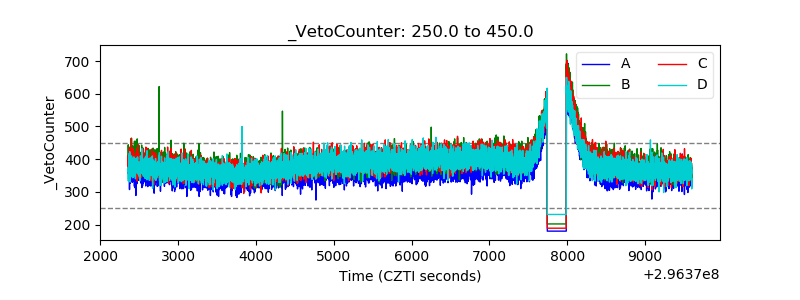 |