| Param | Original file | Final file |
|---|---|---|
| Filename | modeM0/AS1C04_001T01_9000002948_19748cztM0_level2.evt | modeM0/AS1C04_001T01_9000002948_19748cztM0_level2_quad_clean.evt |
| Size (bytes) | 395,334,720 | 87,353,280 |
| Size | 377.0 MB | 83.3 MB |
| Events in quadrant A | 2,396,919 | 582,975 |
| Events in quadrant B | 2,618,836 | 590,970 |
| Events in quadrant C | 2,940,409 | 570,314 |
| Events in quadrant D | 3,668,293 | 542,466 |
| Mode SS | |||
|---|---|---|---|
| Quadrant | BADHDUFLAG | Total packets | Discarded packets |
| A | 0 | 102 | 0 |
| B | 0 | 103 | 1 |
| C | 0 | 103 | 1 |
| D | 0 | 104 | 2 |
| Mode M0 | |||
|---|---|---|---|
| Quadrant | BADHDUFLAG | Total packets | Discarded packets |
| A | 0 | 10647 | 51 |
| B | 0 | 11210 | 59 |
| C | 0 | 12072 | 54 |
| D | 0 | 14654 | 120 |
| Quadrant | Total seconds | Saturated seconds | Saturation percentage |
|---|---|---|---|
| A | 5114 | 231 | 4.517012% |
| B | 5115 | 279 | 5.454545% |
| C | 5112 | 261 | 5.105634% |
| D | 5111 | 589 | 11.524164% |
Noise dominated data is calculated using 1-second bins in cleaned event files. If a bin has >2000 counts, and if more than 50% of those come from <1% of pixels, then it is considered to be noise-dominated and hence unusable.
| Quadrant | # 1 sec bins | Bins with >0 counts | Bins with >2000 counts | High rate bins dominated by noise | Noise dominated (total time) | Noise dominated (detector-on time) | Marked lightcurve |
|---|---|---|---|---|---|---|---|
| A | 5355 | 5121 | 0 | 0 | 0.00% | 0.00% | 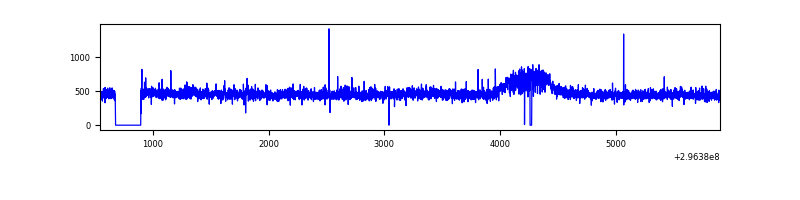 |
| B | 5355 | 5121 | 22 | 22 | 0.41% | 0.43% | 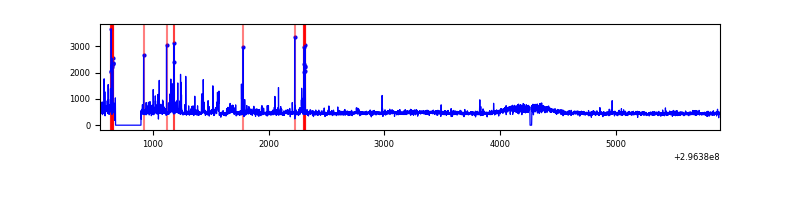 |
| C | 5354 | 5118 | 0 | 0 | 0.00% | 0.00% | 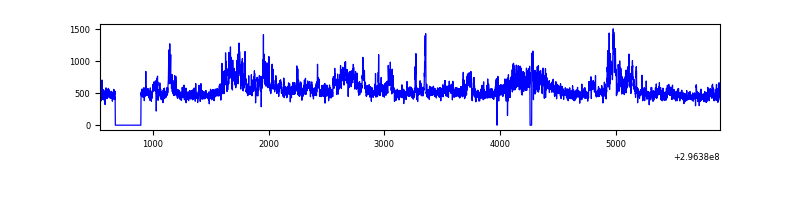 |
| D | 5354 | 5117 | 371 | 371 | 6.93% | 7.25% | 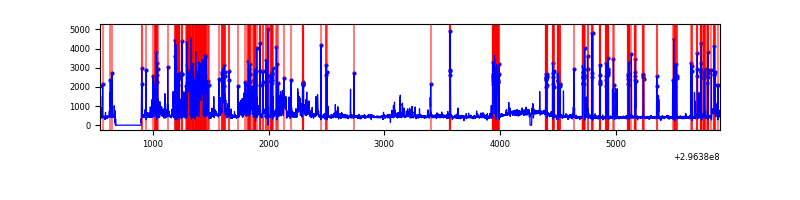 |
Top three noisy pixels from each quadrant. If the there are fewer than three noisy pixels in the level2.evt file, extra rows are filled as -1
| Pixel properties | Quadrant properties | ||||||
|---|---|---|---|---|---|---|---|
| Quadrant | DetID | PixID | Counts | Sigma | Mean | Median | Sigma |
| A | 12 | 16 | 23346 | 183.05 | 607 | 592 | 124.3 |
| A | 0 | 23 | 21263 | 166.29 | 607 | 592 | 124.3 |
| A | 12 | 194 | 7916 | 58.92 | 607 | 592 | 124.3 |
| B | 7 | 220 | 127894 | 1093.22 | 607 | 590 | 116.4 |
| B | 3 | 64 | 33937 | 286.36 | 607 | 590 | 116.4 |
| B | 0 | 197 | 33164 | 279.73 | 607 | 590 | 116.4 |
| C | 3 | 233 | 512128 | 3752.69 | 585 | 587 | 136.3 |
| C | 14 | 238 | 90303 | 658.16 | 585 | 587 | 136.3 |
| C | 7 | 247 | 33232 | 239.49 | 585 | 587 | 136.3 |
| D | 1 | 52 | 1362107 | 9716.35 | 572 | 553 | 140.1 |
| D | 7 | 38 | 58308 | 412.15 | 572 | 553 | 140.1 |
| D | 10 | 230 | 31972 | 224.21 | 572 | 553 | 140.1 |
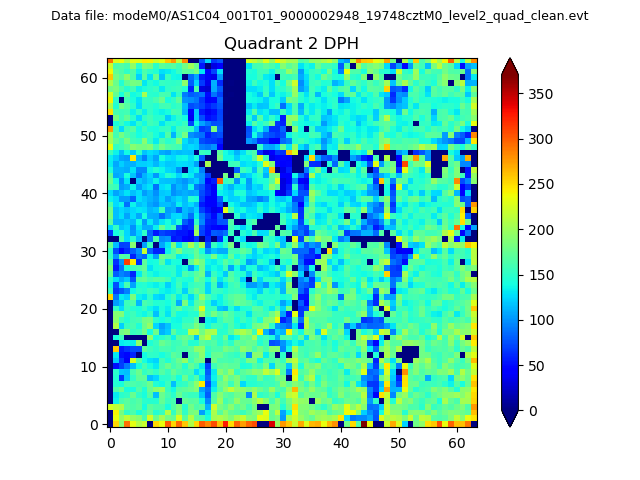
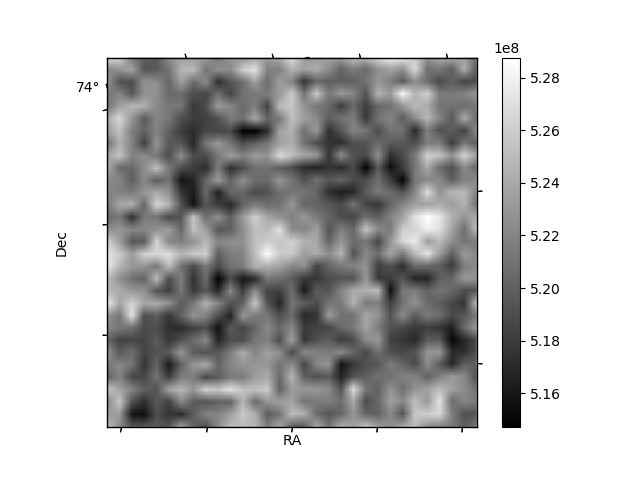
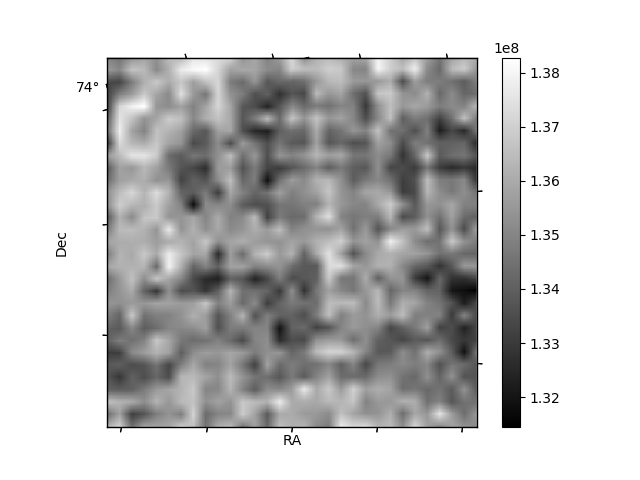
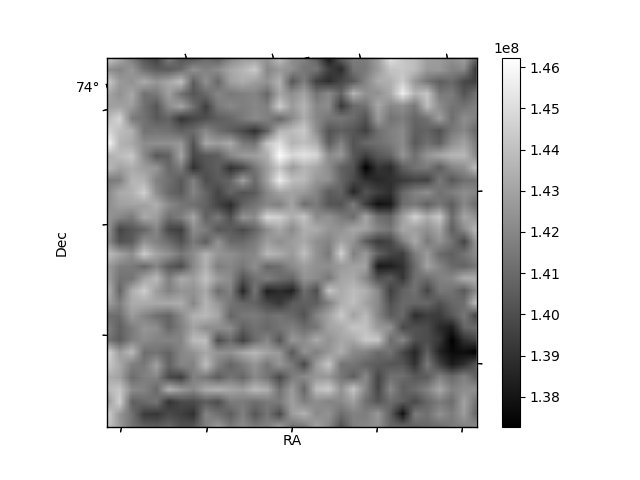
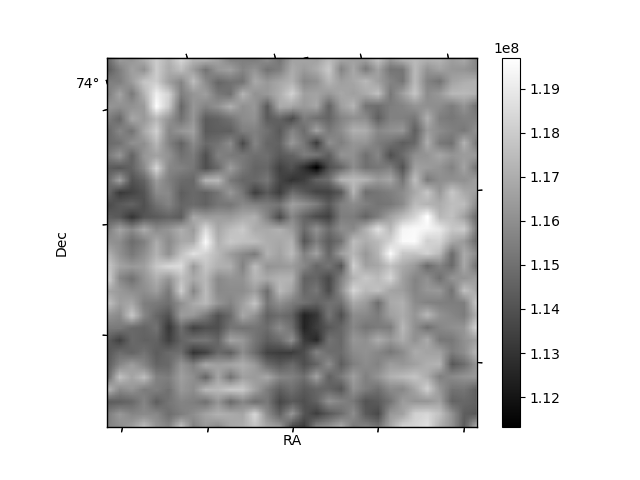
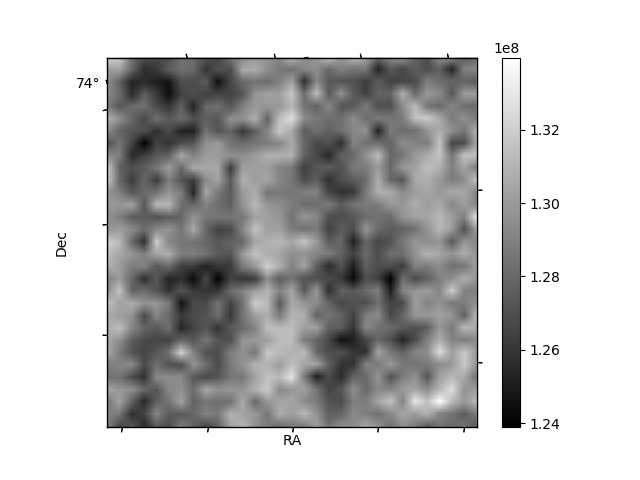
Histogram calculated using DETX and DETY for each event in the final _common_clean file
| Quadrant A | 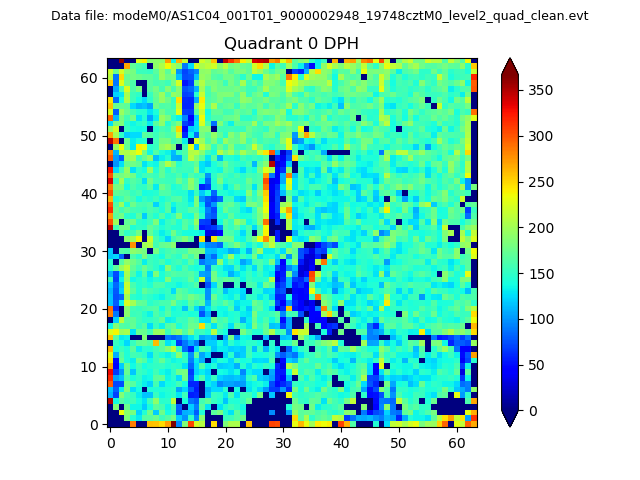 |
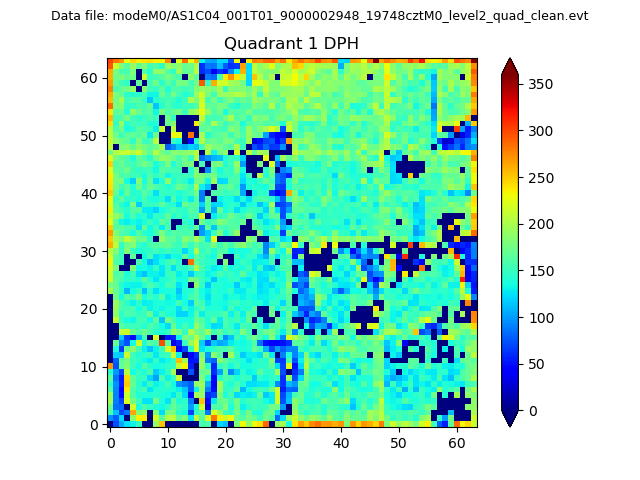 |
Quadrant B |
|---|---|---|---|
| Quadrant D | 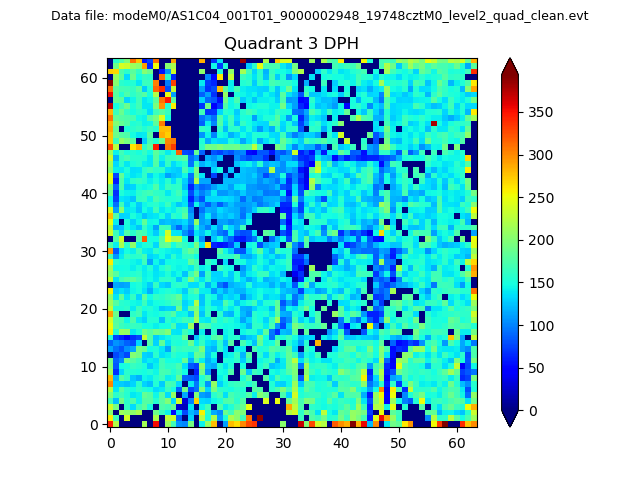 |
 |
Quadrant C |
| Plot type | Count rate plots | Images |
|---|---|---|
| Comparison with Poisson distribution Blue bars denote a histogram of data divided into 1 sec bins. Red curve is a Poisson curve with rate = median count rate of data. |
 |
 |
| Quadrant-wise count rates Data is divided into 100 sec bins |
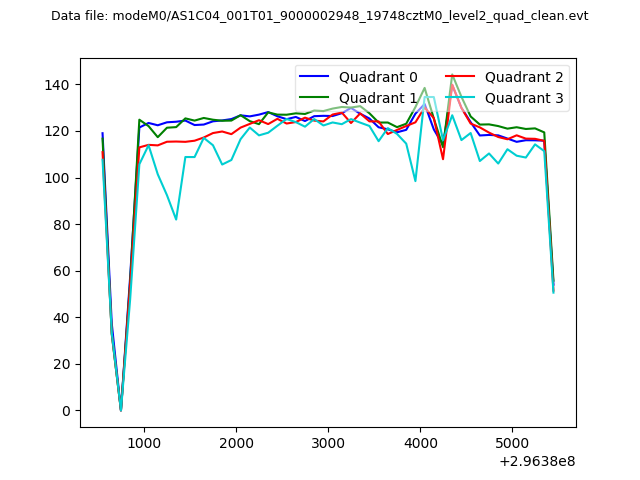 |
|
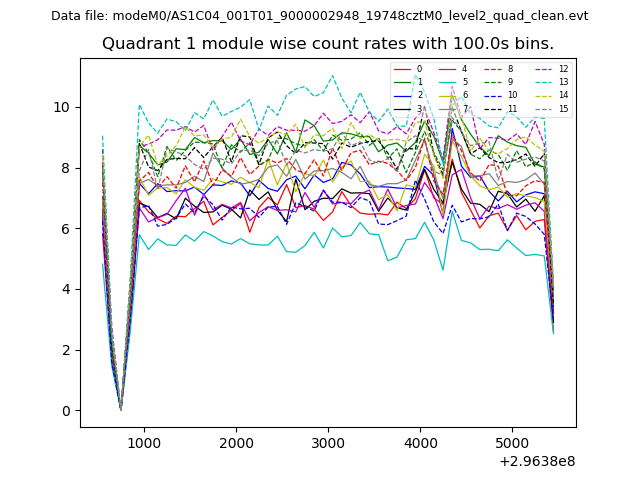
| Module-wise count rates for Quadrant A Data is divided into 100 sec bins |
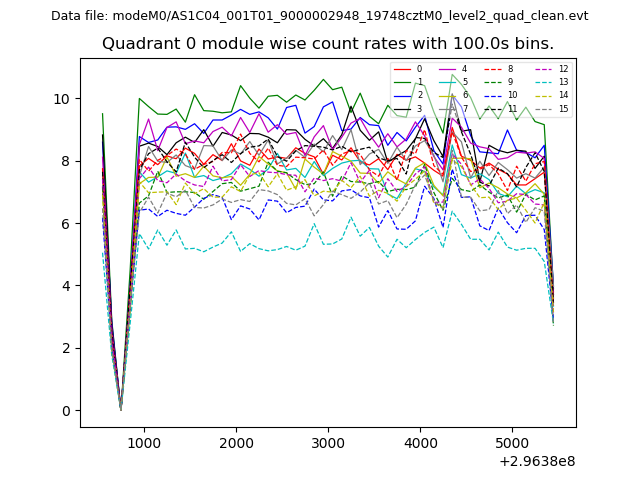 |
 |
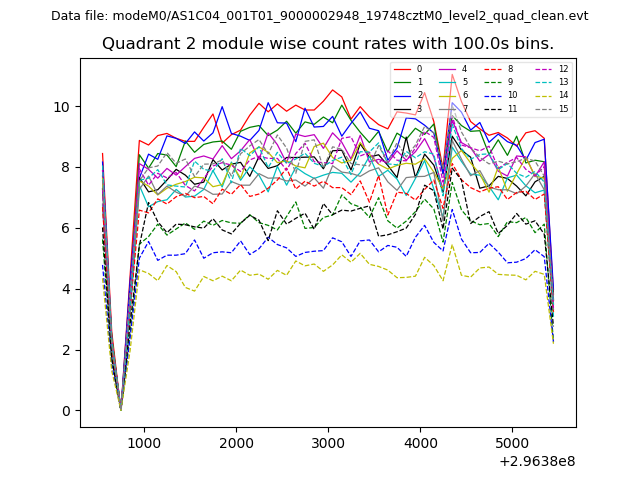
| Module-wise count rates for Quadrant B Data is divided into 100 sec bins |
 |
 |
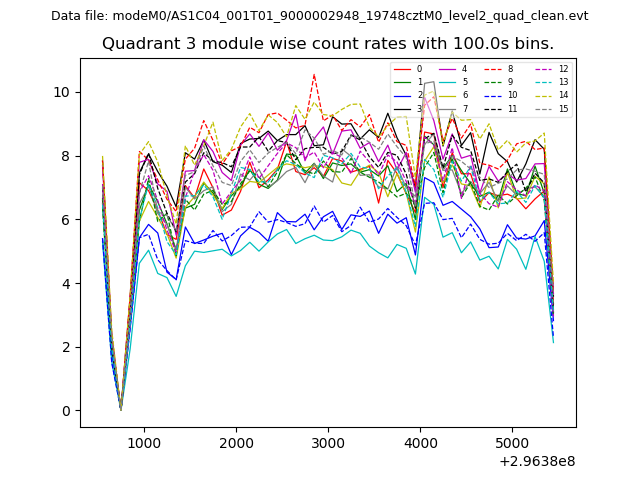
| Module-wise count rates for Quadrant C Data is divided into 100 sec bins |
 |
 |
| Module-wise count rates for Quadrant D Data is divided into 100 sec bins |
 |
 |
| Parameter | Plot |
|---|---|
| CZT HV Monitor | 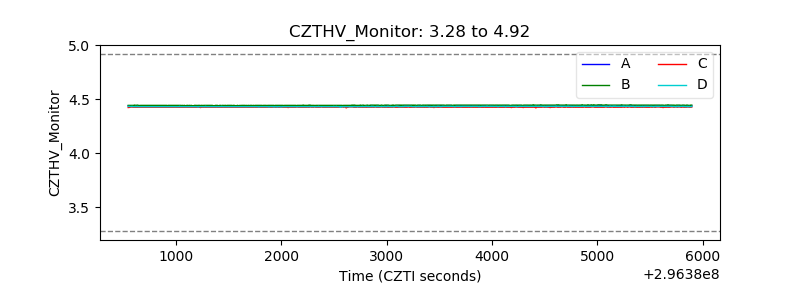 |
| D_VDD |  |
| Temperature 1 | 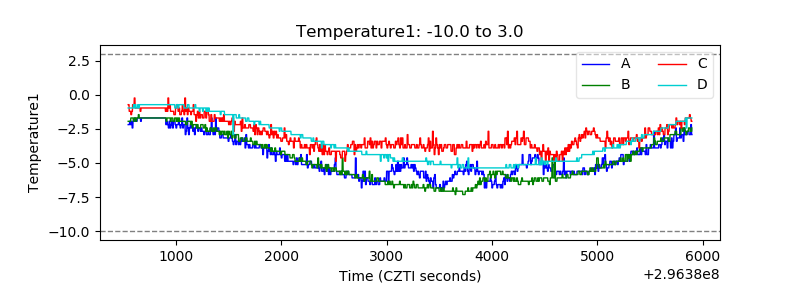 |
| Veto HV Monitor | 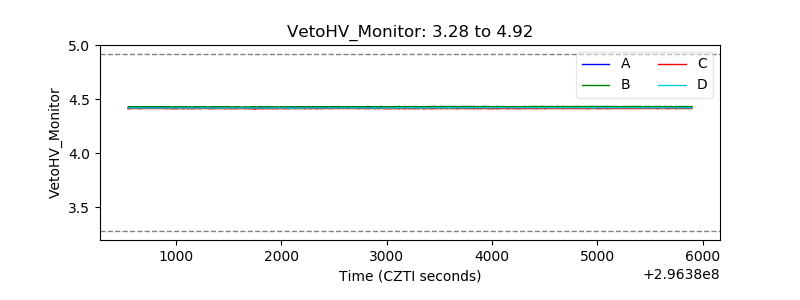 |
| Veto LLD | 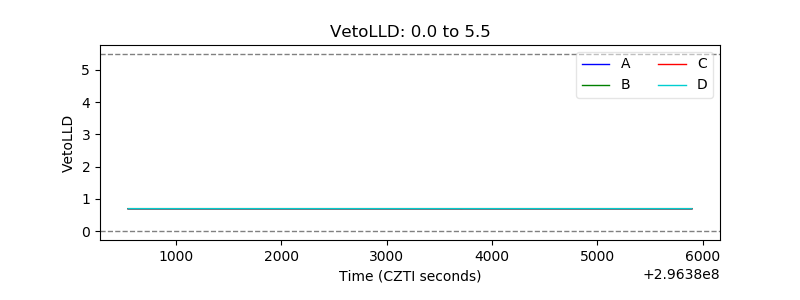 |
| Alpha Counter | 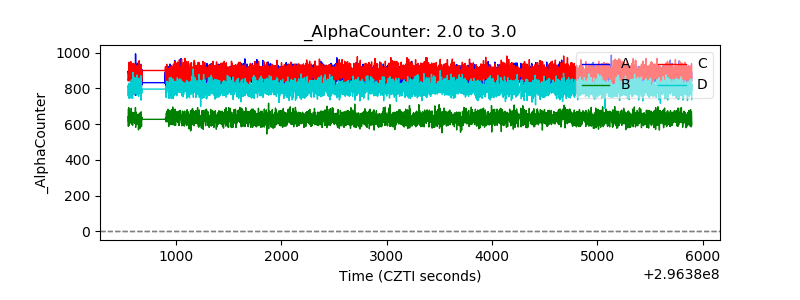 |
| _CPM_Rate | 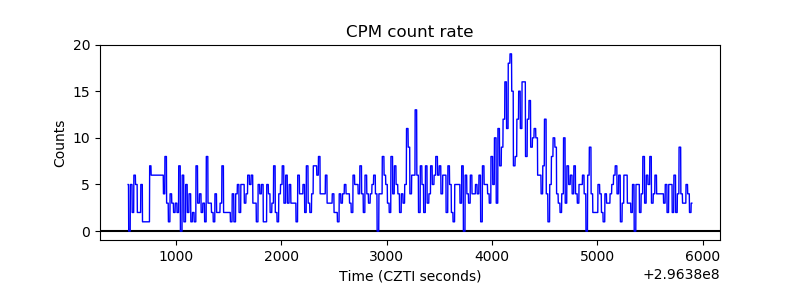 |
| CZT Counter | 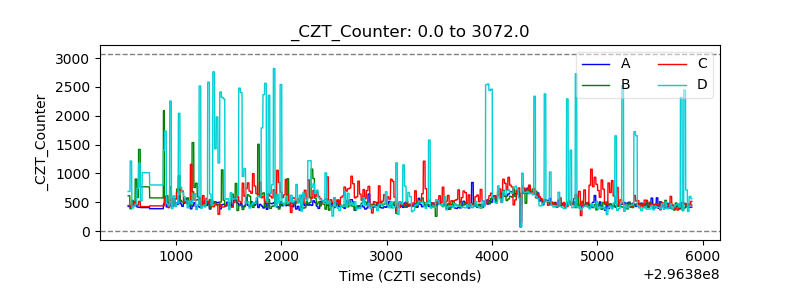 |
| +2.5 Volts monitor |  |
| +5 Volts monitor |  |
| _ROLL_ROT | 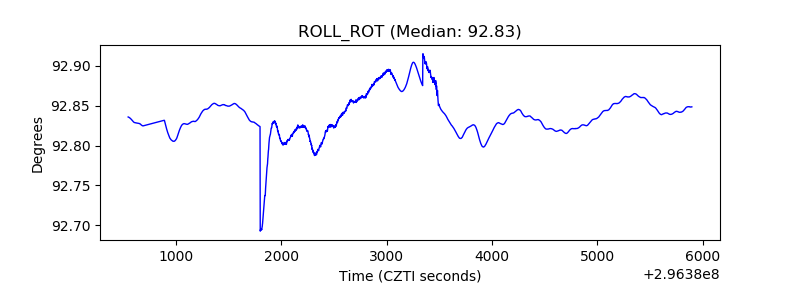 |
| _Roll_DEC | 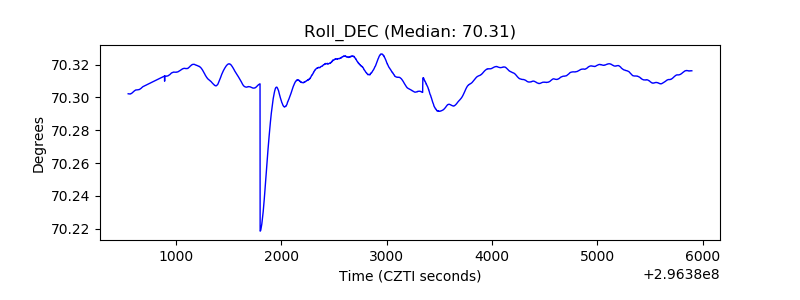 |
| _Roll_RA | 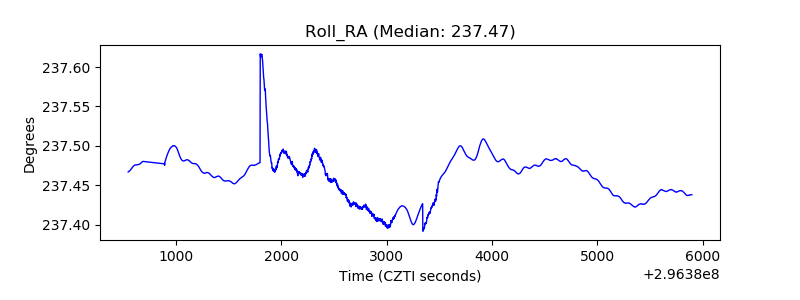 |
| Veto Counter | 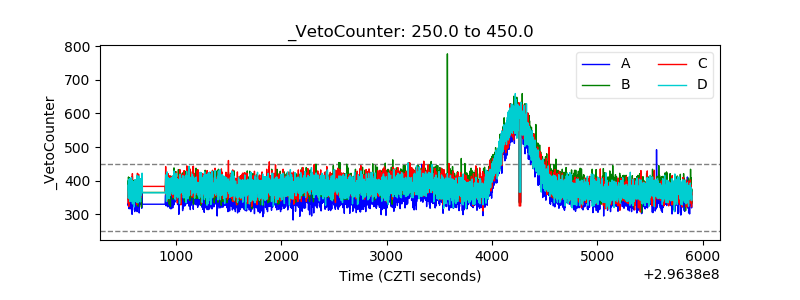 |