| Param | Original file | Final file |
|---|---|---|
| Filename | modeM0/AS1C04_001T01_9000002948_19749cztM0_level2.evt | modeM0/AS1C04_001T01_9000002948_19749cztM0_level2_quad_clean.evt |
| Size (bytes) | 827,472,960 | 188,017,920 |
| Size | 789.1 MB | 179.3 MB |
| Events in quadrant A | 5,049,603 | 1,255,584 |
| Events in quadrant B | 5,460,656 | 1,274,025 |
| Events in quadrant C | 6,495,014 | 1,217,655 |
| Events in quadrant D | 7,300,089 | 1,175,926 |
| Mode M9 | |||
|---|---|---|---|
| Quadrant | BADHDUFLAG | Total packets | Discarded packets |
| A | 0 | 1 | 1 |
| B | 1 | 1 | 1 |
| C | 1 | -1 | -1 |
| D | 1 | -1 | -1 |
| Mode SS | |||
|---|---|---|---|
| Quadrant | BADHDUFLAG | Total packets | Discarded packets |
| A | 0 | 224 | 0 |
| B | 0 | 224 | 0 |
| C | 0 | 224 | 0 |
| D | 0 | 224 | 0 |
| Mode M0 | |||
|---|---|---|---|
| Quadrant | BADHDUFLAG | Total packets | Discarded packets |
| A | 0 | 22808 | 131 |
| B | 0 | 23833 | 152 |
| C | 0 | 26500 | 140 |
| D | 0 | 29551 | 128 |
| Quadrant | Total seconds | Saturated seconds | Saturation percentage |
|---|---|---|---|
| A | 11137 | 238 | 2.137021% |
| B | 11136 | 305 | 2.738865% |
| C | 11140 | 381 | 3.420108% |
| D | 11140 | 708 | 6.355476% |
Noise dominated data is calculated using 1-second bins in cleaned event files. If a bin has >2000 counts, and if more than 50% of those come from <1% of pixels, then it is considered to be noise-dominated and hence unusable.
| Quadrant | # 1 sec bins | Bins with >0 counts | Bins with >2000 counts | High rate bins dominated by noise | Noise dominated (total time) | Noise dominated (detector-on time) | Marked lightcurve |
|---|---|---|---|---|---|---|---|
| A | 13629 | 11154 | 0 | 0 | 0.00% | 0.00% | 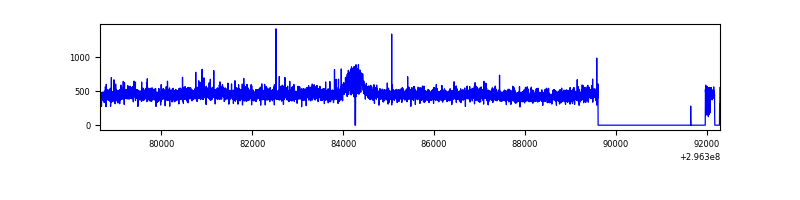 |
| B | 13629 | 11157 | 34 | 34 | 0.25% | 0.30% | 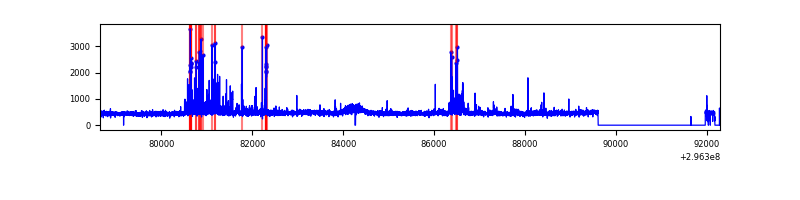 |
| C | 13629 | 11156 | 86 | 86 | 0.63% | 0.77% | 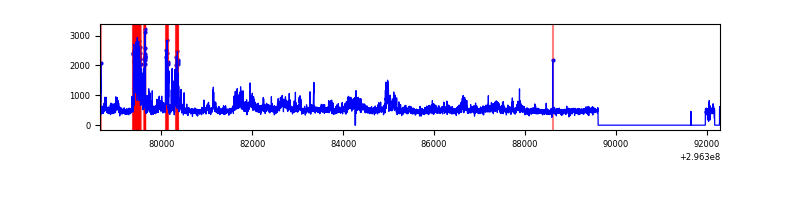 |
| D | 13628 | 11157 | 463 | 463 | 3.40% | 4.15% | 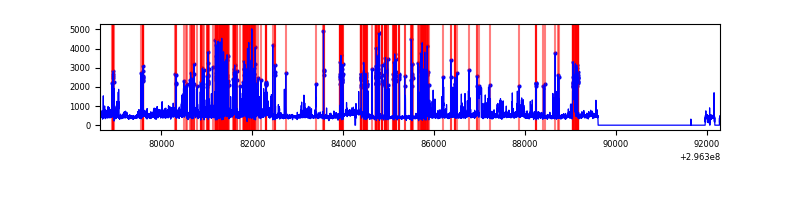 |
Top three noisy pixels from each quadrant. If the there are fewer than three noisy pixels in the level2.evt file, extra rows are filled as -1
| Pixel properties | Quadrant properties | ||||||
|---|---|---|---|---|---|---|---|
| Quadrant | DetID | PixID | Counts | Sigma | Mean | Median | Sigma |
| A | 12 | 16 | 55611 | 210.04 | 1278 | 1248 | 258.8 |
| A | 0 | 23 | 32793 | 121.88 | 1278 | 1248 | 258.8 |
| A | 12 | 194 | 17427 | 62.51 | 1278 | 1248 | 258.8 |
| B | 7 | 220 | 245145 | 1011.31 | 1277 | 1243 | 241.2 |
| B | 4 | 216 | 64799 | 263.53 | 1277 | 1243 | 241.2 |
| B | 0 | 197 | 48710 | 196.82 | 1277 | 1243 | 241.2 |
| C | 3 | 233 | 1433225 | 5054.55 | 1227 | 1235 | 283.3 |
| C | 14 | 238 | 191131 | 670.28 | 1227 | 1235 | 283.3 |
| C | 7 | 247 | 50772 | 174.85 | 1227 | 1235 | 283.3 |
| D | 1 | 52 | 2113803 | 7090.93 | 1220 | 1179 | 297.9 |
| D | 7 | 38 | 240733 | 804.05 | 1220 | 1179 | 297.9 |
| D | 10 | 230 | 91087 | 301.77 | 1220 | 1179 | 297.9 |
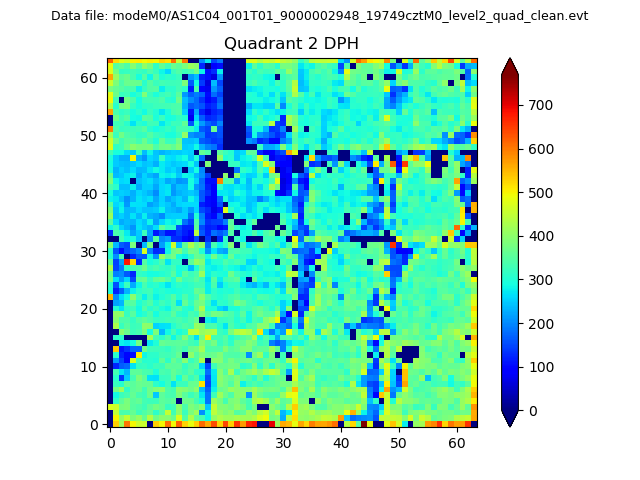
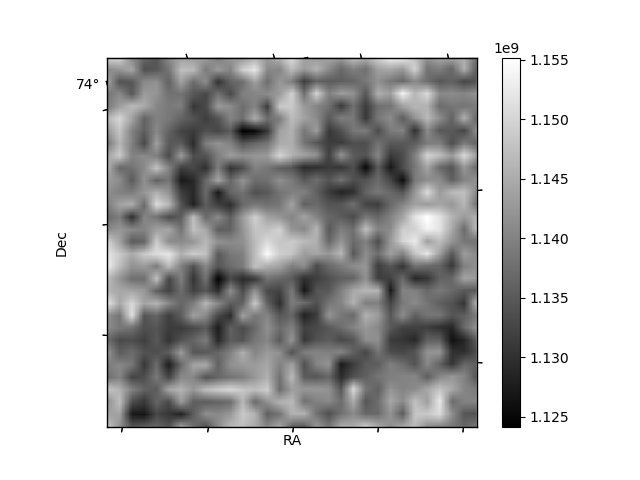
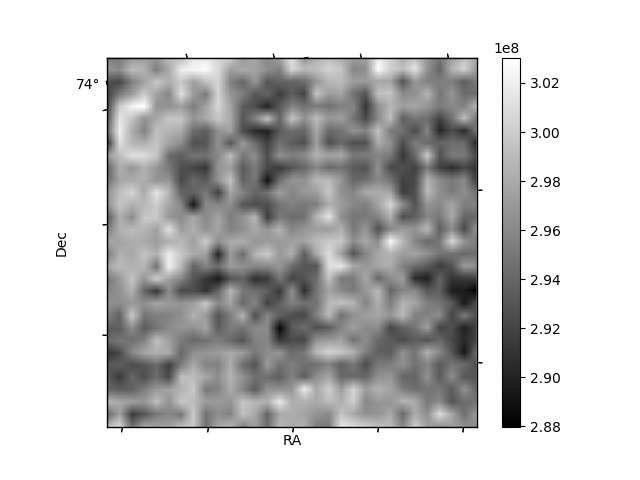
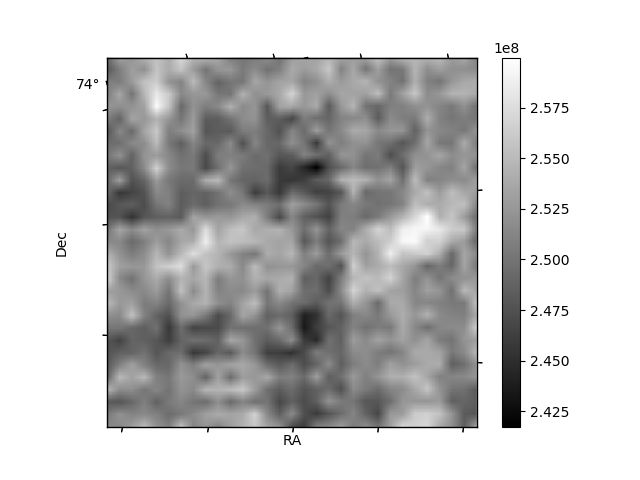
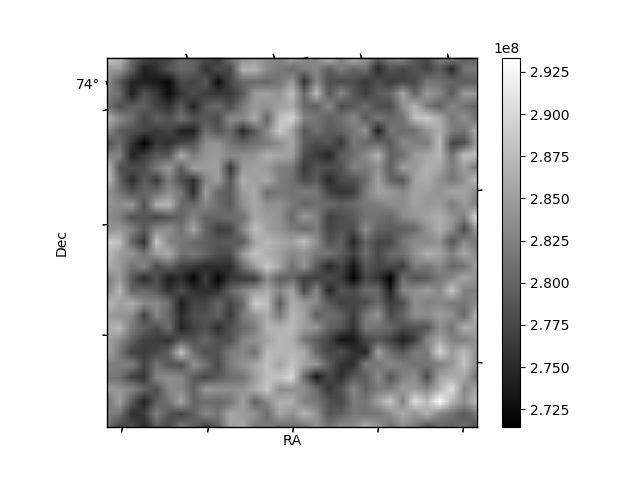
Histogram calculated using DETX and DETY for each event in the final _common_clean file
| Quadrant A | 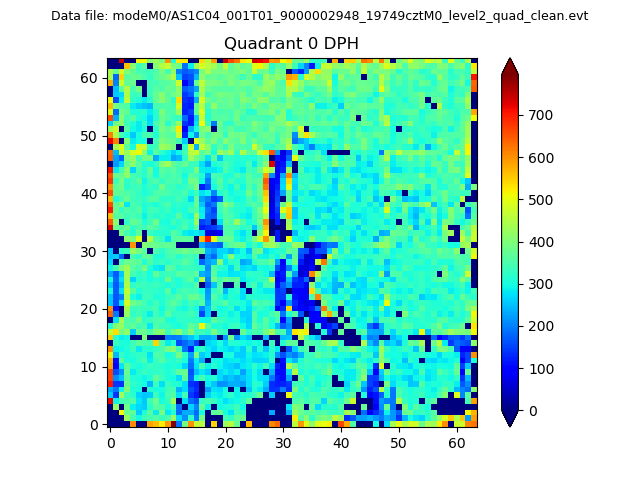 |
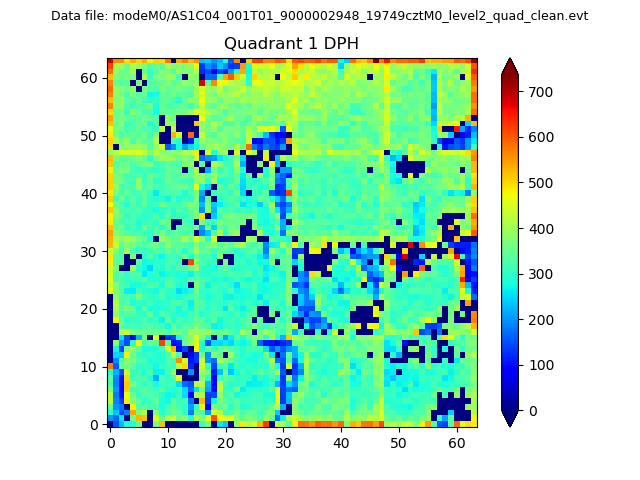 |
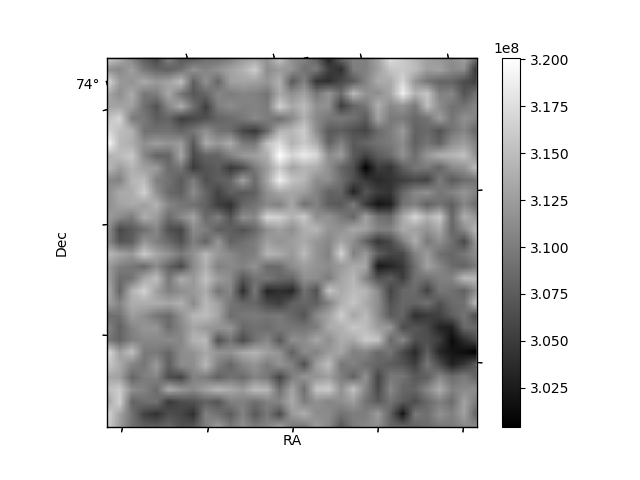
Quadrant B |
|---|---|---|---|
| Quadrant D | 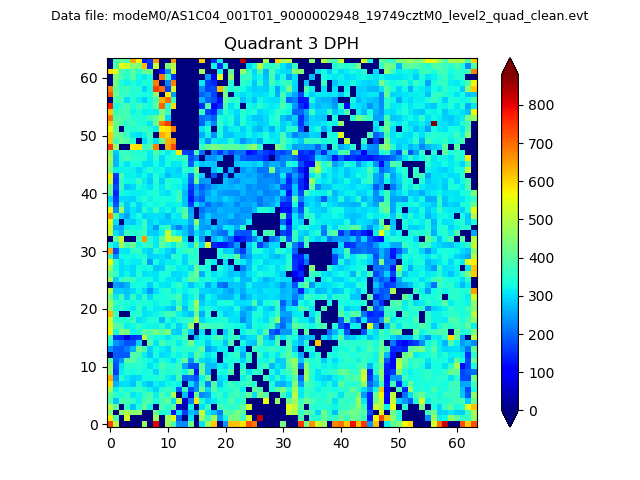 |
 |
Quadrant C |
| Plot type | Count rate plots | Images |
|---|---|---|
| Comparison with Poisson distribution Blue bars denote a histogram of data divided into 1 sec bins. Red curve is a Poisson curve with rate = median count rate of data. |
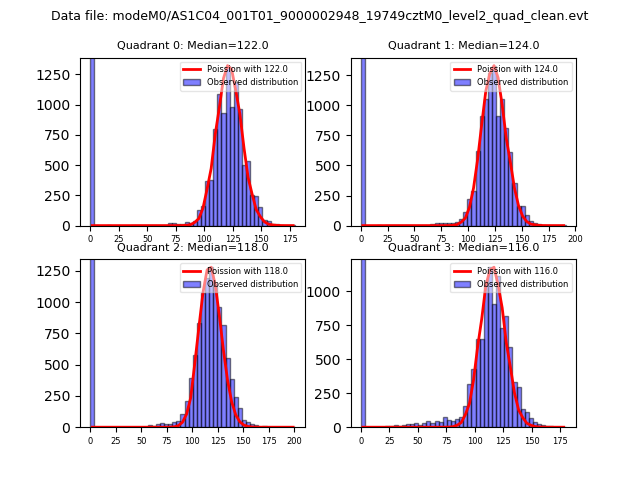 |
 |
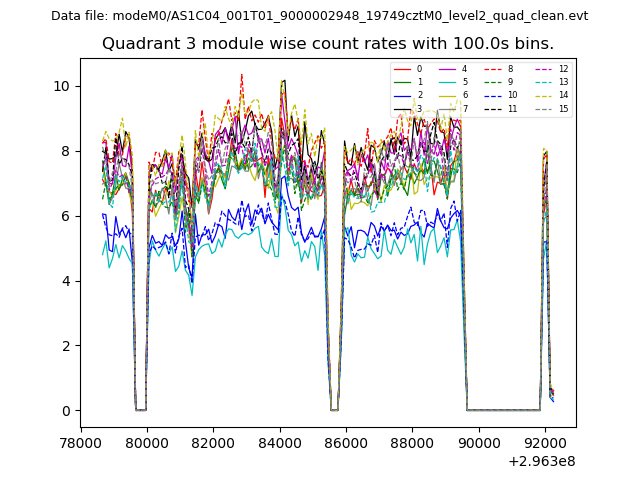
| Quadrant-wise count rates Data is divided into 100 sec bins |
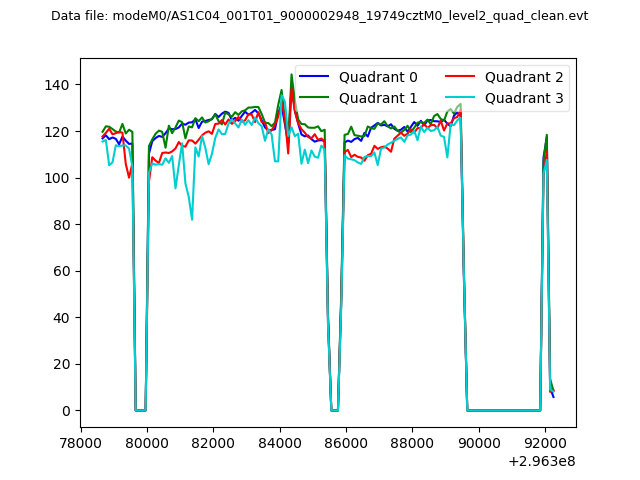 |
|
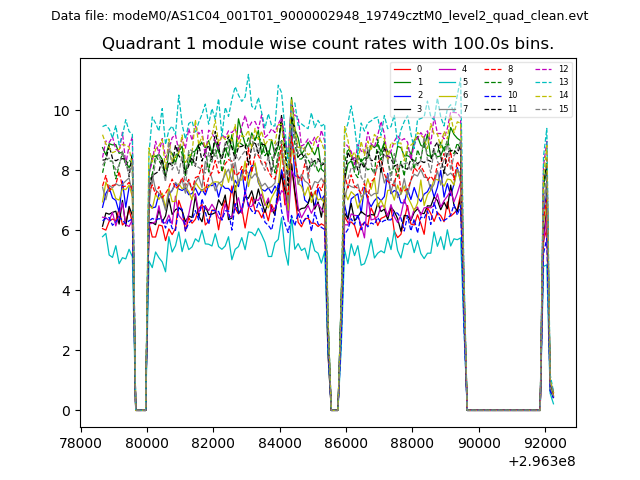
| Module-wise count rates for Quadrant A Data is divided into 100 sec bins |
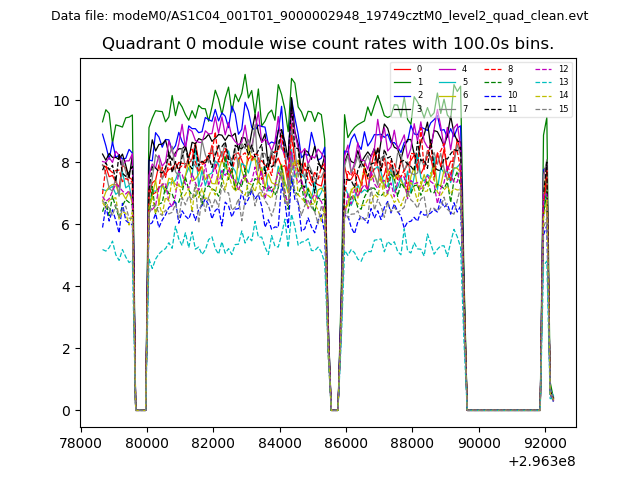 |
 |
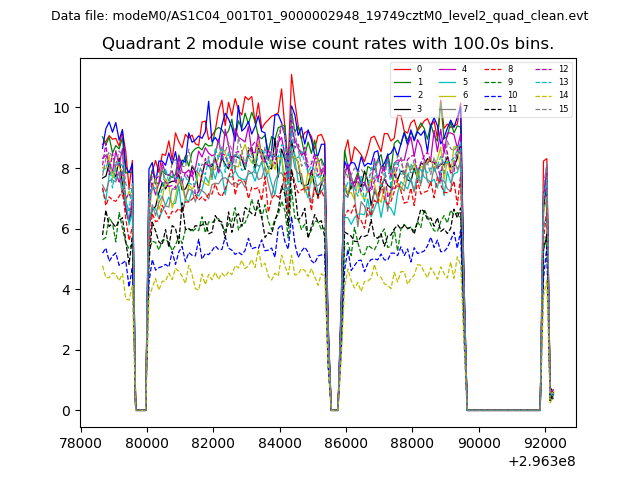
| Module-wise count rates for Quadrant B Data is divided into 100 sec bins |
 |
 |
| Module-wise count rates for Quadrant C Data is divided into 100 sec bins |
 |
 |
| Module-wise count rates for Quadrant D Data is divided into 100 sec bins |
 |
 |
| Parameter | Plot |
|---|---|
| CZT HV Monitor | 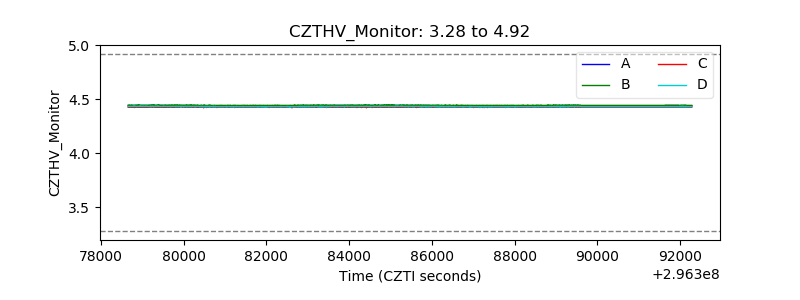 |
| D_VDD | 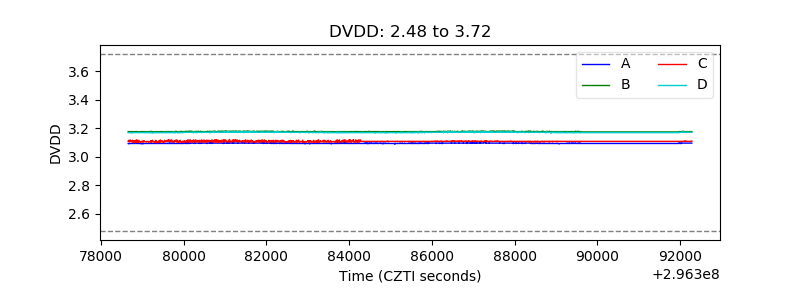 |
| Temperature 1 | 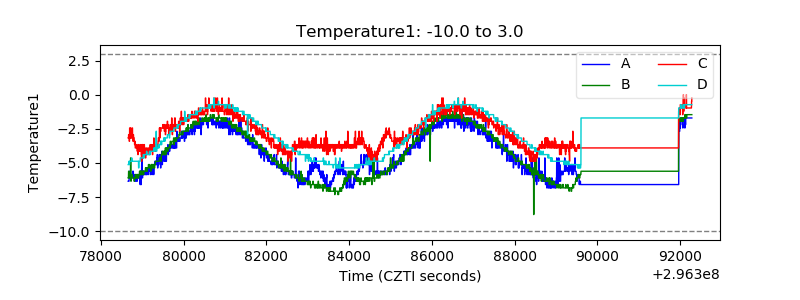 |
| Veto HV Monitor | 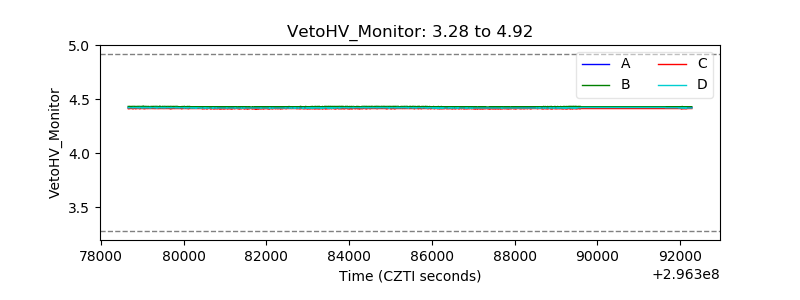 |
| Veto LLD | 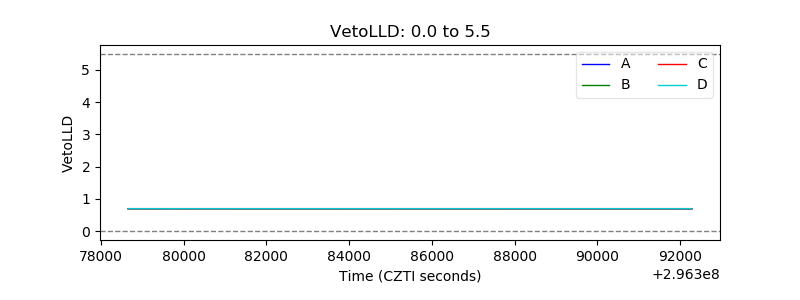 |
| Alpha Counter | 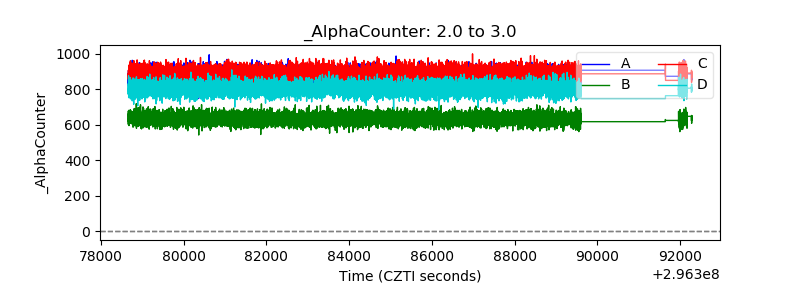 |
| _CPM_Rate | 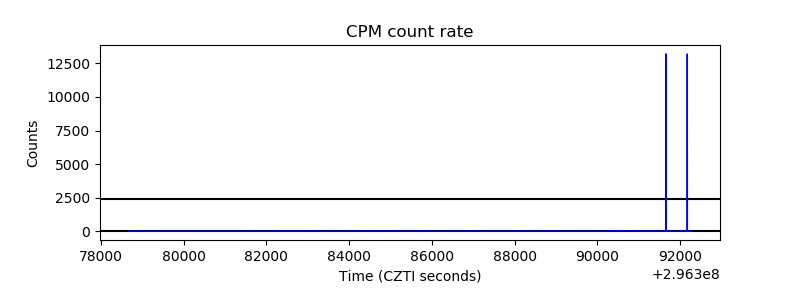 |
| CZT Counter | 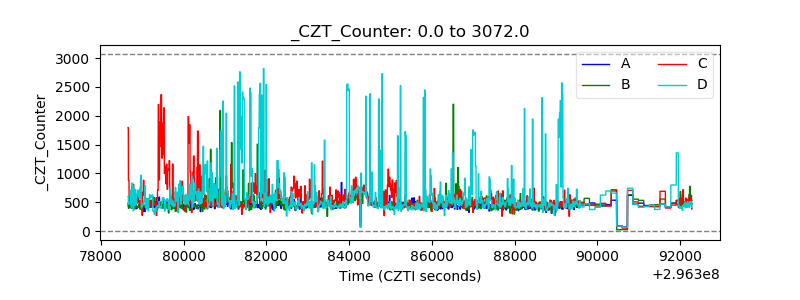 |
| +2.5 Volts monitor |  |
| +5 Volts monitor |  |
| _ROLL_ROT | 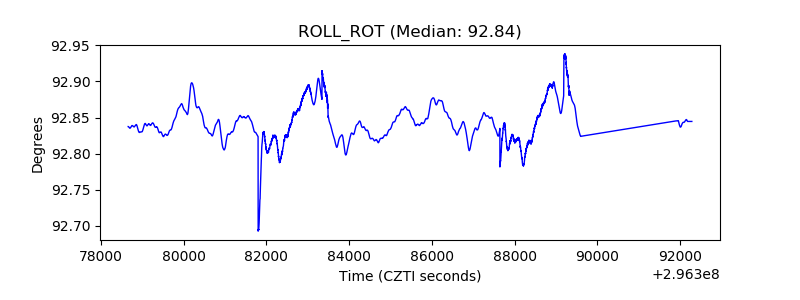 |
| _Roll_DEC | 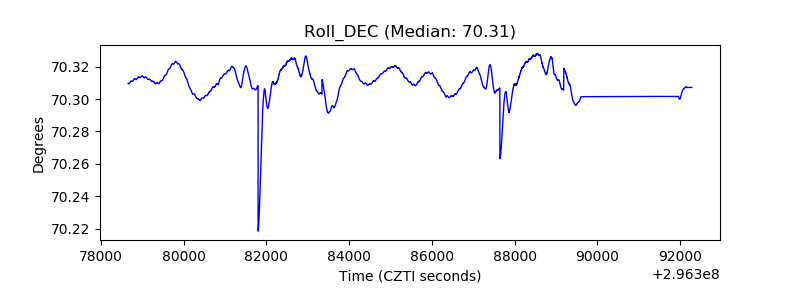 |
| _Roll_RA | 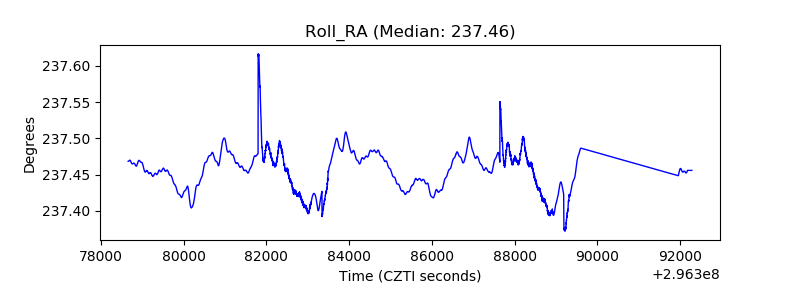 |
| Veto Counter | 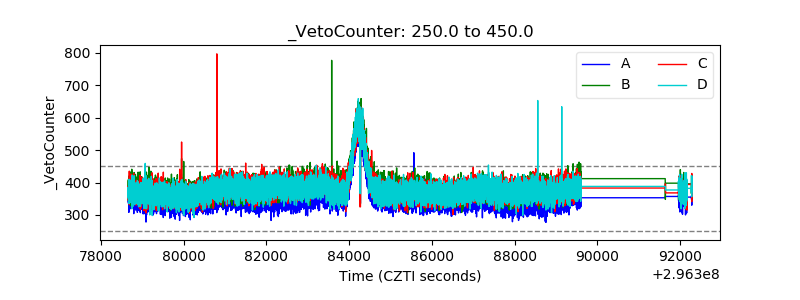 |