| Param | Original file | Final file |
|---|---|---|
| Filename | modeM0/AS1C04_001T01_9000002948_19751cztM0_level2.evt | modeM0/AS1C04_001T01_9000002948_19751cztM0_level2_quad_clean.evt |
| Size (bytes) | 1,771,087,680 | 401,336,640 |
| Size | 1.6 GB | 382.7 MB |
| Events in quadrant A | 10,864,884 | 2,684,157 |
| Events in quadrant B | 12,064,940 | 2,713,964 |
| Events in quadrant C | 12,956,194 | 2,605,114 |
| Events in quadrant D | 16,139,704 | 2,510,649 |
| Mode M9 | |||
|---|---|---|---|
| Quadrant | BADHDUFLAG | Total packets | Discarded packets |
| A | 0 | 17 | 0 |
| B | 0 | 17 | 0 |
| C | 0 | 17 | 0 |
| D | 0 | 17 | 0 |
| Mode SS | |||
|---|---|---|---|
| Quadrant | BADHDUFLAG | Total packets | Discarded packets |
| A | 0 | 480 | 0 |
| B | 0 | 480 | 0 |
| C | 0 | 480 | 0 |
| D | 0 | 480 | 0 |
| Mode M0 | |||
|---|---|---|---|
| Quadrant | BADHDUFLAG | Total packets | Discarded packets |
| A | 0 | 48589 | 4 |
| B | 0 | 51719 | 4 |
| C | 0 | 53349 | 4 |
| D | 0 | 64521 | 4 |
| Quadrant | Total seconds | Saturated seconds | Saturation percentage |
|---|---|---|---|
| A | 23879 | 398 | 1.666736% |
| B | 23880 | 557 | 2.332496% |
| C | 23879 | 609 | 2.550358% |
| D | 23879 | 1351 | 5.657691% |
Noise dominated data is calculated using 1-second bins in cleaned event files. If a bin has >2000 counts, and if more than 50% of those come from <1% of pixels, then it is considered to be noise-dominated and hence unusable.
| Quadrant | # 1 sec bins | Bins with >0 counts | Bins with >2000 counts | High rate bins dominated by noise | Noise dominated (total time) | Noise dominated (detector-on time) | Marked lightcurve |
|---|---|---|---|---|---|---|---|
| A | 25439 | 23881 | 0 | 0 | 0.00% | 0.00% | 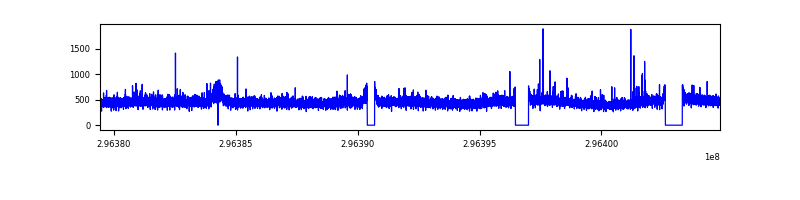 |
| B | 25440 | 23882 | 115 | 115 | 0.45% | 0.48% | 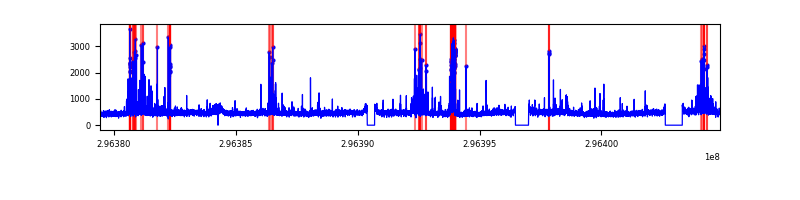 |
| C | 25439 | 23882 | 77 | 77 | 0.30% | 0.32% | 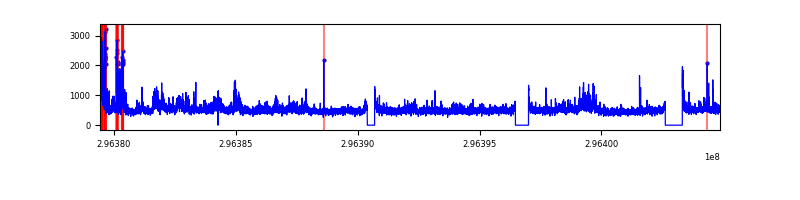 |
| D | 25439 | 23882 | 947 | 947 | 3.72% | 3.97% | 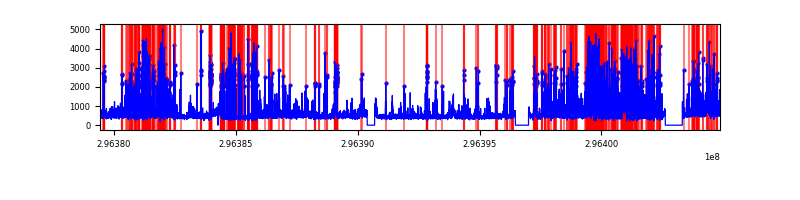 |
Top three noisy pixels from each quadrant. If the there are fewer than three noisy pixels in the level2.evt file, extra rows are filled as -1
| Pixel properties | Quadrant properties | ||||||
|---|---|---|---|---|---|---|---|
| Quadrant | DetID | PixID | Counts | Sigma | Mean | Median | Sigma |
| A | 12 | 16 | 48984 | 83.27 | 2774 | 2715 | 555.6 |
| A | 11 | 29 | 37994 | 63.49 | 2774 | 2715 | 555.6 |
| A | 0 | 23 | 32192 | 53.05 | 2774 | 2715 | 555.6 |
| B | 7 | 220 | 564329 | 1068.54 | 2770 | 2688 | 525.6 |
| B | 3 | 64 | 305071 | 575.29 | 2770 | 2688 | 525.6 |
| B | 4 | 216 | 135764 | 253.18 | 2770 | 2688 | 525.6 |
| C | 3 | 233 | 2060647 | 3334.43 | 2665 | 2675 | 617.2 |
| C | 14 | 238 | 414719 | 667.61 | 2665 | 2675 | 617.2 |
| C | 7 | 247 | 64863 | 100.76 | 2665 | 2675 | 617.2 |
| D | 1 | 52 | 3910736 | 6041.16 | 2656 | 2572 | 646.9 |
| D | 7 | 38 | 585785 | 901.52 | 2656 | 2572 | 646.9 |
| D | 9 | 1 | 546609 | 840.96 | 2656 | 2572 | 646.9 |
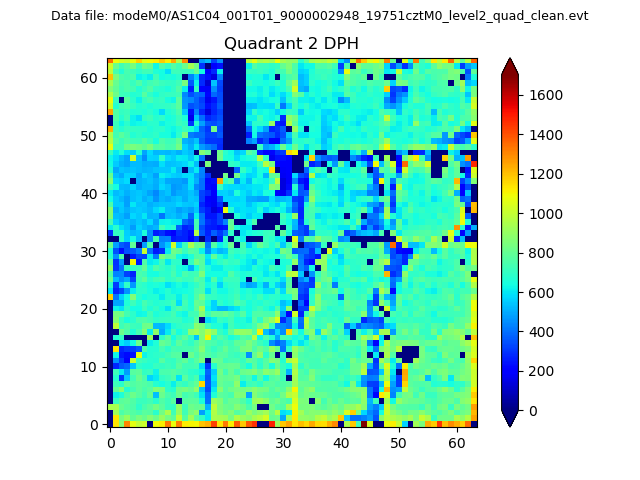
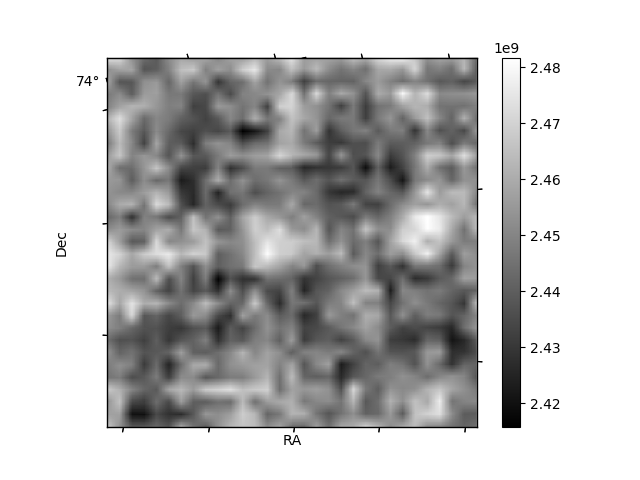
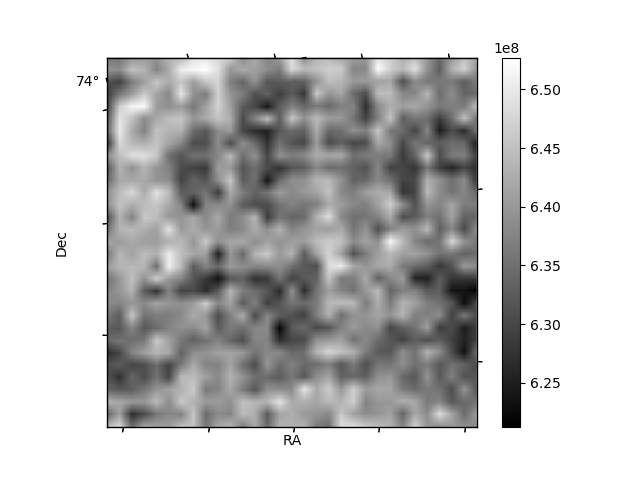
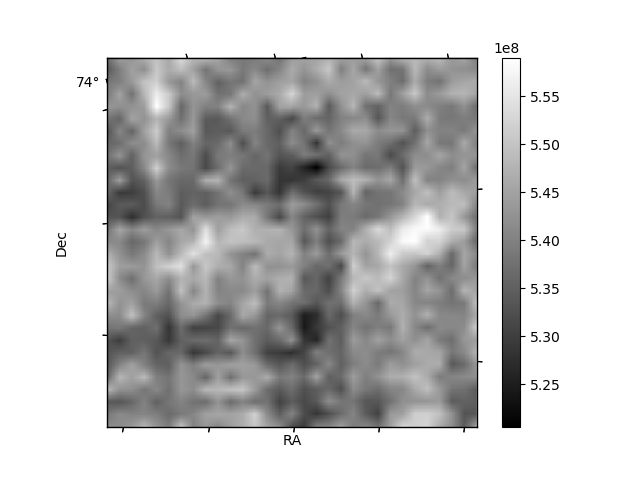
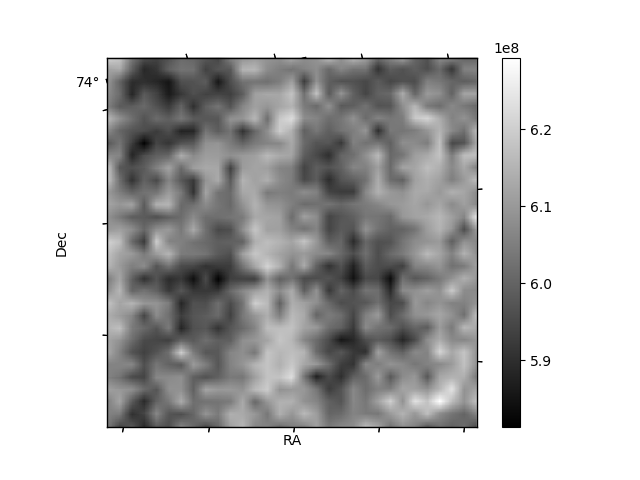
Histogram calculated using DETX and DETY for each event in the final _common_clean file
| Quadrant A | 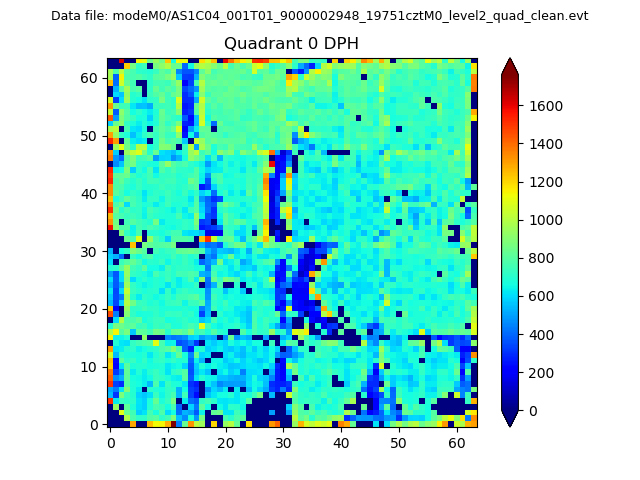 |
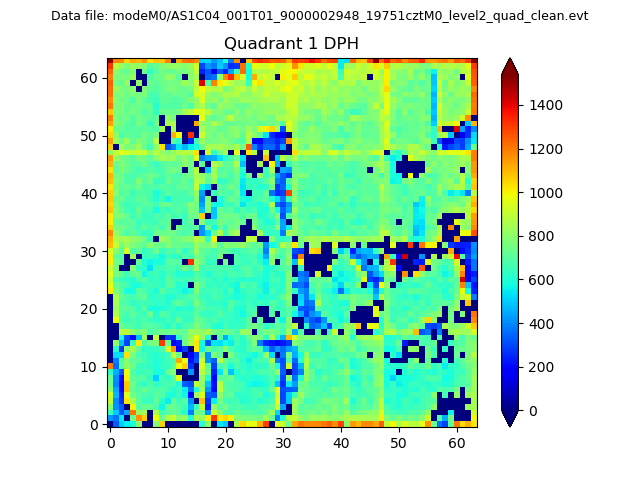 |
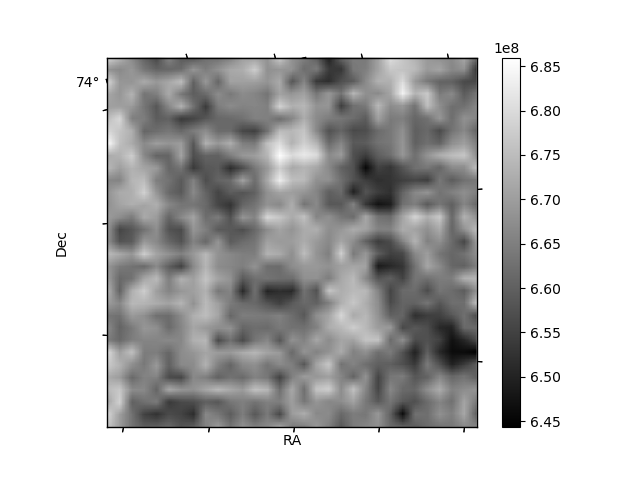
Quadrant B |
|---|---|---|---|
| Quadrant D | 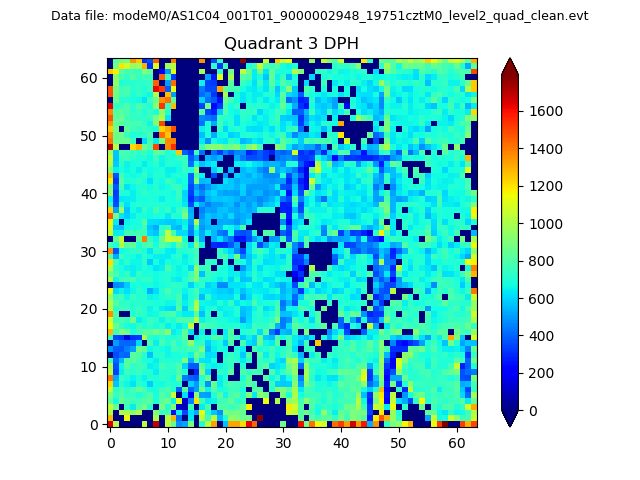 |
 |
Quadrant C |
| Plot type | Count rate plots | Images |
|---|---|---|
| Comparison with Poisson distribution Blue bars denote a histogram of data divided into 1 sec bins. Red curve is a Poisson curve with rate = median count rate of data. |
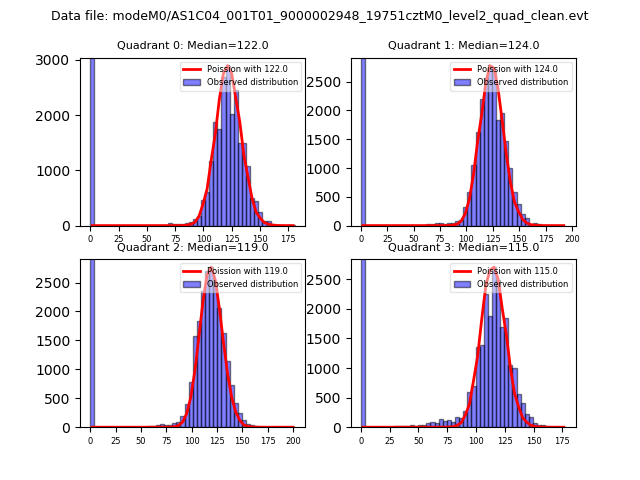 |
 |
| Quadrant-wise count rates Data is divided into 100 sec bins |
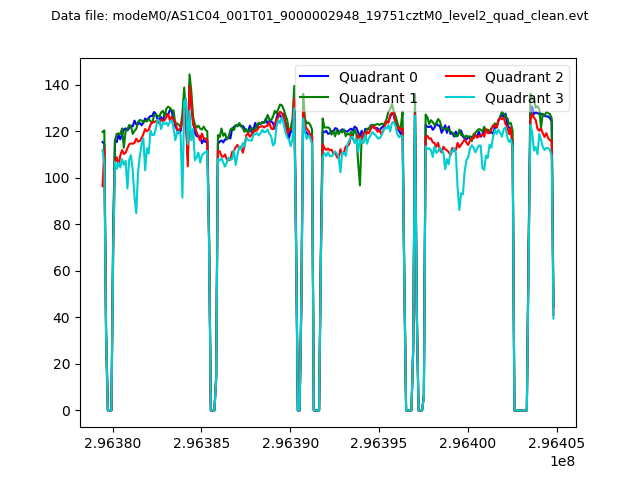 |
|
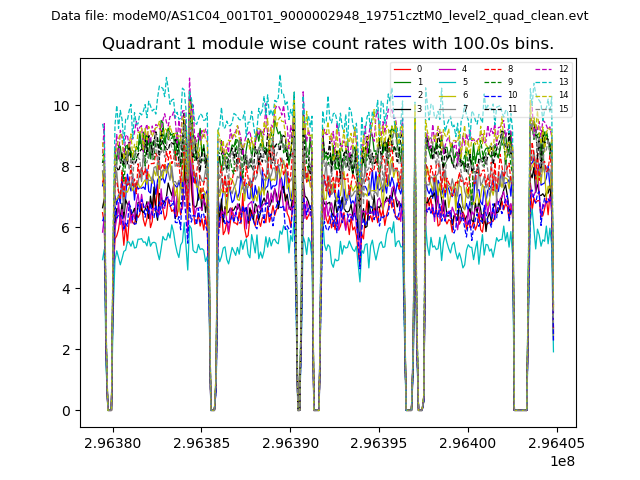
| Module-wise count rates for Quadrant A Data is divided into 100 sec bins |
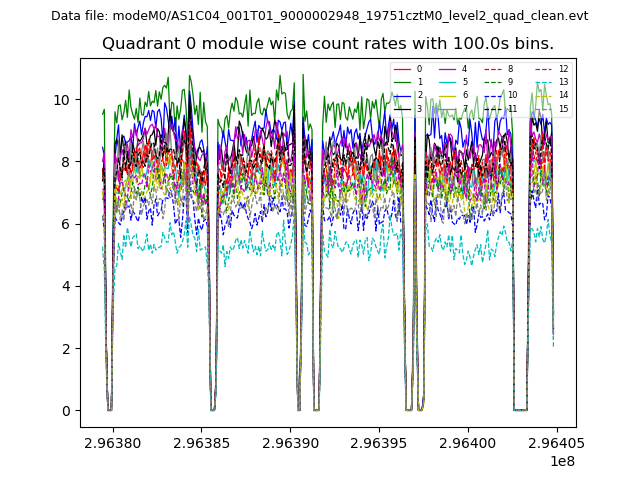 |
 |
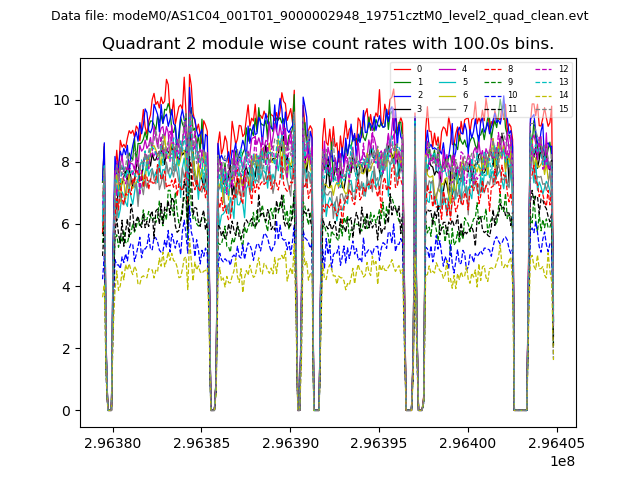
| Module-wise count rates for Quadrant B Data is divided into 100 sec bins |
 |
 |
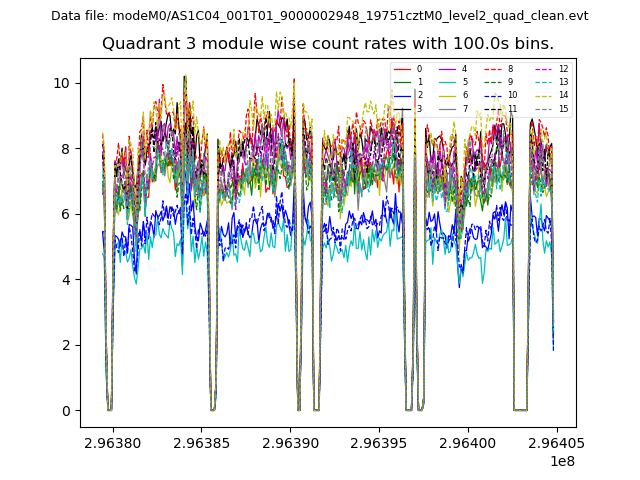
| Module-wise count rates for Quadrant C Data is divided into 100 sec bins |
 |
 |
| Module-wise count rates for Quadrant D Data is divided into 100 sec bins |
 |
 |
| Parameter | Plot |
|---|---|
| CZT HV Monitor | 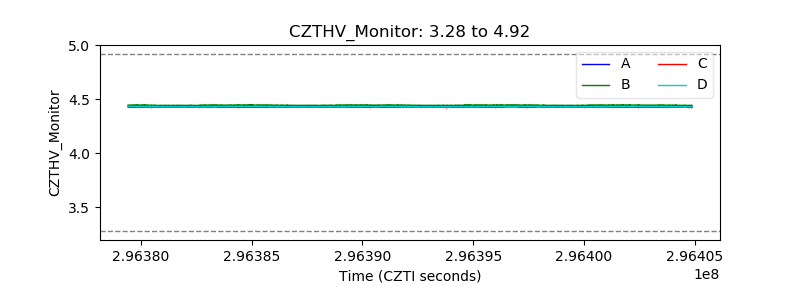 |
| D_VDD | 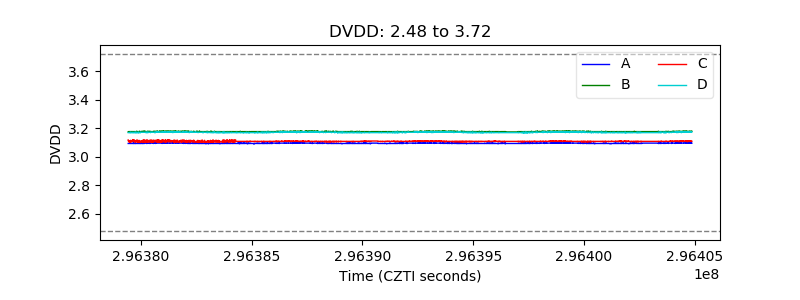 |
| Temperature 1 | 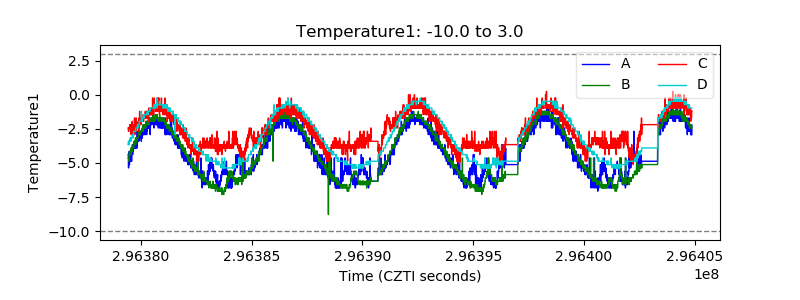 |
| Veto HV Monitor | 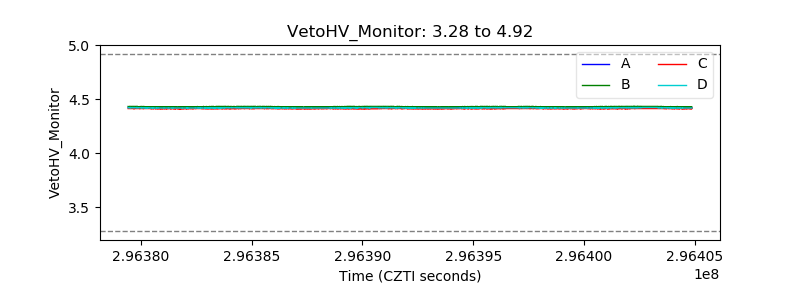 |
| Veto LLD | 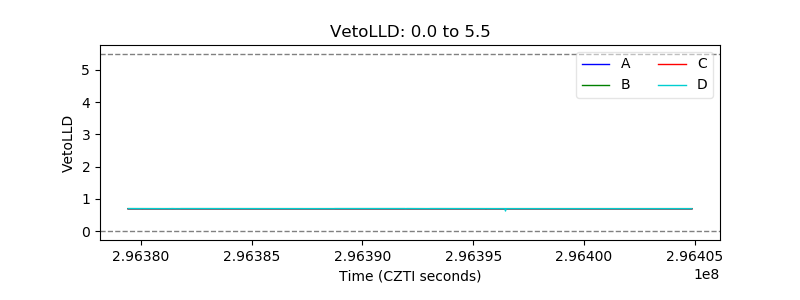 |
| Alpha Counter | 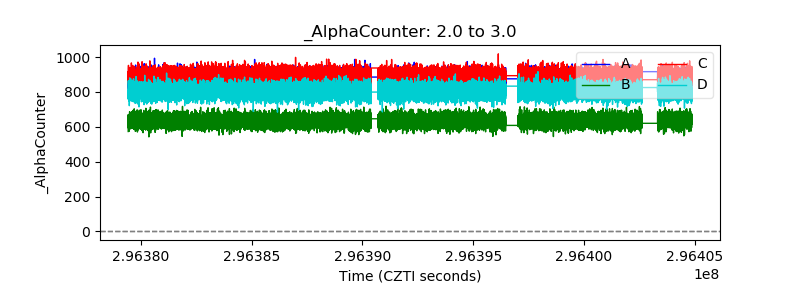 |
| _CPM_Rate | 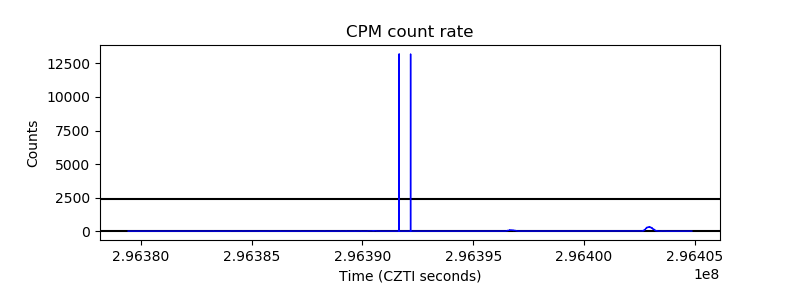 |
| CZT Counter | 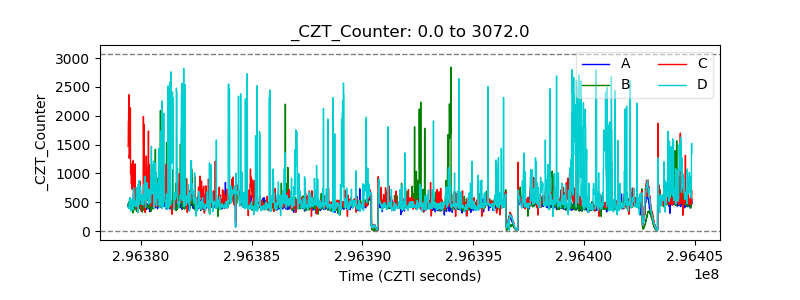 |
| +2.5 Volts monitor |  |
| +5 Volts monitor |  |
| _ROLL_ROT | 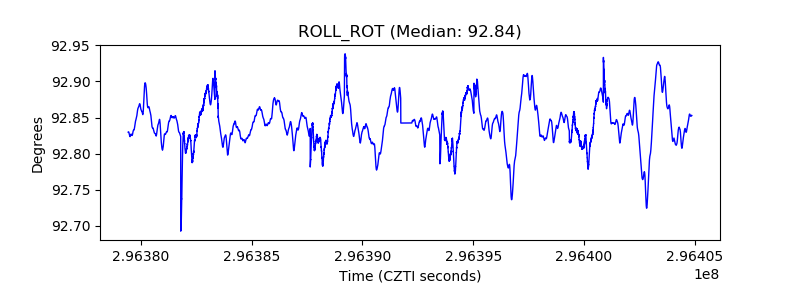 |
| _Roll_DEC |  |
| _Roll_RA | 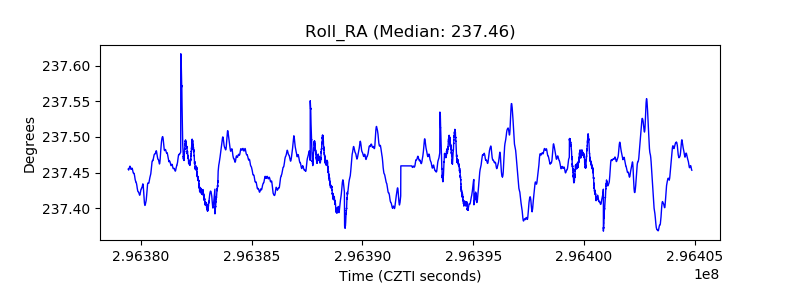 |
| Veto Counter | 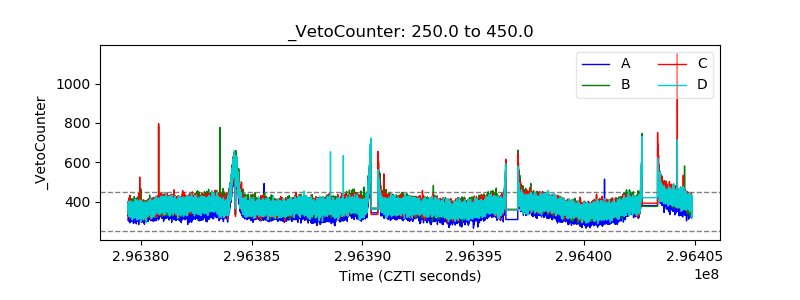 |