| Param | Original file | Final file |
|---|---|---|
| Filename | modeM0/AS1C04_001T01_9000002948_19752cztM0_level2.evt | modeM0/AS1C04_001T01_9000002948_19752cztM0_level2_quad_clean.evt |
| Size (bytes) | 516,142,080 | 120,657,600 |
| Size | 492.2 MB | 115.1 MB |
| Events in quadrant A | 2,983,799 | 820,934 |
| Events in quadrant B | 3,458,357 | 825,273 |
| Events in quadrant C | 3,316,048 | 798,462 |
| Events in quadrant D | 5,428,329 | 752,348 |
| Mode M9 | |||
|---|---|---|---|
| Quadrant | BADHDUFLAG | Total packets | Discarded packets |
| A | 0 | 9 | 0 |
| B | 0 | 9 | 0 |
| C | 0 | 9 | 0 |
| D | 0 | 9 | 0 |
| Mode SS | |||
|---|---|---|---|
| Quadrant | BADHDUFLAG | Total packets | Discarded packets |
| A | 0 | 132 | 0 |
| B | 0 | 132 | 0 |
| C | 0 | 132 | 0 |
| D | 0 | 132 | 0 |
| Mode M0 | |||
|---|---|---|---|
| Quadrant | BADHDUFLAG | Total packets | Discarded packets |
| A | 0 | 13342 | 1 |
| B | 0 | 14798 | 1 |
| C | 0 | 14008 | 1 |
| D | 0 | 20742 | 1 |
| Quadrant | Total seconds | Saturated seconds | Saturation percentage |
|---|---|---|---|
| A | 6560 | 31 | 0.472561% |
| B | 6561 | 109 | 1.661332% |
| C | 6561 | 81 | 1.234568% |
| D | 6561 | 456 | 6.950160% |
Noise dominated data is calculated using 1-second bins in cleaned event files. If a bin has >2000 counts, and if more than 50% of those come from <1% of pixels, then it is considered to be noise-dominated and hence unusable.
| Quadrant | # 1 sec bins | Bins with >0 counts | Bins with >2000 counts | High rate bins dominated by noise | Noise dominated (total time) | Noise dominated (detector-on time) | Marked lightcurve |
|---|---|---|---|---|---|---|---|
| A | 7435 | 6561 | 0 | 0 | 0.00% | 0.00% | 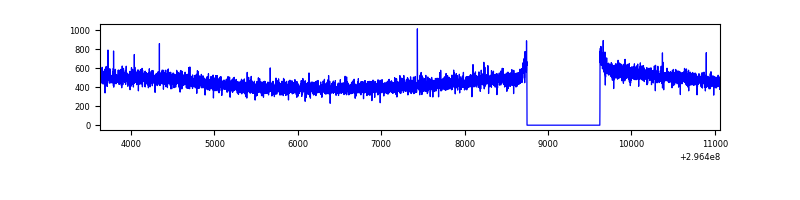 |
| B | 7436 | 6561 | 46 | 46 | 0.62% | 0.70% | 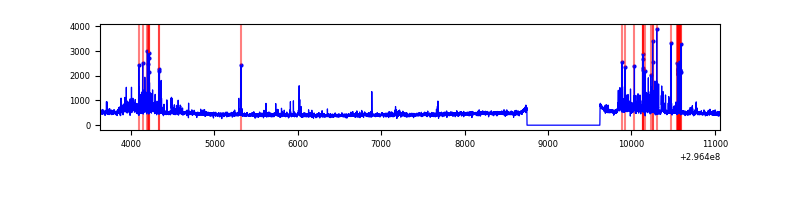 |
| C | 7436 | 6561 | 2 | 2 | 0.03% | 0.03% | 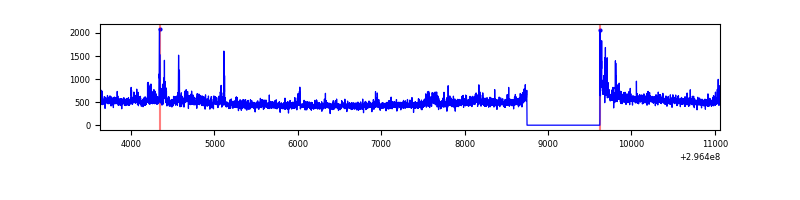 |
| D | 7436 | 6561 | 332 | 332 | 4.46% | 5.06% | 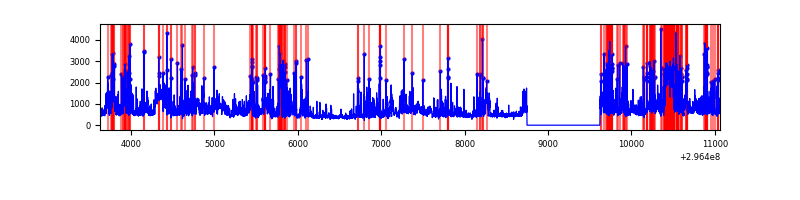 |
Top three noisy pixels from each quadrant. If the there are fewer than three noisy pixels in the level2.evt file, extra rows are filled as -1
| Pixel properties | Quadrant properties | ||||||
|---|---|---|---|---|---|---|---|
| Quadrant | DetID | PixID | Counts | Sigma | Mean | Median | Sigma |
| A | 0 | 226 | 6764 | 38.29 | 773 | 756 | 156.9 |
| A | 13 | 254 | 6520 | 36.74 | 773 | 756 | 156.9 |
| A | 3 | 137 | 6007 | 33.47 | 773 | 756 | 156.9 |
| B | 7 | 220 | 377484 | 2563.72 | 768 | 749 | 146.9 |
| B | 0 | 197 | 29060 | 192.66 | 768 | 749 | 146.9 |
| B | 12 | 111 | 17165 | 111.71 | 768 | 749 | 146.9 |
| C | 3 | 233 | 286509 | 1643.53 | 746 | 750 | 173.9 |
| C | 14 | 238 | 117554 | 671.79 | 746 | 750 | 173.9 |
| C | 13 | 61 | 5361 | 26.52 | 746 | 750 | 173.9 |
| D | 1 | 52 | 2050347 | 11471.3 | 730 | 708 | 178.7 |
| D | 12 | 233 | 300847 | 1679.8 | 730 | 708 | 178.7 |
| D | 7 | 38 | 110616 | 615.12 | 730 | 708 | 178.7 |
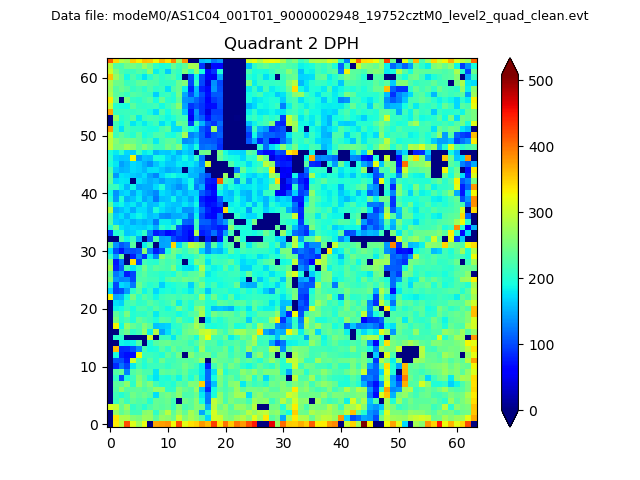
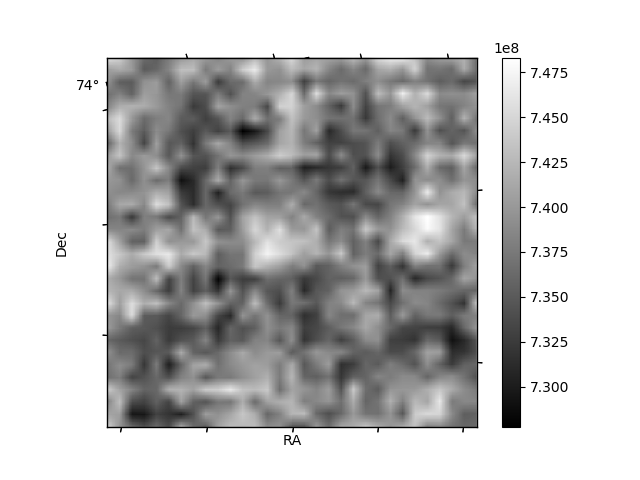
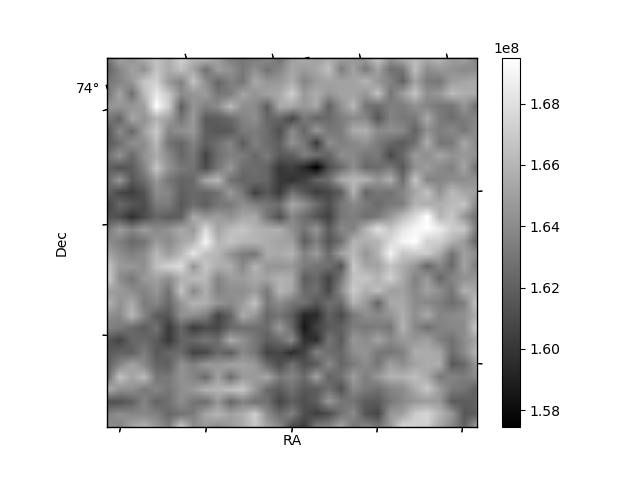
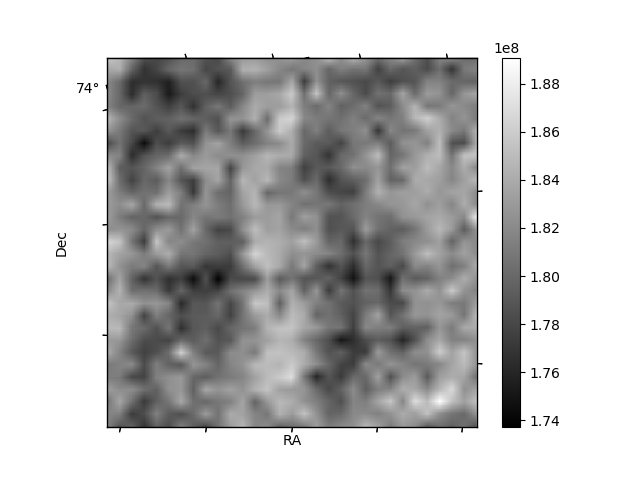
Histogram calculated using DETX and DETY for each event in the final _common_clean file
| Quadrant A | 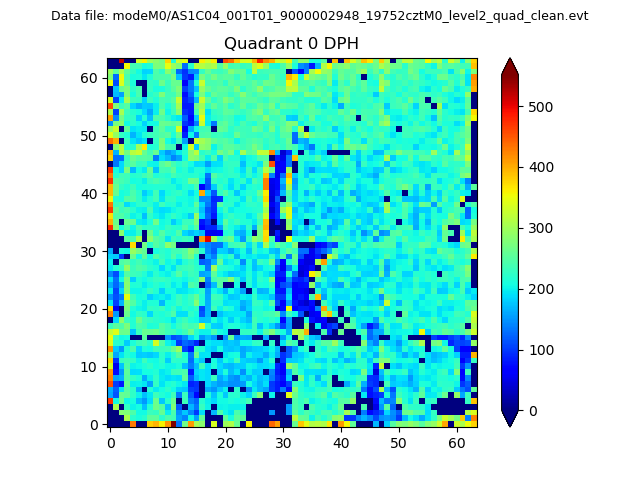 |
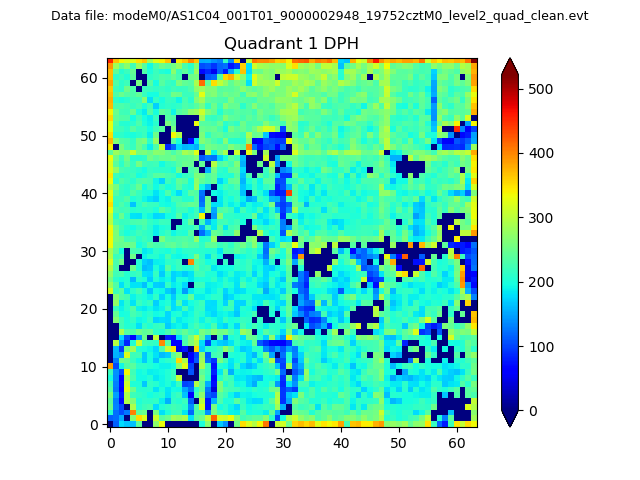 |
Quadrant B |
|---|---|---|---|
| Quadrant D | 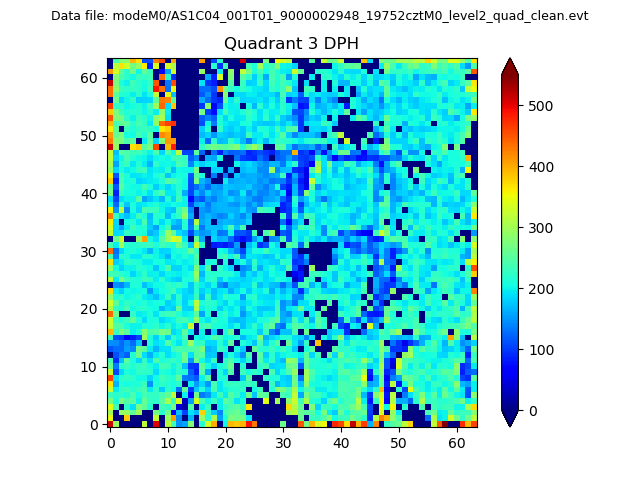 |
 |
Quadrant C |
| Plot type | Count rate plots | Images |
|---|---|---|
| Comparison with Poisson distribution Blue bars denote a histogram of data divided into 1 sec bins. Red curve is a Poisson curve with rate = median count rate of data. |
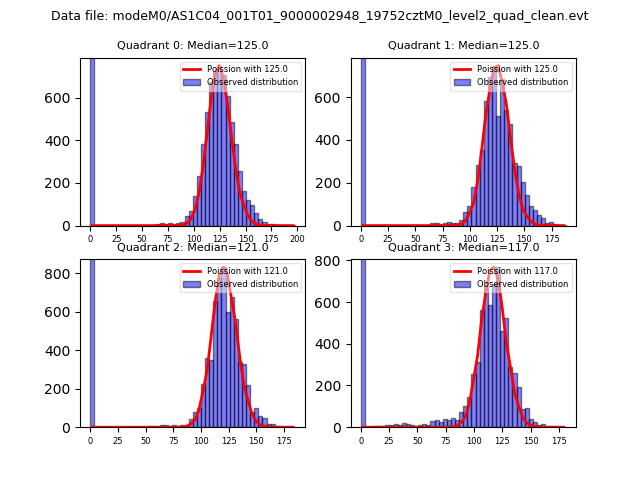 |
 |
| Quadrant-wise count rates Data is divided into 100 sec bins |
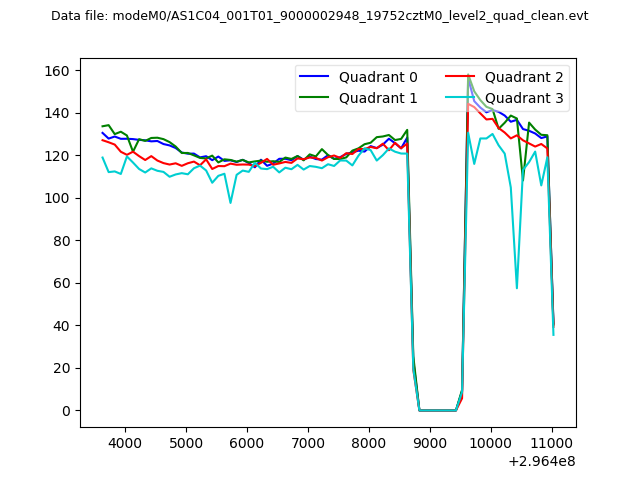 |
|
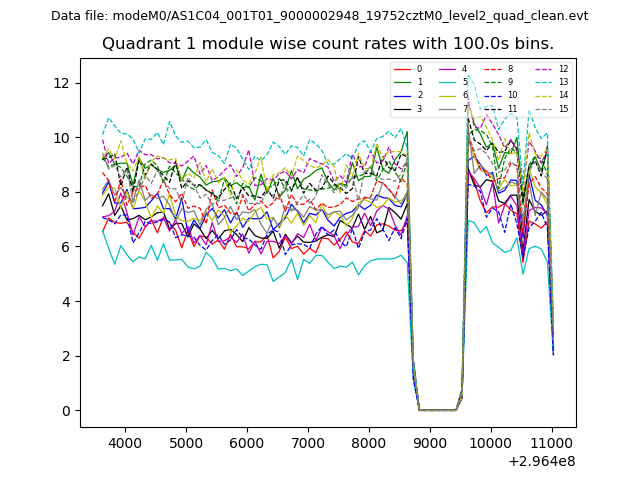
| Module-wise count rates for Quadrant A Data is divided into 100 sec bins |
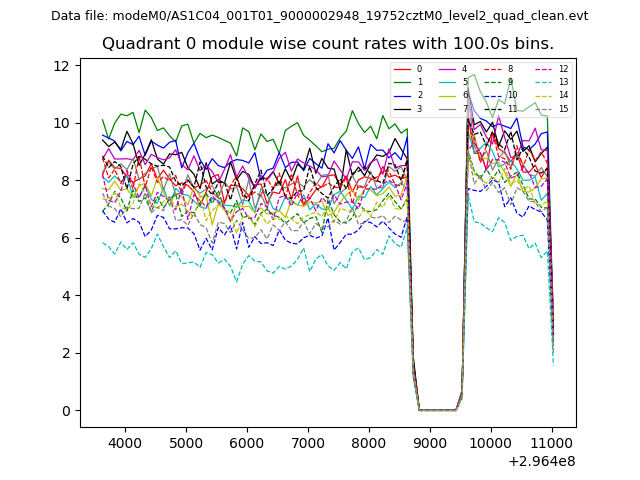 |
 |
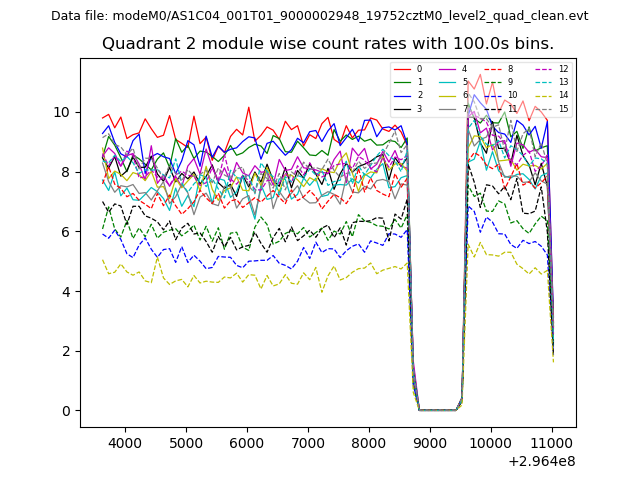
| Module-wise count rates for Quadrant B Data is divided into 100 sec bins |
 |
 |
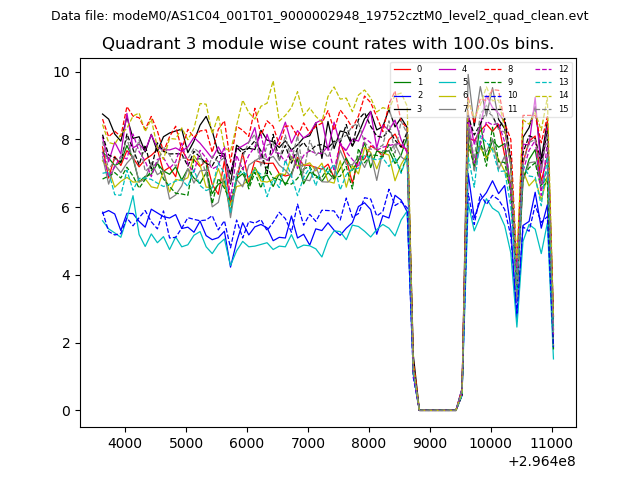
| Module-wise count rates for Quadrant C Data is divided into 100 sec bins |
 |
 |
| Module-wise count rates for Quadrant D Data is divided into 100 sec bins |
 |
 |
| Parameter | Plot |
|---|---|
| CZT HV Monitor | 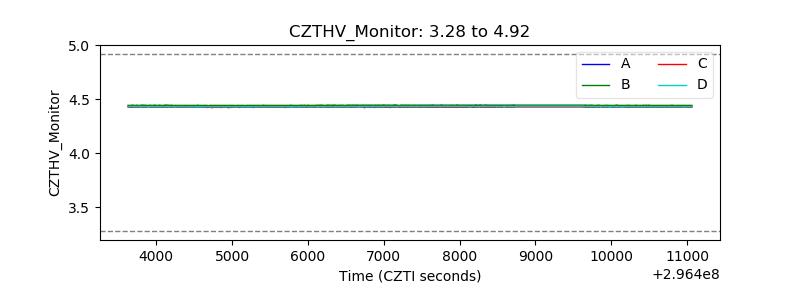 |
| D_VDD | 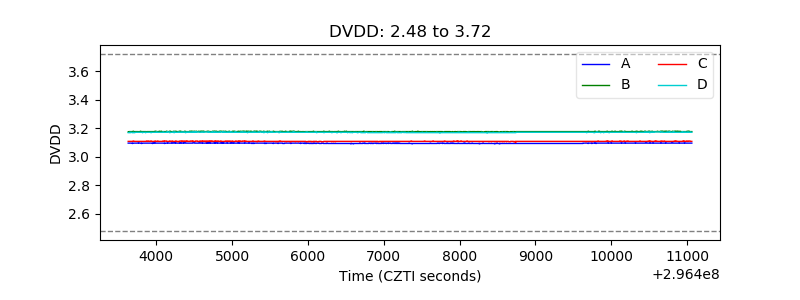 |
| Temperature 1 | 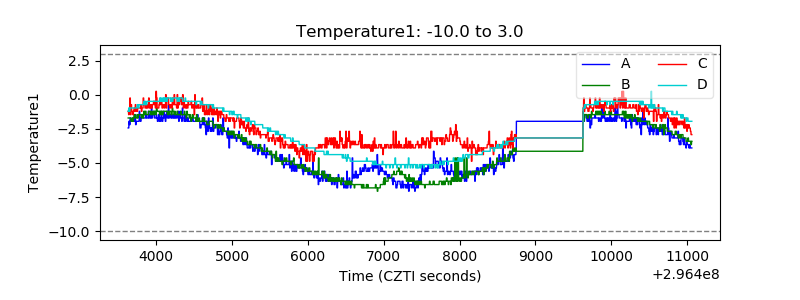 |
| Veto HV Monitor | 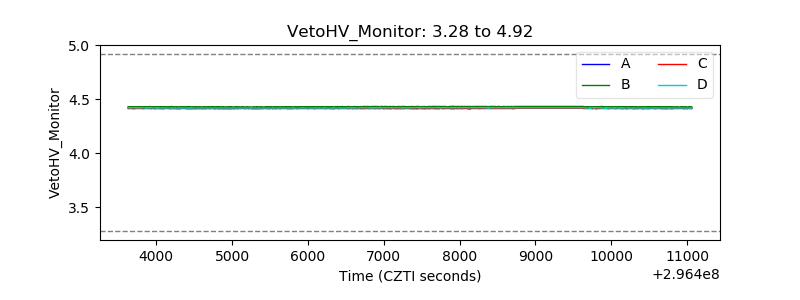 |
| Veto LLD | 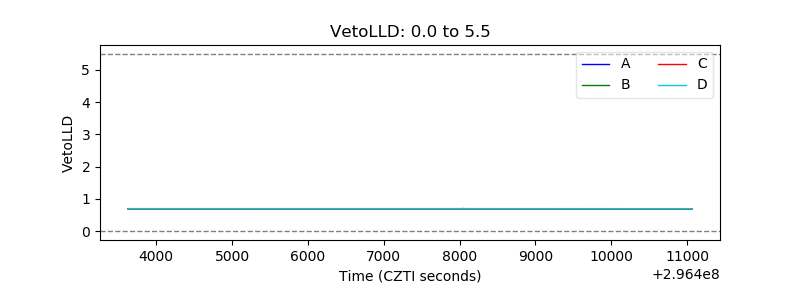 |
| Alpha Counter | 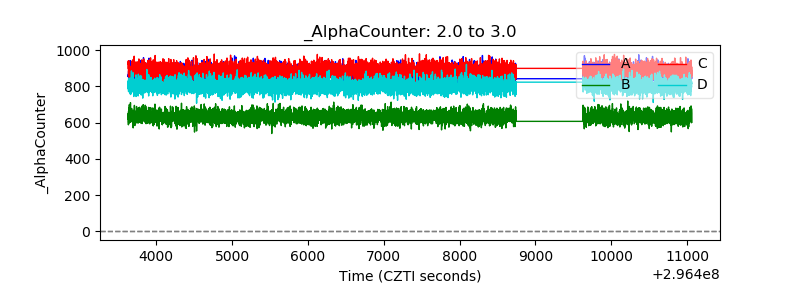 |
| _CPM_Rate | 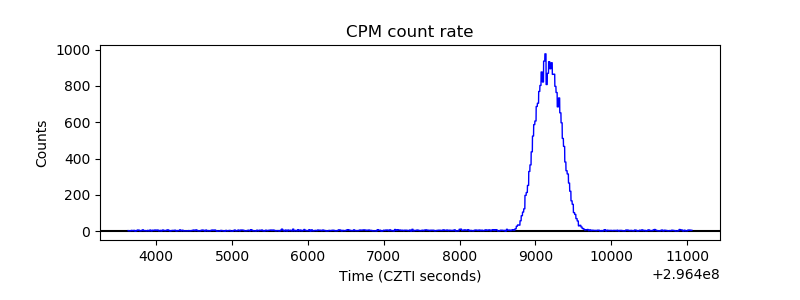 |
| CZT Counter | 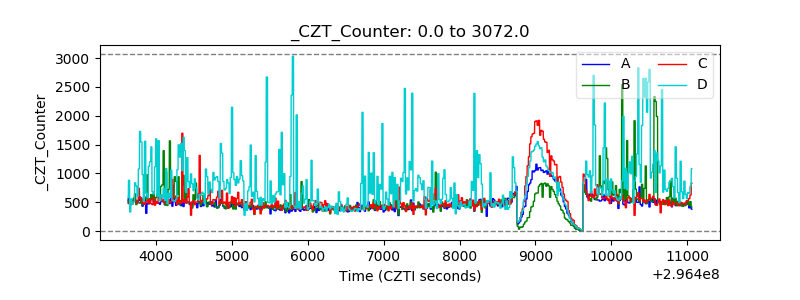 |
| +2.5 Volts monitor | 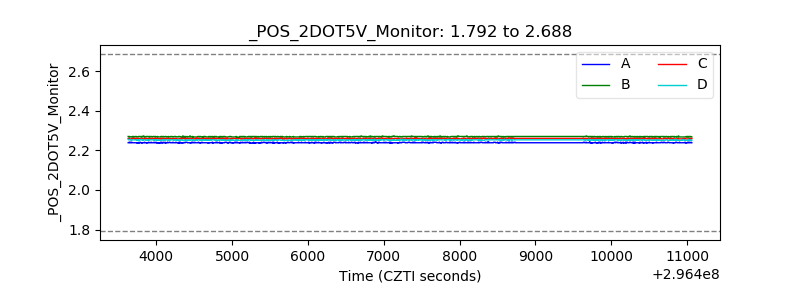 |
| +5 Volts monitor |  |
| _ROLL_ROT | 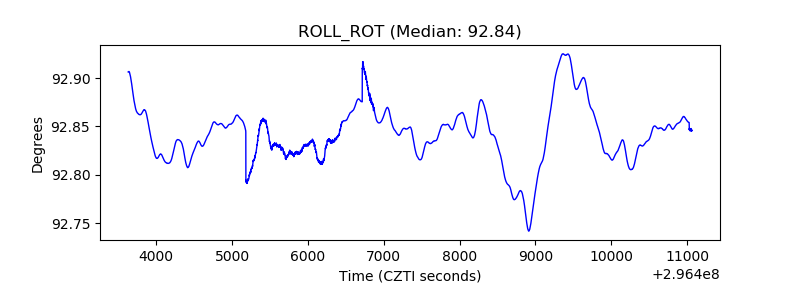 |
| _Roll_DEC | 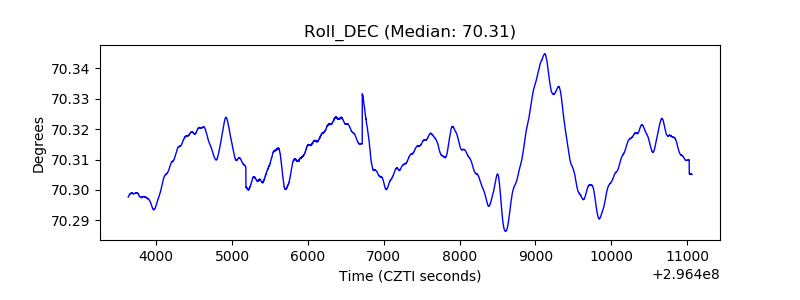 |
| _Roll_RA | 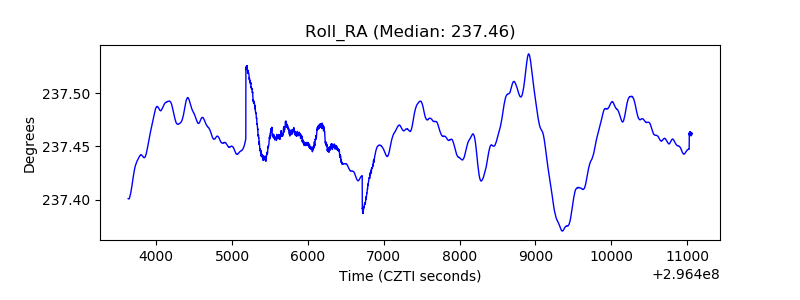 |
| Veto Counter | 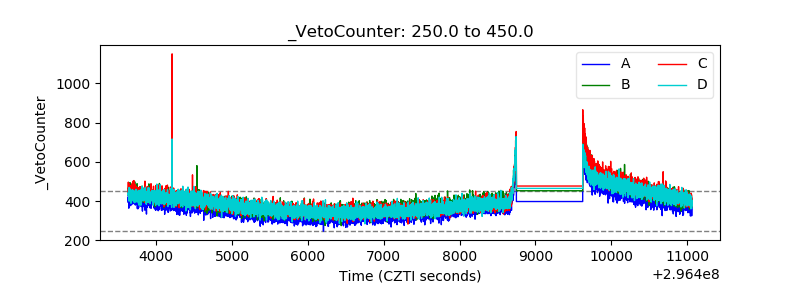 |