| Param | Original file | Final file |
|---|---|---|
| Filename | modeM0/AS1C04_009T05_9000002946cztM0_level2.fits | modeM0/AS1C04_009T05_9000002946cztM0_level2_quad_clean.evt |
| Size (bytes) | 52,223,040 | 46,820,160 |
| Size | 49.8 MB | 44.7 MB |
| Events in quadrant A | 314,662 | 265,566 |
| Events in quadrant B | 303,426 | 264,549 |
| Events in quadrant C | 305,272 | 259,676 |
| Events in quadrant D | 257,122 | 226,036 |
| Mode SS | |||
|---|---|---|---|
| Quadrant | BADHDUFLAG | Total packets | Discarded packets |
| A | 0 | 118 | 0 |
| B | 0 | 118 | 0 |
| C | 0 | 118 | 0 |
| D | 0 | 118 | 0 |
| Mode M9 | |||
|---|---|---|---|
| Quadrant | BADHDUFLAG | Total packets | Discarded packets |
| A | 0 | 4 | 0 |
| B | 0 | 4 | 0 |
| C | 0 | 4 | 0 |
| D | 0 | 4 | 0 |
| Mode M0 | |||
|---|---|---|---|
| Quadrant | BADHDUFLAG | Total packets | Discarded packets |
| A | 0 | 11652 | 0 |
| B | 0 | 12047 | 0 |
| C | 0 | 12362 | 0 |
| D | 0 | 16275 | 0 |
| Quadrant | Total seconds | Saturated seconds | Saturation percentage |
|---|---|---|---|
| A | 5740 | 69 | 1.202091% |
| B | 5740 | 70 | 1.219512% |
| C | 5740 | 109 | 1.898955% |
| D | 5740 | 453 | 7.891986% |
Noise dominated data is calculated using 1-second bins in cleaned event files. If a bin has >2000 counts, and if more than 50% of those come from <1% of pixels, then it is considered to be noise-dominated and hence unusable.
| Quadrant | # 1 sec bins | Bins with >0 counts | Bins with >2000 counts | High rate bins dominated by noise | Noise dominated (total time) | Noise dominated (detector-on time) | Marked lightcurve |
|---|---|---|---|---|---|---|---|
| A | 5753 | 5738 | 0 | 0 | 0.00% | 0.00% |  |
| B | 5753 | 5738 | 0 | 0 | 0.00% | 0.00% |  |
| C | 5753 | 5738 | 0 | 0 | 0.00% | 0.00% |  |
| D | 5753 | 5712 | 0 | 0 | 0.00% | 0.00% |  |
Top three noisy pixels from each quadrant. If the there are fewer than three noisy pixels in the level2.evt file, extra rows are filled as -1
| Pixel properties | Quadrant properties | ||||||
|---|---|---|---|---|---|---|---|
| Quadrant | DetID | PixID | Counts | Sigma | Mean | Median | Sigma |
| A | 0 | 29 | 333 | 11.17 | 82 | 76 | 23.0 |
| A | 9 | 19 | 258 | 7.91 | 82 | 76 | 23.0 |
| A | 0 | 30 | 254 | 7.74 | 82 | 76 | 23.0 |
| B | 2 | 9 | 249 | 9.39 | 80 | 76 | 18.4 |
| B | 2 | 8 | 220 | 7.82 | 80 | 76 | 18.4 |
| B | 14 | 254 | 215 | 7.54 | 80 | 76 | 18.4 |
| C | 12 | 241 | 252 | 7.92 | 80 | 75 | 22.3 |
| C | 1 | 80 | 224 | 6.67 | 80 | 75 | 22.3 |
| C | 9 | 233 | 220 | 6.49 | 80 | 75 | 22.3 |
| D | 1 | 3 | 195 | 6.11 | 73 | 67 | 20.9 |
| D | 15 | 142 | 190 | 5.87 | 73 | 67 | 20.9 |
| D | 3 | 14 | 188 | 5.78 | 73 | 67 | 20.9 |
Histogram calculated using DETX and DETY for each event in the final _common_clean file
| Quadrant A |  |
 |
Quadrant B |
|---|---|---|---|
| Quadrant D |  |
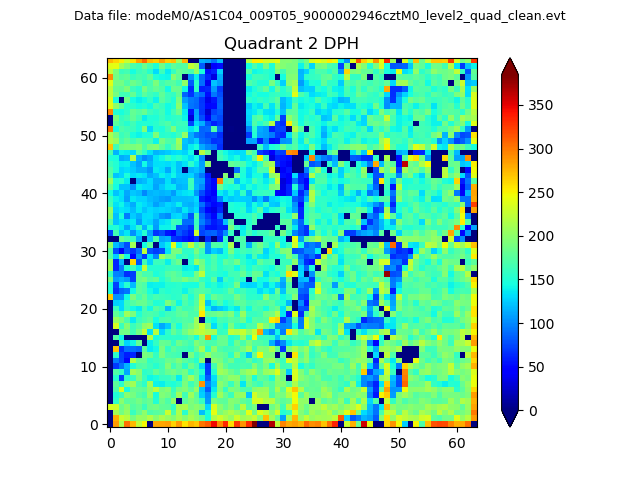 |
Quadrant C |
| Plot type | Count rate plots | Images |
|---|---|---|
| Comparison with Poisson distribution Blue bars denote a histogram of data divided into 1 sec bins. Red curve is a Poisson curve with rate = median count rate of data. |
 |
 |
| Quadrant-wise count rates Data is divided into 100 sec bins |
 |
|
| Module-wise count rates for Quadrant A Data is divided into 100 sec bins |
 |
 |
| Module-wise count rates for Quadrant B Data is divided into 100 sec bins |
 |
 |
| Module-wise count rates for Quadrant C Data is divided into 100 sec bins |
 |
 |
| Module-wise count rates for Quadrant D Data is divided into 100 sec bins |
 |
 |
| Parameter | Plot |
|---|---|
| CZT HV Monitor |  |
| D_VDD |  |
| Temperature 1 |  |
| Veto HV Monitor |  |
| Veto LLD |  |
| Alpha Counter |  |
| _CPM_Rate |  |
| CZT Counter |  |
| +2.5 Volts monitor |  |
| +5 Volts monitor |  |
| _ROLL_ROT |  |
| _Roll_DEC |  |
| _Roll_RA |  |
| Veto Counter |  |