| Param | Original file | Final file |
|---|---|---|
| Filename | modeM0/AS1C04_009T05_9000002946_19737cztM0_level2.evt | modeM0/AS1C04_009T05_9000002946_19737cztM0_level2_quad_clean.evt |
| Size (bytes) | 422,700,480 | 103,242,240 |
| Size | 403.1 MB | 98.5 MB |
| Events in quadrant A | 2,562,765 | 699,041 |
| Events in quadrant B | 2,765,707 | 706,582 |
| Events in quadrant C | 2,925,434 | 676,279 |
| Events in quadrant D | 4,157,293 | 643,577 |
| Mode SS | |||
|---|---|---|---|
| Quadrant | BADHDUFLAG | Total packets | Discarded packets |
| A | 0 | 118 | 0 |
| B | 0 | 118 | 0 |
| C | 0 | 118 | 0 |
| D | 0 | 118 | 0 |
| Mode M9 | |||
|---|---|---|---|
| Quadrant | BADHDUFLAG | Total packets | Discarded packets |
| A | 0 | 4 | 0 |
| B | 0 | 4 | 0 |
| C | 0 | 4 | 0 |
| D | 0 | 4 | 0 |
| Mode M0 | |||
|---|---|---|---|
| Quadrant | BADHDUFLAG | Total packets | Discarded packets |
| A | 0 | 11653 | 1 |
| B | 0 | 12048 | 1 |
| C | 0 | 12363 | 1 |
| D | 0 | 16276 | 1 |
| Quadrant | Total seconds | Saturated seconds | Saturation percentage |
|---|---|---|---|
| A | 5740 | 69 | 1.202091% |
| B | 5740 | 70 | 1.219512% |
| C | 5740 | 109 | 1.898955% |
| D | 5740 | 453 | 7.891986% |
Noise dominated data is calculated using 1-second bins in cleaned event files. If a bin has >2000 counts, and if more than 50% of those come from <1% of pixels, then it is considered to be noise-dominated and hence unusable.
| Quadrant | # 1 sec bins | Bins with >0 counts | Bins with >2000 counts | High rate bins dominated by noise | Noise dominated (total time) | Noise dominated (detector-on time) | Marked lightcurve |
|---|---|---|---|---|---|---|---|
| A | 5754 | 5740 | 0 | 0 | 0.00% | 0.00% | 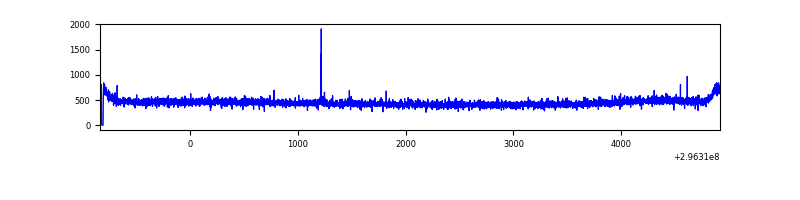 |
| B | 5754 | 5740 | 9 | 9 | 0.16% | 0.16% | 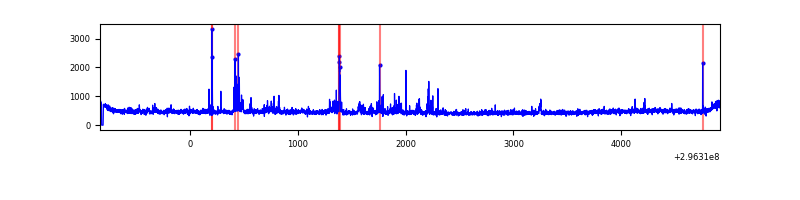 |
| C | 5754 | 5740 | 1 | 1 | 0.02% | 0.02% | 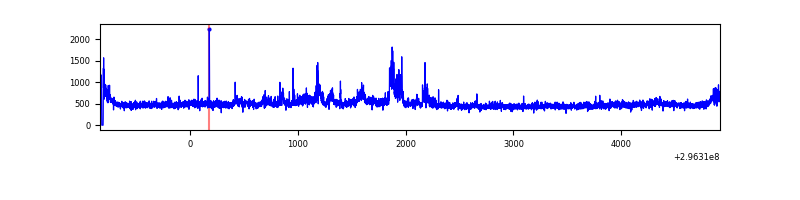 |
| D | 5754 | 5740 | 313 | 313 | 5.44% | 5.45% | 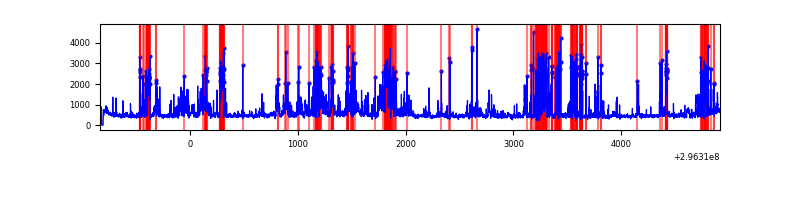 |
Top three noisy pixels from each quadrant. If the there are fewer than three noisy pixels in the level2.evt file, extra rows are filled as -1
| Pixel properties | Quadrant properties | ||||||
|---|---|---|---|---|---|---|---|
| Quadrant | DetID | PixID | Counts | Sigma | Mean | Median | Sigma |
| A | 0 | 254 | 8277 | 56.7 | 661 | 644 | 134.6 |
| A | 13 | 254 | 5984 | 39.67 | 661 | 644 | 134.6 |
| A | 0 | 226 | 5759 | 37.99 | 661 | 644 | 134.6 |
| B | 7 | 220 | 50755 | 399.44 | 658 | 640 | 125.5 |
| B | 4 | 216 | 48152 | 378.69 | 658 | 640 | 125.5 |
| B | 4 | 171 | 34945 | 273.43 | 658 | 640 | 125.5 |
| C | 3 | 233 | 341733 | 2293.4 | 632 | 634 | 148.7 |
| C | 14 | 238 | 97967 | 654.42 | 632 | 634 | 148.7 |
| C | 7 | 247 | 19676 | 128.03 | 632 | 634 | 148.7 |
| D | 1 | 52 | 1108812 | 7442.28 | 620 | 602 | 148.9 |
| D | 7 | 238 | 528075 | 3542.29 | 620 | 602 | 148.9 |
| D | 12 | 218 | 110351 | 737.03 | 620 | 602 | 148.9 |
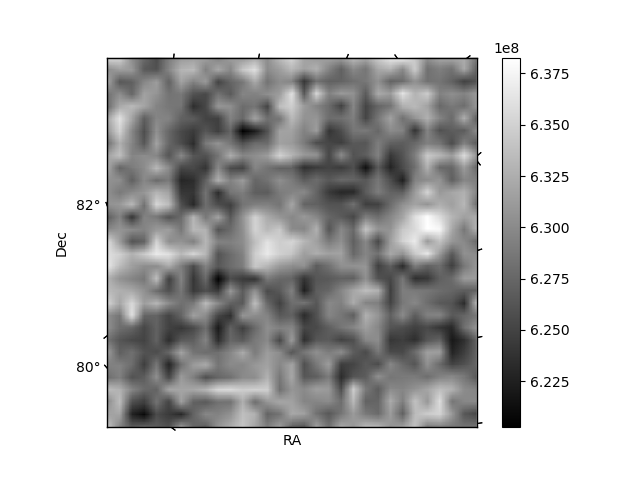
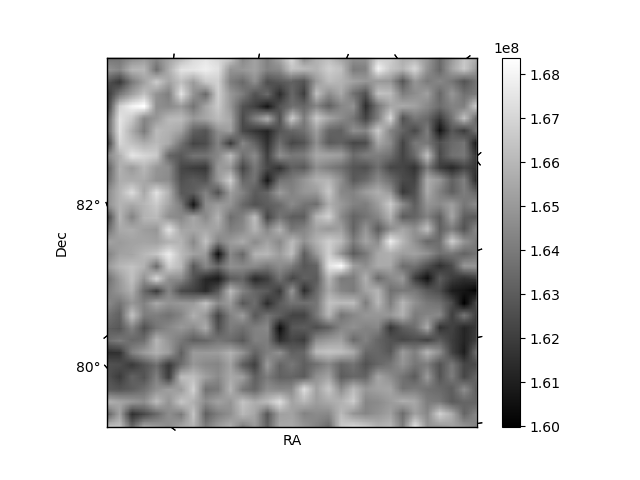
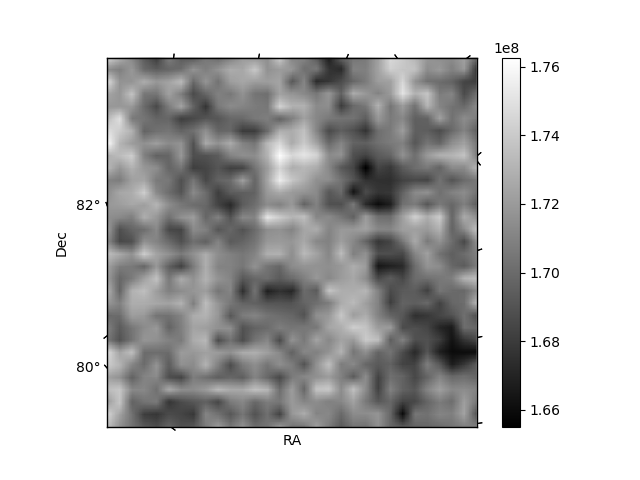
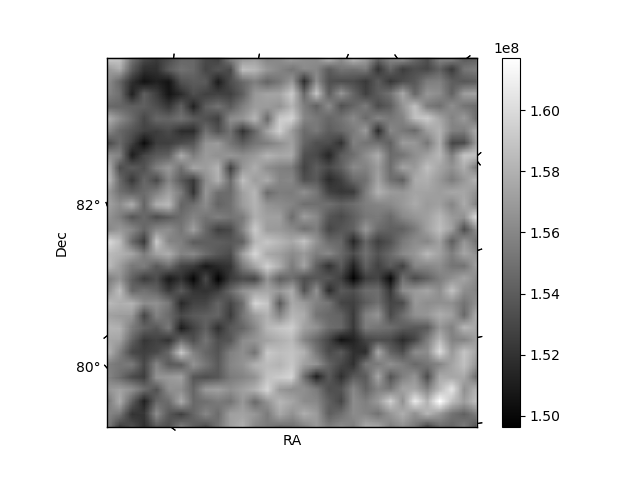
Histogram calculated using DETX and DETY for each event in the final _common_clean file
| Quadrant A | 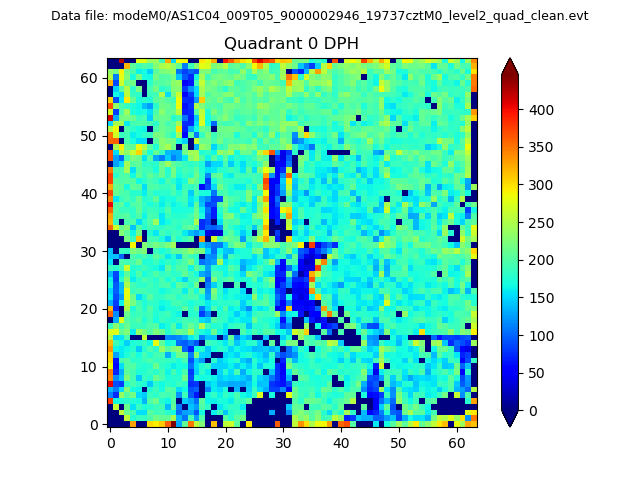 |
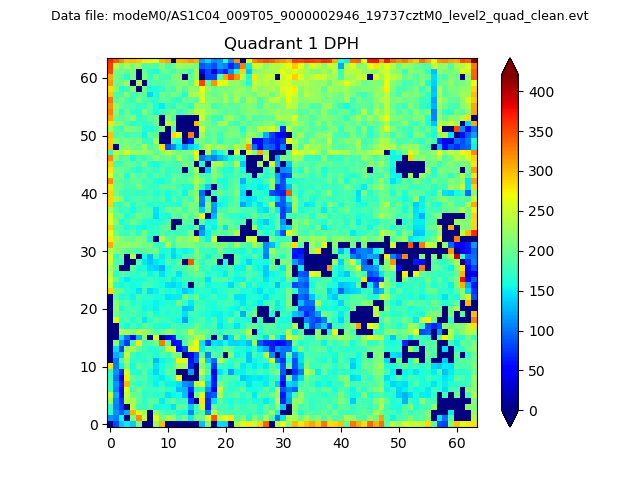 |
Quadrant B |
|---|---|---|---|
| Quadrant D | 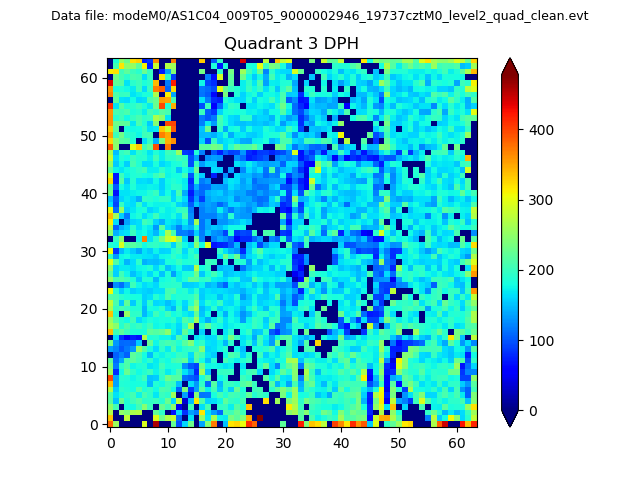 |
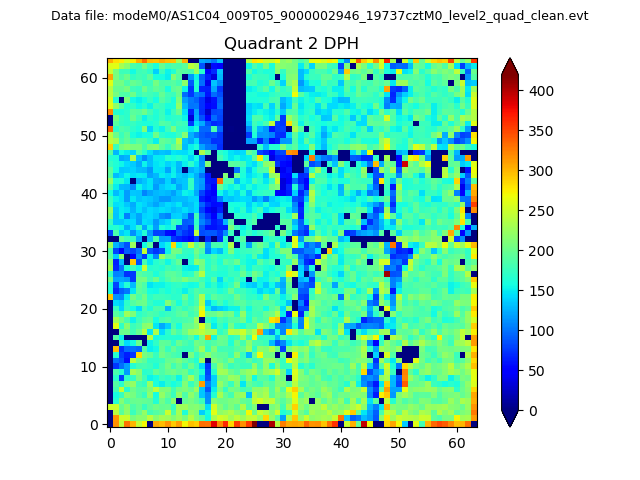 |
Quadrant C |
| Plot type | Count rate plots | Images |
|---|---|---|
| Comparison with Poisson distribution Blue bars denote a histogram of data divided into 1 sec bins. Red curve is a Poisson curve with rate = median count rate of data. |
 |
 |
| Quadrant-wise count rates Data is divided into 100 sec bins |
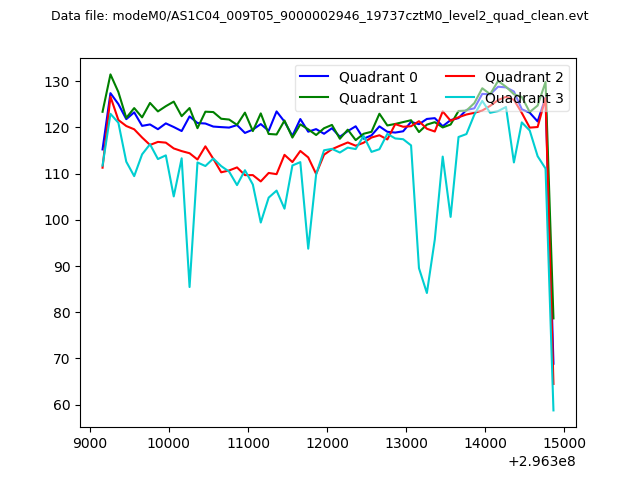 |
|
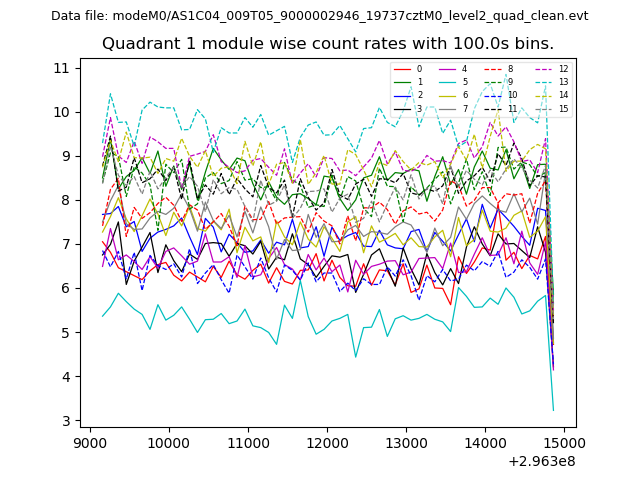
| Module-wise count rates for Quadrant A Data is divided into 100 sec bins |
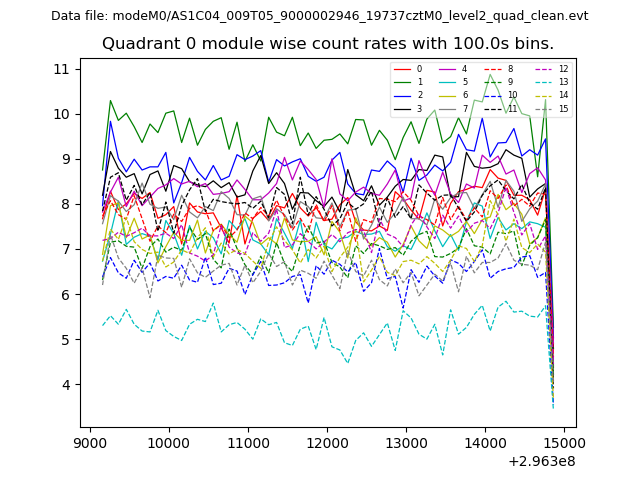 |
 |
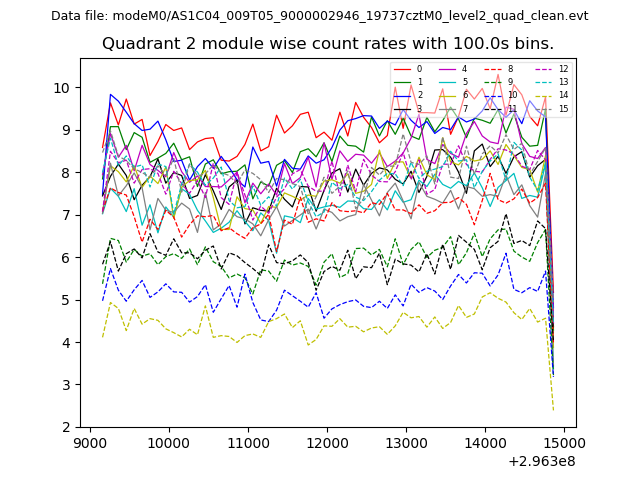
| Module-wise count rates for Quadrant B Data is divided into 100 sec bins |
 |
 |
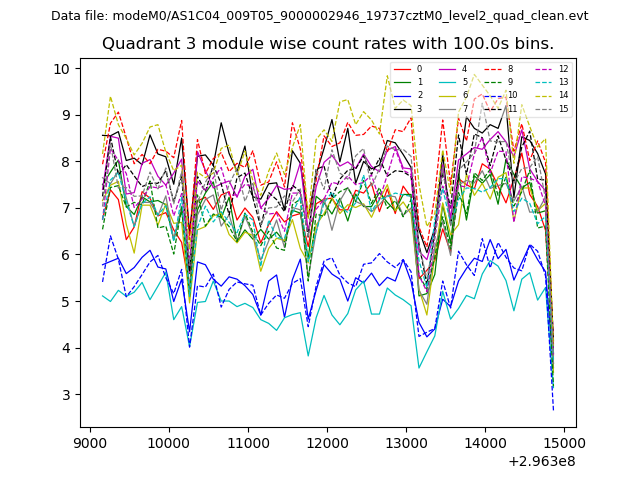
| Module-wise count rates for Quadrant C Data is divided into 100 sec bins |
 |
 |
| Module-wise count rates for Quadrant D Data is divided into 100 sec bins |
 |
 |
| Parameter | Plot |
|---|---|
| CZT HV Monitor | 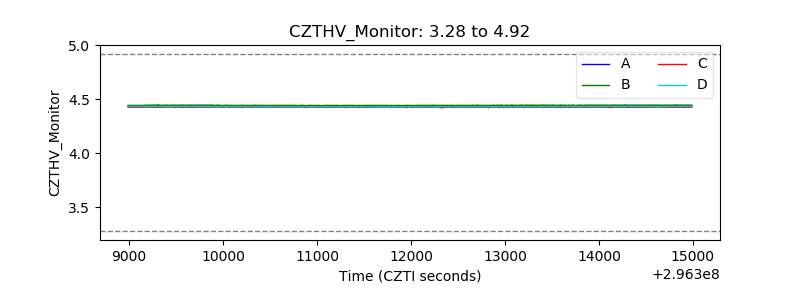 |
| D_VDD | 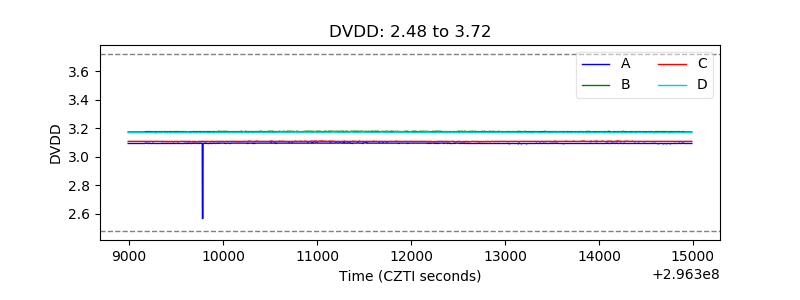 |
| Temperature 1 | 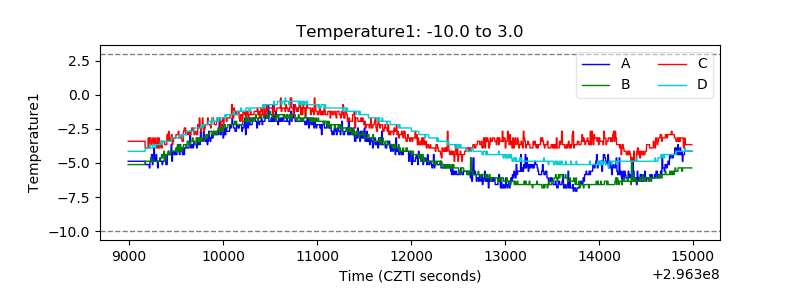 |
| Veto HV Monitor |  |
| Veto LLD | 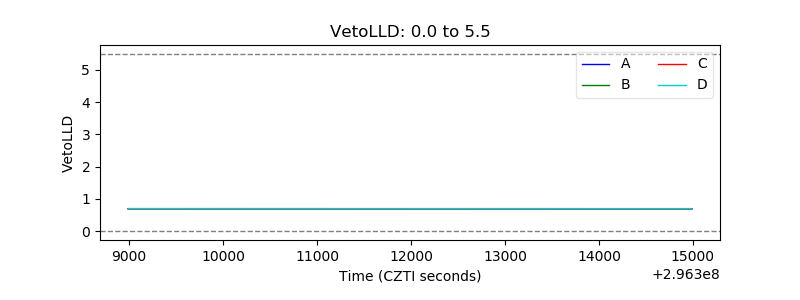 |
| Alpha Counter | 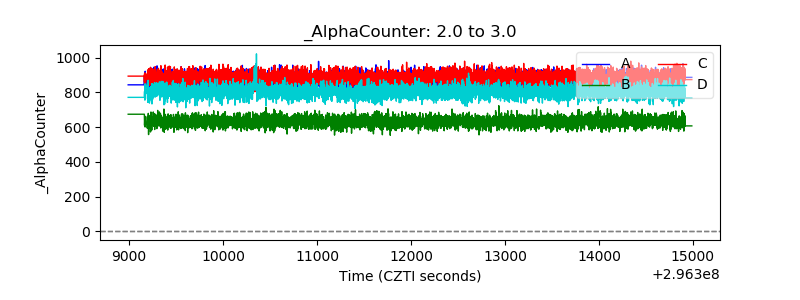 |
| _CPM_Rate | 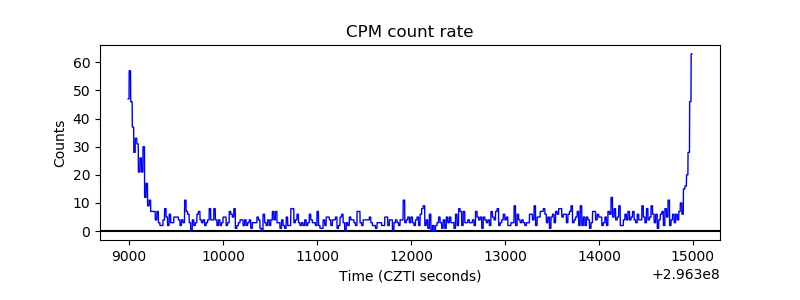 |
| CZT Counter | 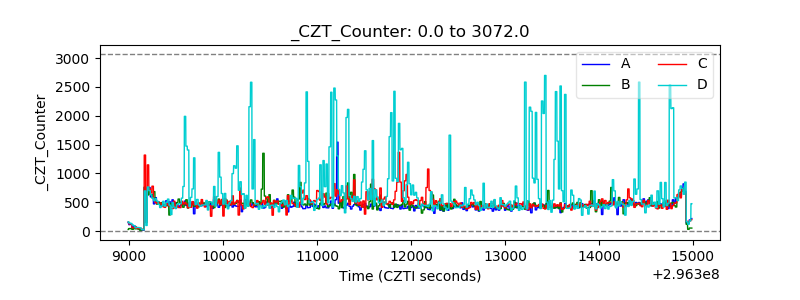 |
| +2.5 Volts monitor |  |
| +5 Volts monitor |  |
| _ROLL_ROT |  |
| _Roll_DEC | 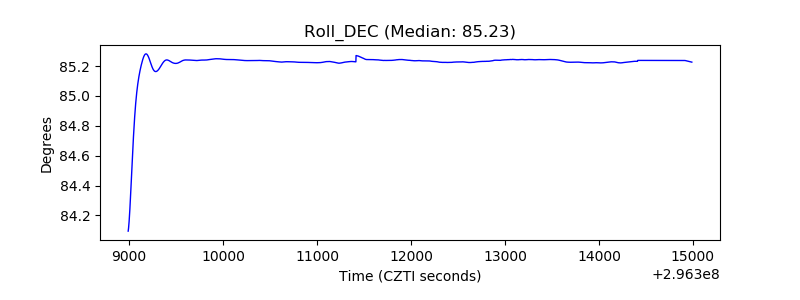 |
| _Roll_RA | 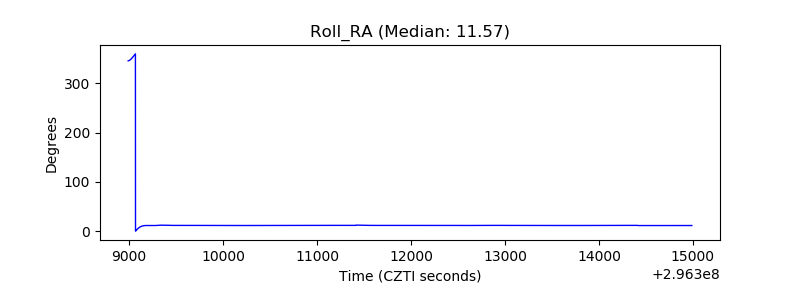 |
| Veto Counter | 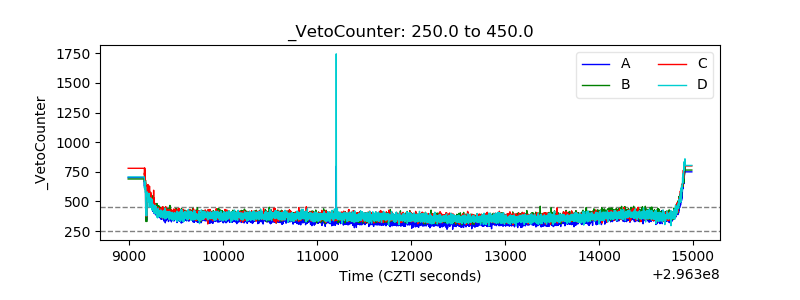 |