| Param | Original file | Final file |
|---|---|---|
| Filename | modeM0/AS1A05_022T08_9000002950cztM0_level2.fits | modeM0/AS1A05_022T08_9000002950cztM0_level2_quad_clean.evt |
| Size (bytes) | 330,433,920 | 189,184,320 |
| Size | 315.1 MB | 180.4 MB |
| Events in quadrant A | 2,074,052 | 944,039 |
| Events in quadrant B | 2,005,140 | 950,071 |
| Events in quadrant C | 1,997,630 | 819,782 |
| Events in quadrant D | 1,648,994 | 732,769 |
| Mode SS | |||
|---|---|---|---|
| Quadrant | BADHDUFLAG | Total packets | Discarded packets |
| A | 0 | 676 | 0 |
| B | 0 | 676 | 0 |
| C | 0 | 676 | 0 |
| D | 0 | 676 | 0 |
| Mode M9 | |||
|---|---|---|---|
| Quadrant | BADHDUFLAG | Total packets | Discarded packets |
| A | 0 | 68 | 0 |
| B | 0 | 68 | 0 |
| C | 0 | 68 | 0 |
| D | 0 | 68 | 0 |
| Mode M0 | |||
|---|---|---|---|
| Quadrant | BADHDUFLAG | Total packets | Discarded packets |
| A | 0 | 69270 | 0 |
| B | 0 | 72706 | 0 |
| C | 0 | 95694 | 0 |
| D | 0 | 103580 | 0 |
| Quadrant | Total seconds | Saturated seconds | Saturation percentage |
|---|---|---|---|
| A | 33180 | 238 | 0.717300% |
| B | 33180 | 499 | 1.503918% |
| C | 33180 | 1386 | 4.177215% |
| D | 33180 | 3483 | 10.497288% |
Noise dominated data is calculated using 1-second bins in cleaned event files. If a bin has >2000 counts, and if more than 50% of those come from <1% of pixels, then it is considered to be noise-dominated and hence unusable.
| Quadrant | # 1 sec bins | Bins with >0 counts | Bins with >2000 counts | High rate bins dominated by noise | Noise dominated (total time) | Noise dominated (detector-on time) | Marked lightcurve |
|---|---|---|---|---|---|---|---|
| A | 40010 | 33180 | 0 | 0 | 0.00% | 0.00% |  |
| B | 40010 | 33179 | 0 | 0 | 0.00% | 0.00% |  |
| C | 40010 | 33178 | 0 | 0 | 0.00% | 0.00% |  |
| D | 40010 | 32956 | 0 | 0 | 0.00% | 0.00% |  |
Top three noisy pixels from each quadrant. If the there are fewer than three noisy pixels in the level2.evt file, extra rows are filled as -1
| Pixel properties | Quadrant properties | ||||||
|---|---|---|---|---|---|---|---|
| Quadrant | DetID | PixID | Counts | Sigma | Mean | Median | Sigma |
| A | 0 | 29 | 2008 | 11.24 | 540 | 509 | 133.4 |
| A | 7 | 110 | 1639 | 8.47 | 540 | 509 | 133.4 |
| A | 0 | 30 | 1547 | 7.78 | 540 | 509 | 133.4 |
| B | 2 | 9 | 1590 | 10.46 | 529 | 506 | 103.6 |
| B | 2 | 8 | 1326 | 7.91 | 529 | 506 | 103.6 |
| B | 5 | 128 | 1326 | 7.91 | 529 | 506 | 103.6 |
| C | 1 | 81 | 1481 | 7.21 | 527 | 494 | 136.9 |
| C | 1 | 80 | 1478 | 7.19 | 527 | 494 | 136.9 |
| C | 3 | 235 | 1347 | 6.23 | 527 | 494 | 136.9 |
| D | 10 | 189 | 1221 | 6.21 | 471 | 429 | 127.5 |
| D | 15 | 46 | 1158 | 5.72 | 471 | 429 | 127.5 |
| D | 3 | 14 | 1158 | 5.72 | 471 | 429 | 127.5 |
Histogram calculated using DETX and DETY for each event in the final _common_clean file
| Quadrant A |  |
 |
Quadrant B |
|---|---|---|---|
| Quadrant D | 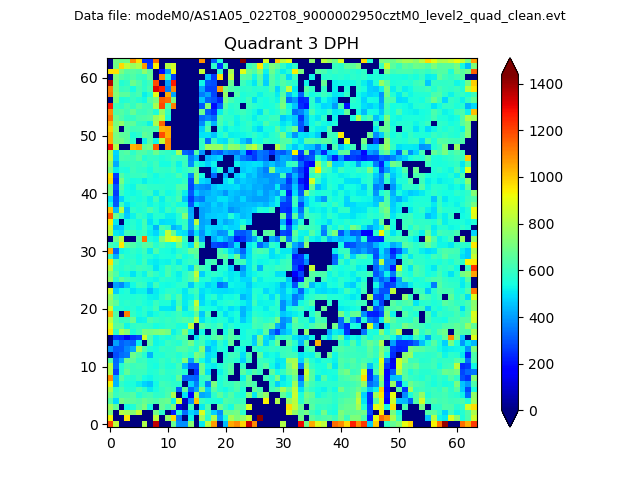 |
 |
Quadrant C |
| Plot type | Count rate plots | Images |
|---|---|---|
| Comparison with Poisson distribution Blue bars denote a histogram of data divided into 1 sec bins. Red curve is a Poisson curve with rate = median count rate of data. |
 |
 |
| Quadrant-wise count rates Data is divided into 100 sec bins |
 |
|
| Module-wise count rates for Quadrant A Data is divided into 100 sec bins |
 |
 |
| Module-wise count rates for Quadrant B Data is divided into 100 sec bins |
 |
 |
| Module-wise count rates for Quadrant C Data is divided into 100 sec bins |
 |
 |
| Module-wise count rates for Quadrant D Data is divided into 100 sec bins |
 |
 |
| Parameter | Plot |
|---|---|
| CZT HV Monitor |  |
| D_VDD |  |
| Temperature 1 |  |
| Veto HV Monitor |  |
| Veto LLD |  |
| Alpha Counter |  |
| _CPM_Rate |  |
| CZT Counter |  |
| +2.5 Volts monitor |  |
| +5 Volts monitor |  |
| _ROLL_ROT |  |
| _Roll_DEC |  |
| _Roll_RA |  |
| Veto Counter |  |