| Param | Original file | Final file |
|---|---|---|
| Filename | modeM0/AS1A05_022T08_9000002950_19756cztM0_level2.evt | modeM0/AS1A05_022T08_9000002950_19756cztM0_level2_quad_clean.evt |
| Size (bytes) | 387,619,200 | 57,268,800 |
| Size | 369.7 MB | 54.6 MB |
| Events in quadrant A | 2,338,081 | 359,387 |
| Events in quadrant B | 2,485,232 | 369,408 |
| Events in quadrant C | 3,459,307 | 344,942 |
| Events in quadrant D | 3,135,526 | 328,550 |
| Mode SS | |||
|---|---|---|---|
| Quadrant | BADHDUFLAG | Total packets | Discarded packets |
| A | 0 | 98 | 0 |
| B | 0 | 98 | 0 |
| C | 0 | 98 | 0 |
| D | 0 | 98 | 0 |
| Mode M9 | |||
|---|---|---|---|
| Quadrant | BADHDUFLAG | Total packets | Discarded packets |
| A | 0 | 12 | 0 |
| B | 0 | 12 | 0 |
| C | 0 | 12 | 0 |
| D | 0 | 12 | 0 |
| Mode M0 | |||
|---|---|---|---|
| Quadrant | BADHDUFLAG | Total packets | Discarded packets |
| A | 0 | 9981 | 1 |
| B | 0 | 10383 | 1 |
| C | 0 | 13681 | 1 |
| D | 0 | 12589 | 1 |
| Quadrant | Total seconds | Saturated seconds | Saturation percentage |
|---|---|---|---|
| A | 4717 | 47 | 0.996396% |
| B | 4716 | 79 | 1.675148% |
| C | 4716 | 106 | 2.247668% |
| D | 4716 | 159 | 3.371501% |
Noise dominated data is calculated using 1-second bins in cleaned event files. If a bin has >2000 counts, and if more than 50% of those come from <1% of pixels, then it is considered to be noise-dominated and hence unusable.
| Quadrant | # 1 sec bins | Bins with >0 counts | Bins with >2000 counts | High rate bins dominated by noise | Noise dominated (total time) | Noise dominated (detector-on time) | Marked lightcurve |
|---|---|---|---|---|---|---|---|
| A | 5972 | 4718 | 0 | 0 | 0.00% | 0.00% | 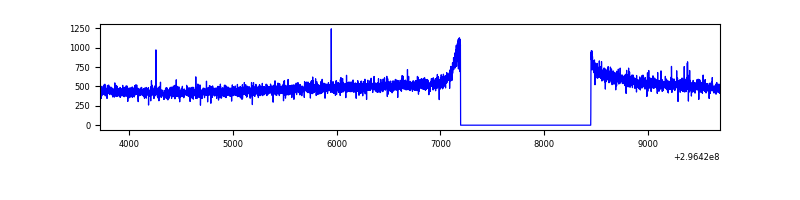 |
| B | 5971 | 4717 | 7 | 7 | 0.12% | 0.15% | 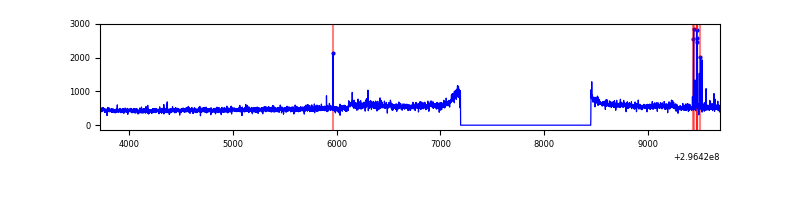 |
| C | 5971 | 4717 | 14 | 14 | 0.23% | 0.30% | 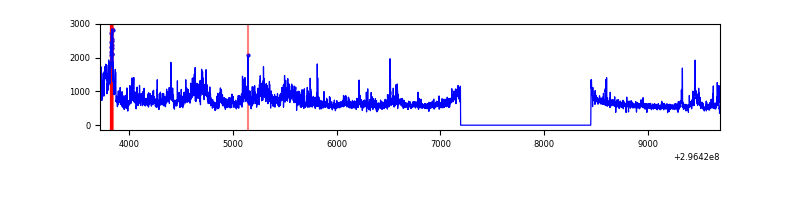 |
| D | 5971 | 4717 | 106 | 106 | 1.78% | 2.25% | 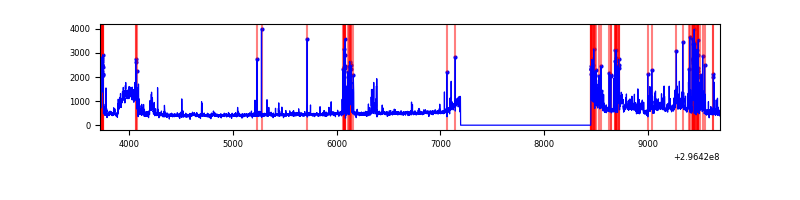 |
Top three noisy pixels from each quadrant. If the there are fewer than three noisy pixels in the level2.evt file, extra rows are filled as -1
| Pixel properties | Quadrant properties | ||||||
|---|---|---|---|---|---|---|---|
| Quadrant | DetID | PixID | Counts | Sigma | Mean | Median | Sigma |
| A | 0 | 226 | 5405 | 39.13 | 605 | 594 | 123.0 |
| A | 9 | 143 | 5318 | 38.42 | 605 | 594 | 123.0 |
| A | 3 | 137 | 4704 | 33.43 | 605 | 594 | 123.0 |
| B | 0 | 198 | 59048 | 500.23 | 609 | 594 | 116.9 |
| B | 7 | 220 | 31066 | 260.77 | 609 | 594 | 116.9 |
| B | 12 | 111 | 13714 | 112.28 | 609 | 594 | 116.9 |
| C | 3 | 233 | 1104657 | 8144.16 | 580 | 584 | 135.6 |
| C | 14 | 238 | 89800 | 658.1 | 580 | 584 | 135.6 |
| C | 13 | 61 | 4115 | 26.05 | 580 | 584 | 135.6 |
| D | 1 | 52 | 377119 | 2689.12 | 577 | 563 | 140.0 |
| D | 7 | 238 | 250962 | 1788.19 | 577 | 563 | 140.0 |
| D | 12 | 218 | 196075 | 1396.22 | 577 | 563 | 140.0 |
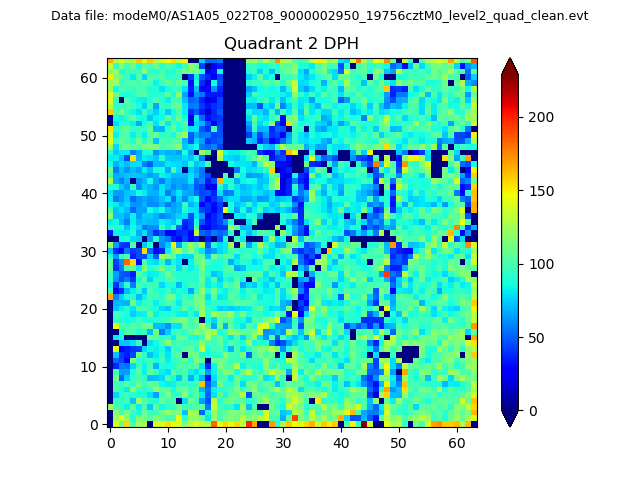
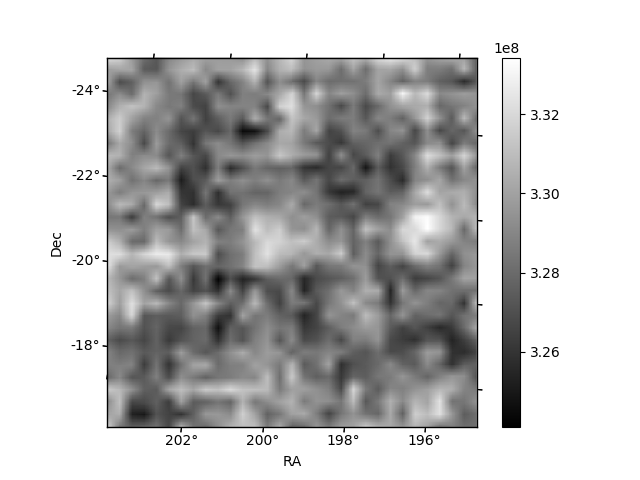
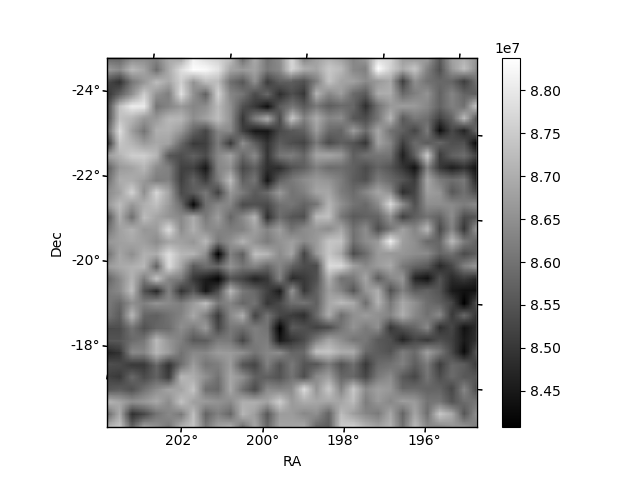
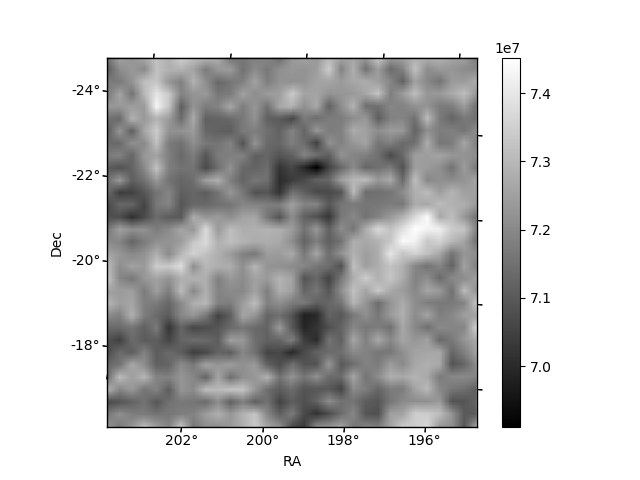
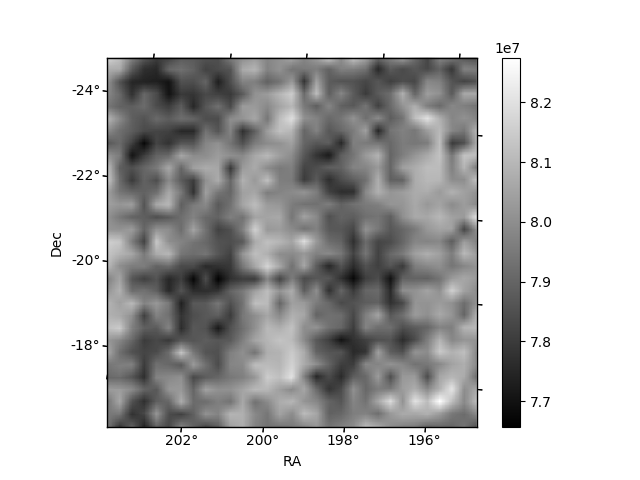
Histogram calculated using DETX and DETY for each event in the final _common_clean file
| Quadrant A | 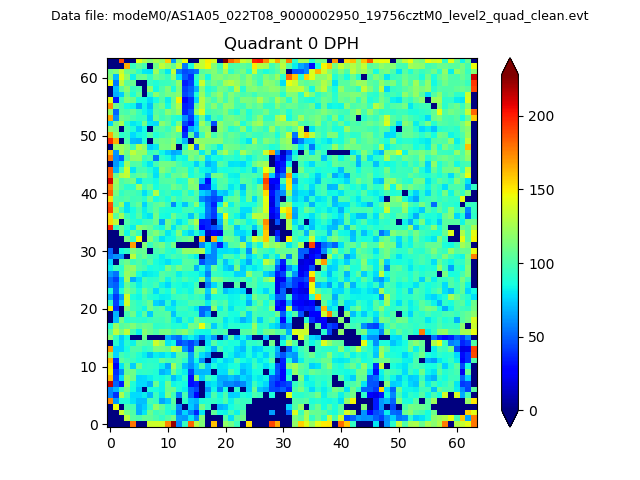 |
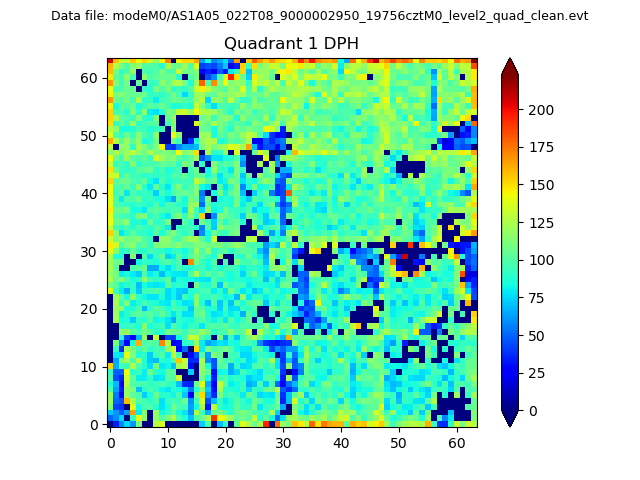 |
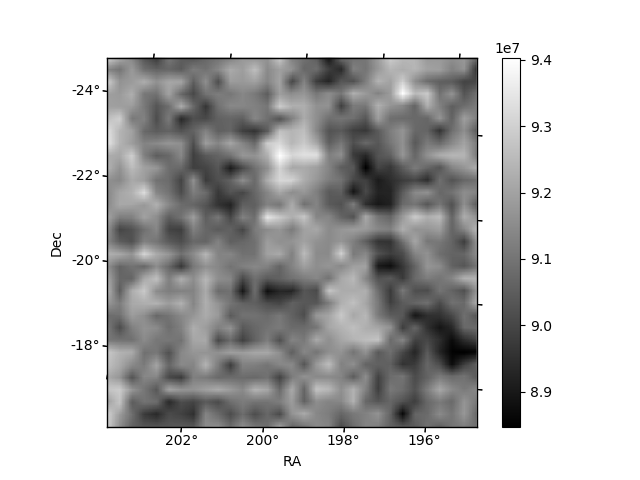
Quadrant B |
|---|---|---|---|
| Quadrant D | 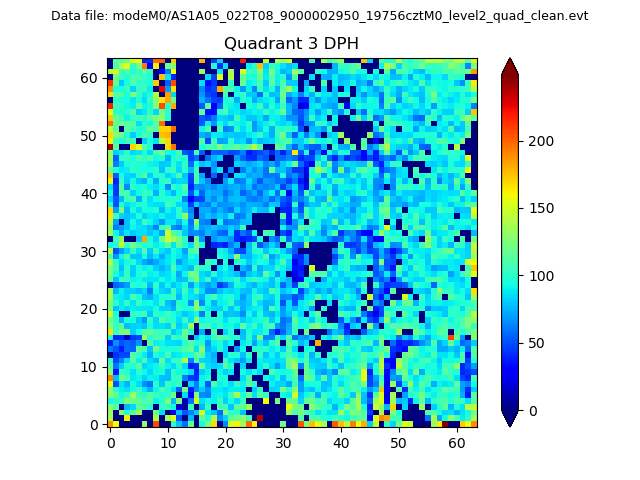 |
 |
Quadrant C |
| Plot type | Count rate plots | Images |
|---|---|---|
| Comparison with Poisson distribution Blue bars denote a histogram of data divided into 1 sec bins. Red curve is a Poisson curve with rate = median count rate of data. |
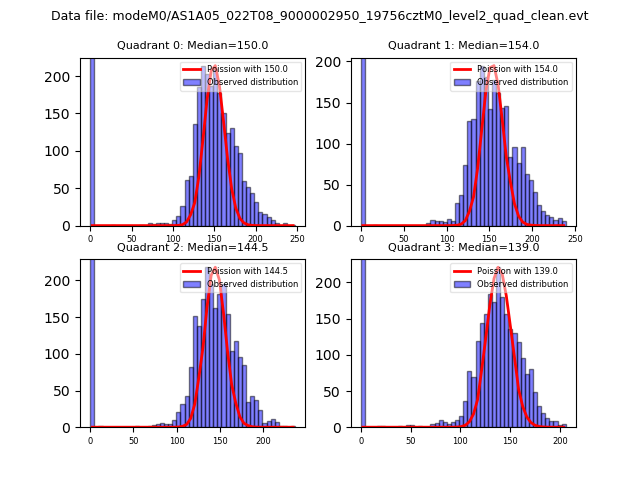 |
 |
| Quadrant-wise count rates Data is divided into 100 sec bins |
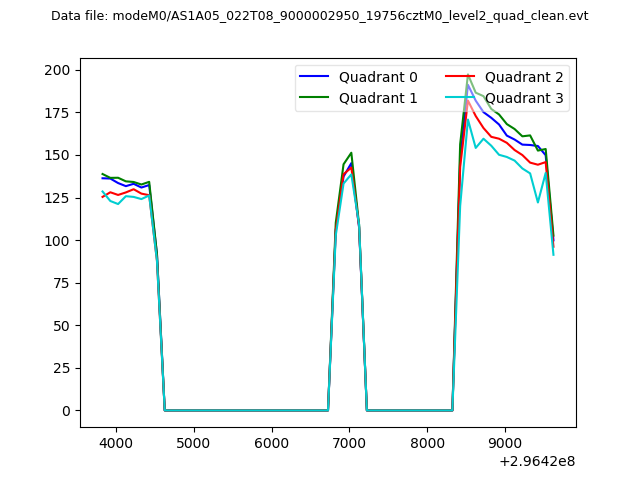 |
|
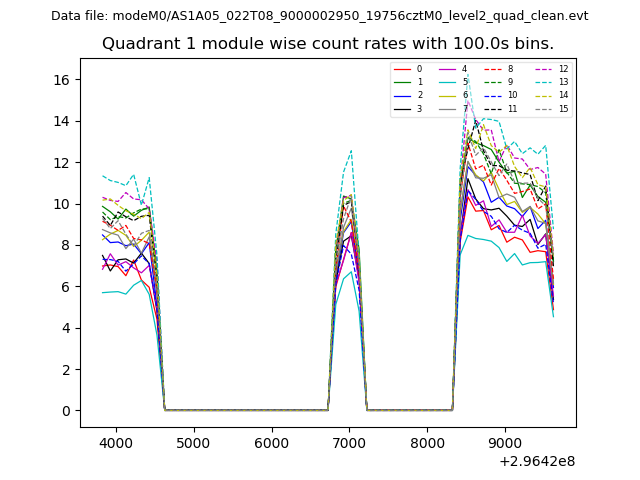
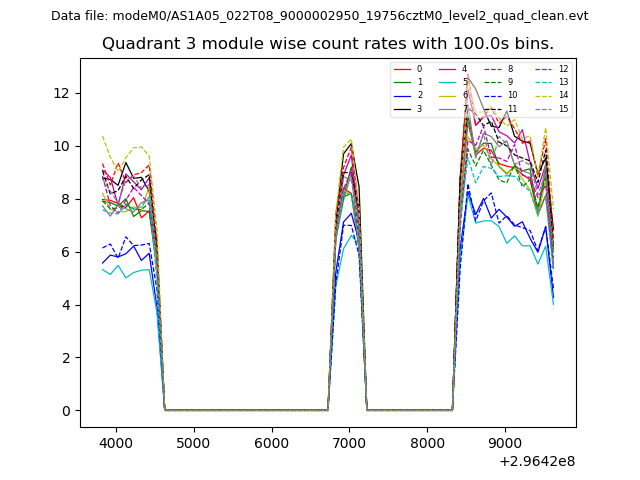
| Module-wise count rates for Quadrant A Data is divided into 100 sec bins |
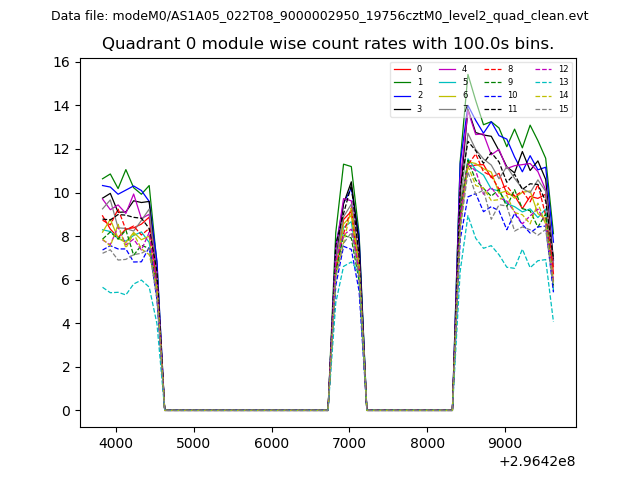 |
 |
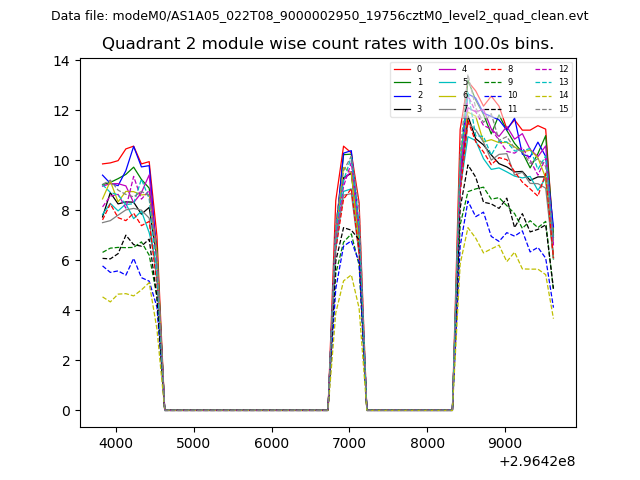
| Module-wise count rates for Quadrant B Data is divided into 100 sec bins |
 |
 |
| Module-wise count rates for Quadrant C Data is divided into 100 sec bins |
 |
 |
| Module-wise count rates for Quadrant D Data is divided into 100 sec bins |
 |
 |
| Parameter | Plot |
|---|---|
| CZT HV Monitor | 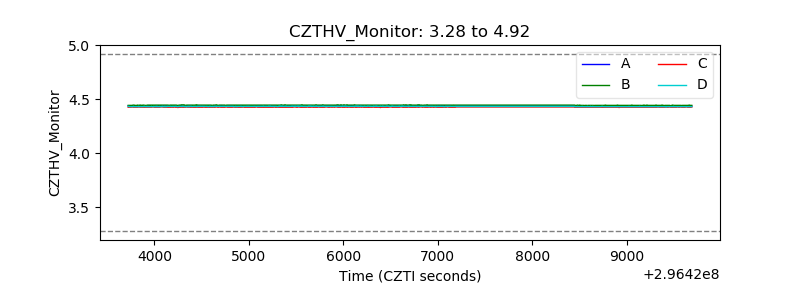 |
| D_VDD | 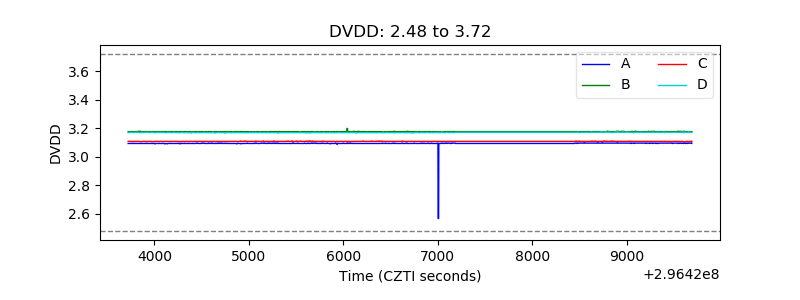 |
| Temperature 1 |  |
| Veto HV Monitor |  |
| Veto LLD | 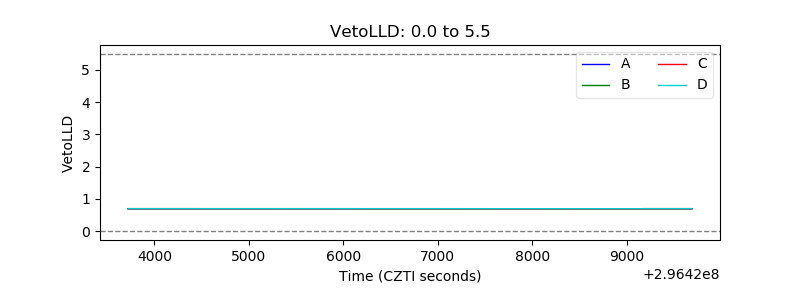 |
| Alpha Counter | 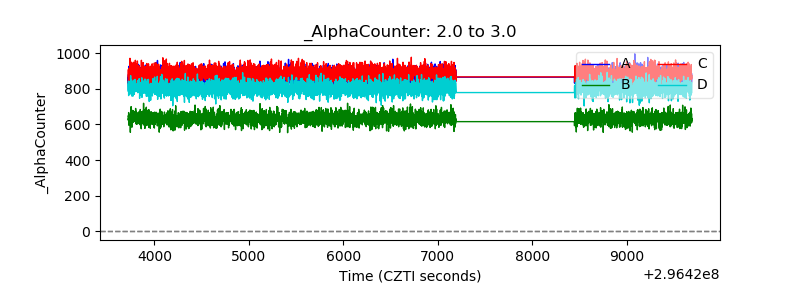 |
| _CPM_Rate | 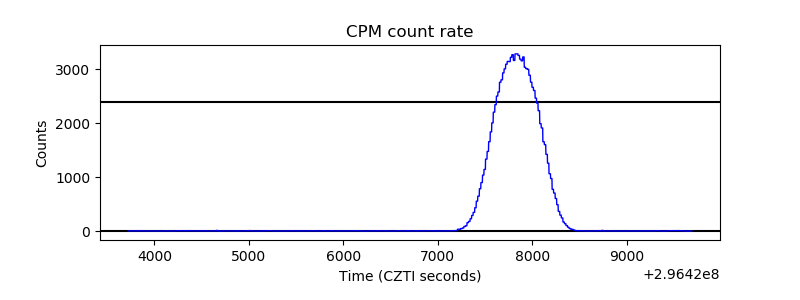 |
| CZT Counter | 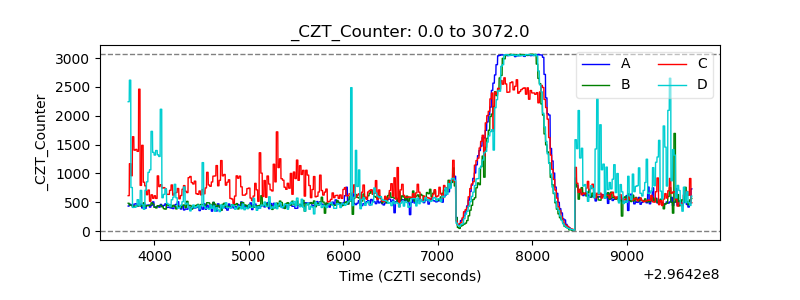 |
| +2.5 Volts monitor |  |
| +5 Volts monitor | 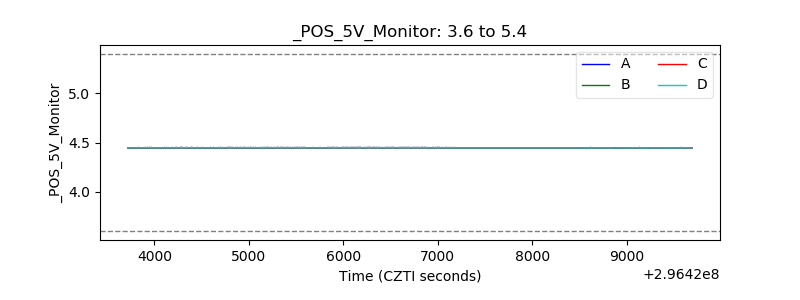 |
| _ROLL_ROT | 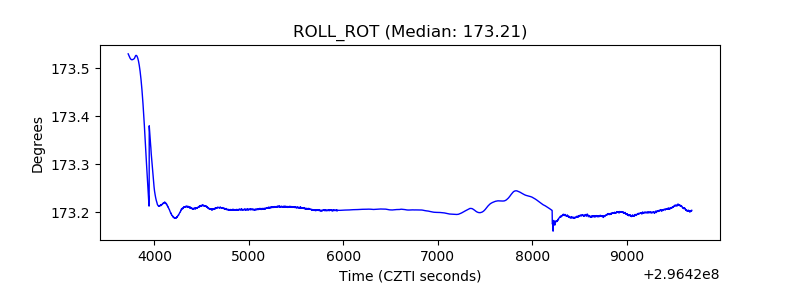 |
| _Roll_DEC | 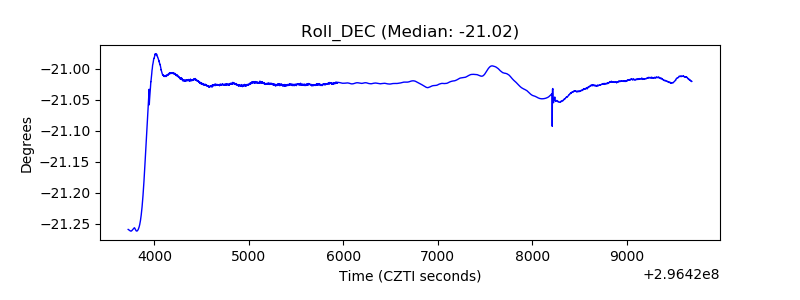 |
| _Roll_RA | 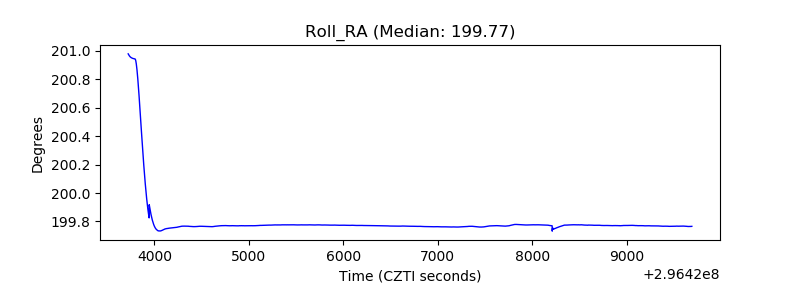 |
| Veto Counter | 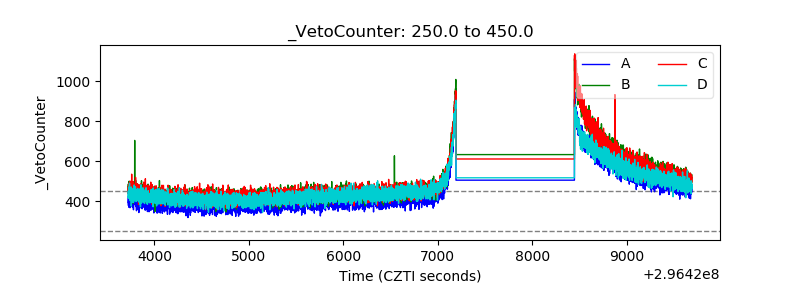 |