| Param | Original file | Final file |
|---|---|---|
| Filename | modeM0/AS1A05_022T08_9000002950_19758cztM0_level2.evt | modeM0/AS1A05_022T08_9000002950_19758cztM0_level2_quad_clean.evt |
| Size (bytes) | 501,166,080 | 89,879,040 |
| Size | 477.9 MB | 85.7 MB |
| Events in quadrant A | 3,139,344 | 594,269 |
| Events in quadrant B | 3,269,258 | 612,081 |
| Events in quadrant C | 3,561,426 | 568,966 |
| Events in quadrant D | 4,794,200 | 520,473 |
| Mode SS | |||
|---|---|---|---|
| Quadrant | BADHDUFLAG | Total packets | Discarded packets |
| A | 0 | 124 | 0 |
| B | 0 | 124 | 0 |
| C | 0 | 124 | 0 |
| D | 0 | 124 | 0 |
| Mode M9 | |||
|---|---|---|---|
| Quadrant | BADHDUFLAG | Total packets | Discarded packets |
| A | 0 | 22 | 0 |
| B | 0 | 22 | 0 |
| C | 0 | 22 | 0 |
| D | 0 | 23 | 0 |
| Mode M0 | |||
|---|---|---|---|
| Quadrant | BADHDUFLAG | Total packets | Discarded packets |
| A | 0 | 13025 | 3 |
| B | 0 | 13339 | 2 |
| C | 0 | 14498 | 2 |
| D | 0 | 18386 | 2 |
| Quadrant | Total seconds | Saturated seconds | Saturation percentage |
|---|---|---|---|
| A | 6100 | 53 | 0.868852% |
| B | 6100 | 86 | 1.409836% |
| C | 6100 | 104 | 1.704918% |
| D | 6100 | 402 | 6.590164% |
Noise dominated data is calculated using 1-second bins in cleaned event files. If a bin has >2000 counts, and if more than 50% of those come from <1% of pixels, then it is considered to be noise-dominated and hence unusable.
| Quadrant | # 1 sec bins | Bins with >0 counts | Bins with >2000 counts | High rate bins dominated by noise | Noise dominated (total time) | Noise dominated (detector-on time) | Marked lightcurve |
|---|---|---|---|---|---|---|---|
| A | 7450 | 6101 | 3 | 3 | 0.04% | 0.05% | 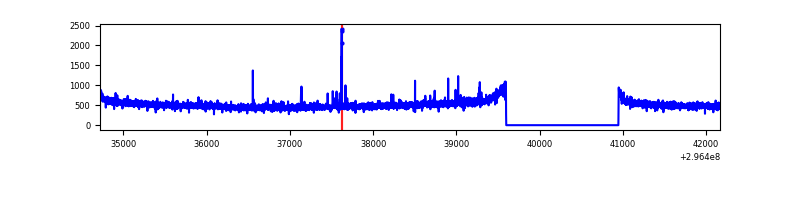 |
| B | 7450 | 6101 | 15 | 15 | 0.20% | 0.25% | 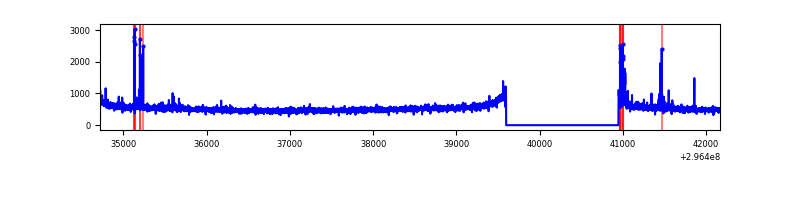 |
| C | 7450 | 6101 | 0 | 0 | 0.00% | 0.00% | 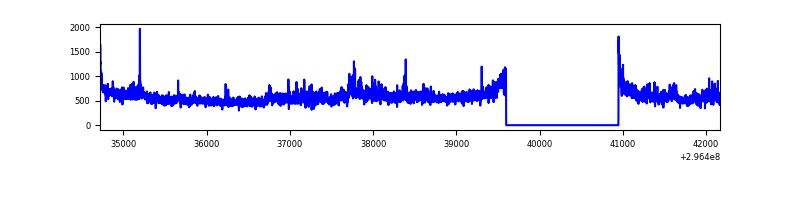 |
| D | 7450 | 6101 | 297 | 297 | 3.99% | 4.87% | 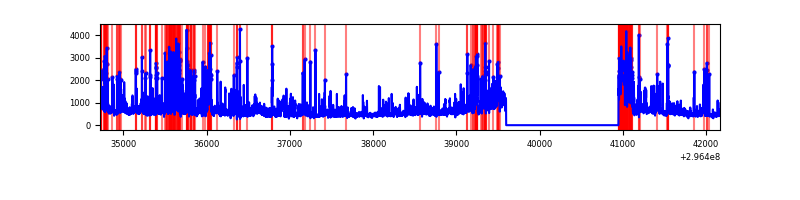 |
Top three noisy pixels from each quadrant. If the there are fewer than three noisy pixels in the level2.evt file, extra rows are filled as -1
| Pixel properties | Quadrant properties | ||||||
|---|---|---|---|---|---|---|---|
| Quadrant | DetID | PixID | Counts | Sigma | Mean | Median | Sigma |
| A | 4 | 2 | 42116 | 255.56 | 801 | 788 | 161.7 |
| A | 6 | 16 | 9832 | 55.93 | 801 | 788 | 161.7 |
| A | 0 | 226 | 6963 | 38.18 | 801 | 788 | 161.7 |
| B | 7 | 220 | 62206 | 406.97 | 806 | 788 | 150.9 |
| B | 0 | 197 | 34324 | 222.22 | 806 | 788 | 150.9 |
| B | 12 | 111 | 17651 | 111.74 | 806 | 788 | 150.9 |
| C | 3 | 233 | 457791 | 2565.14 | 765 | 772 | 178.2 |
| C | 14 | 238 | 120890 | 674.19 | 765 | 772 | 178.2 |
| C | 13 | 61 | 5402 | 25.99 | 765 | 772 | 178.2 |
| D | 1 | 52 | 1296039 | 7057.65 | 746 | 726 | 183.5 |
| D | 12 | 233 | 285761 | 1553.04 | 746 | 726 | 183.5 |
| D | 12 | 218 | 178167 | 966.81 | 746 | 726 | 183.5 |
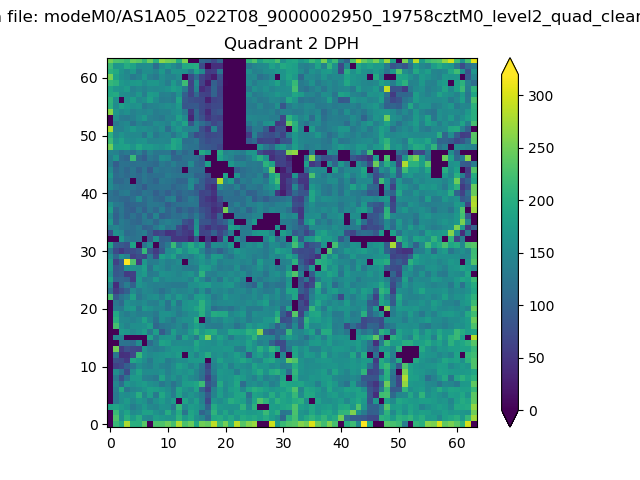
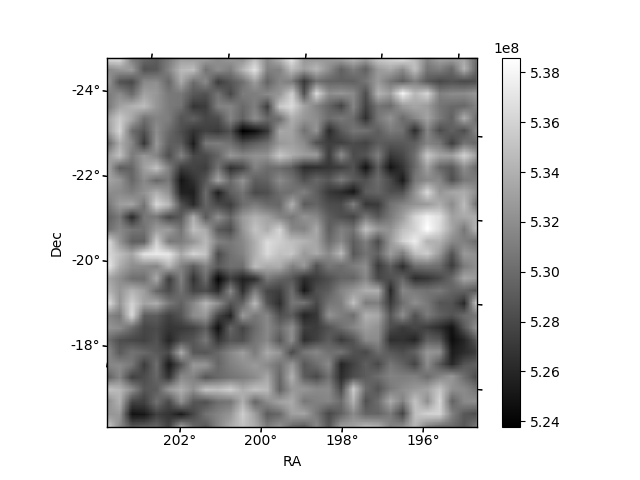
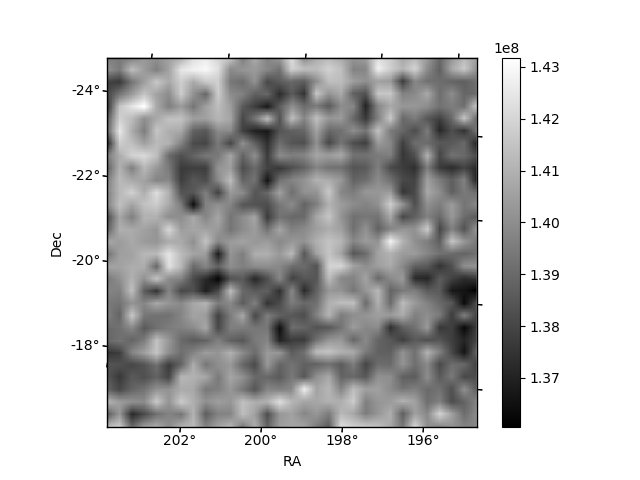
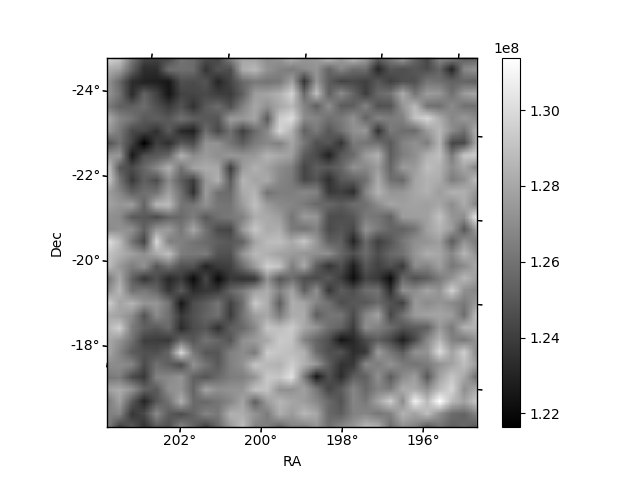
Histogram calculated using DETX and DETY for each event in the final _common_clean file
| Quadrant A | 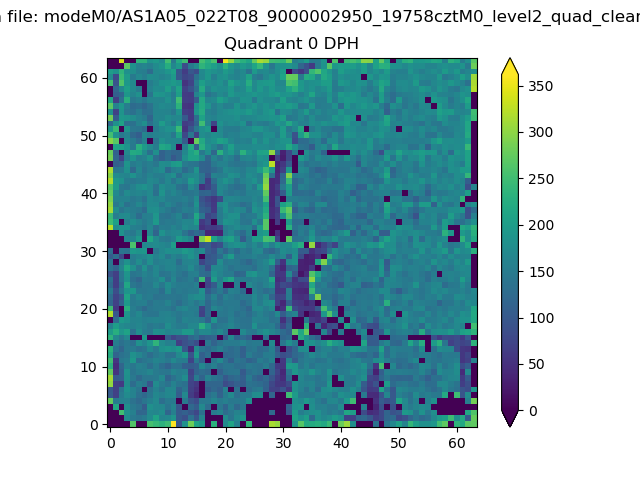 |
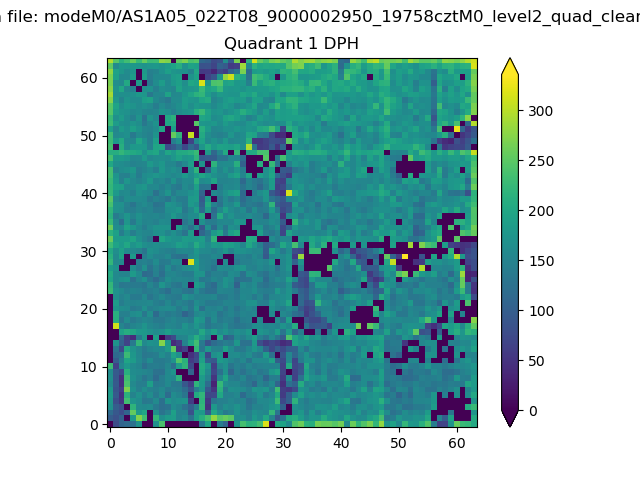 |
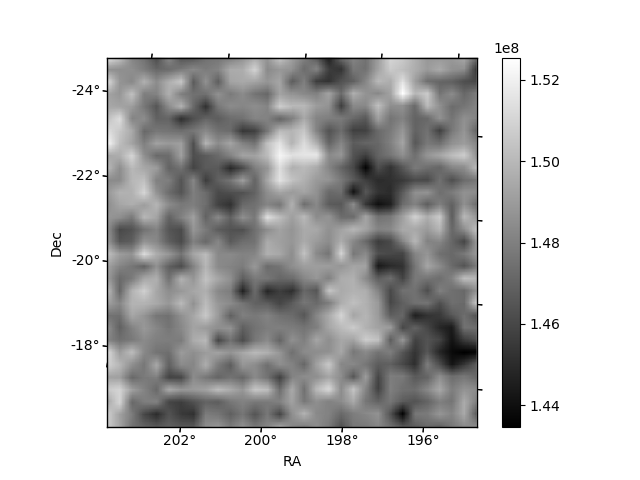
Quadrant B |
|---|---|---|---|
| Quadrant D | 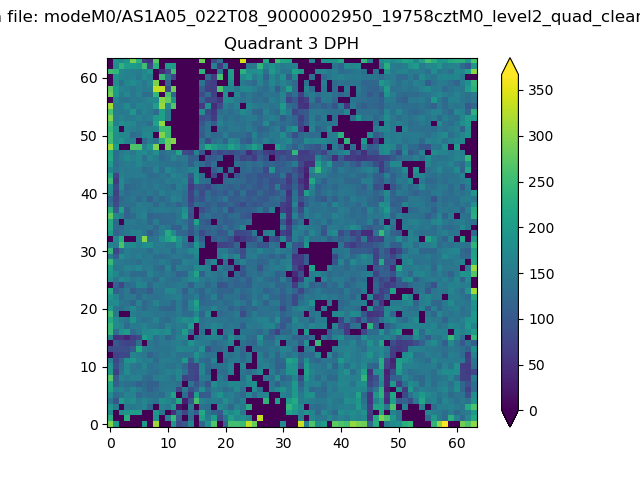 |
 |
Quadrant C |
| Plot type | Count rate plots | Images |
|---|---|---|
| Comparison with Poisson distribution Blue bars denote a histogram of data divided into 1 sec bins. Red curve is a Poisson curve with rate = median count rate of data. |
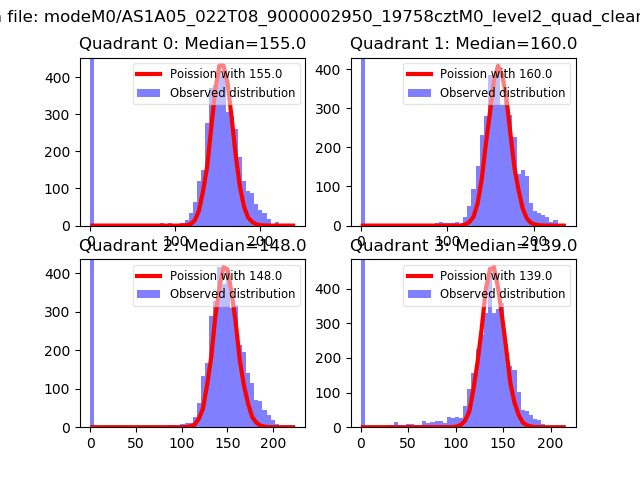 |
 |
| Quadrant-wise count rates Data is divided into 100 sec bins |
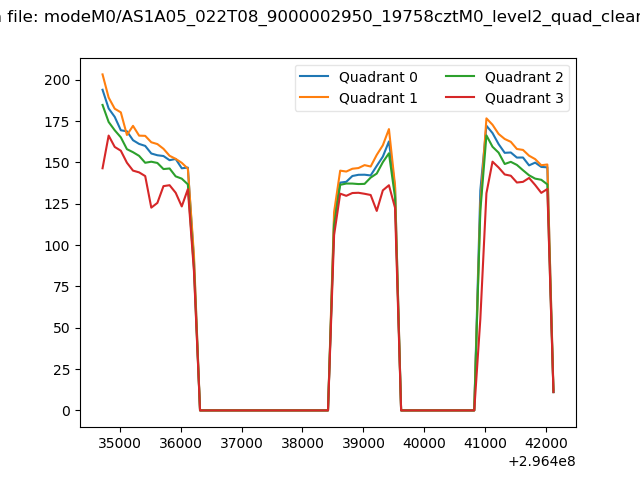 |
|
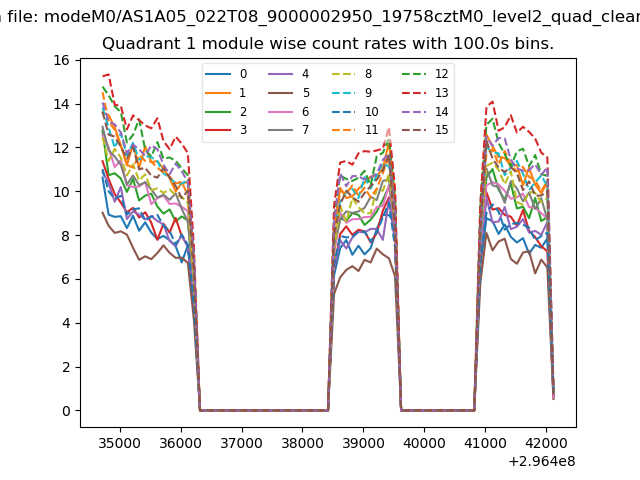
| Module-wise count rates for Quadrant A Data is divided into 100 sec bins |
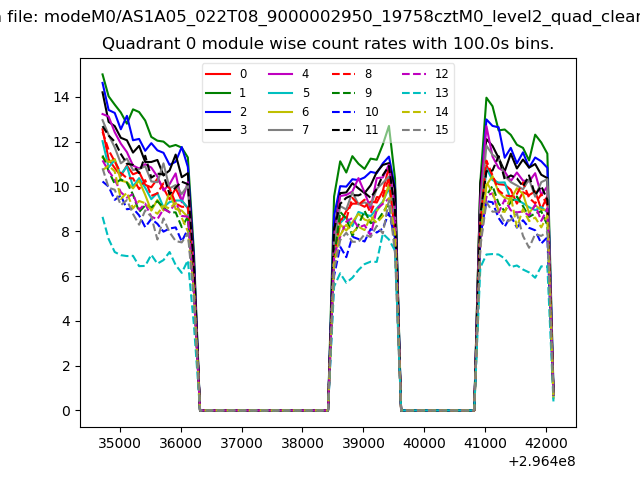 |
 |
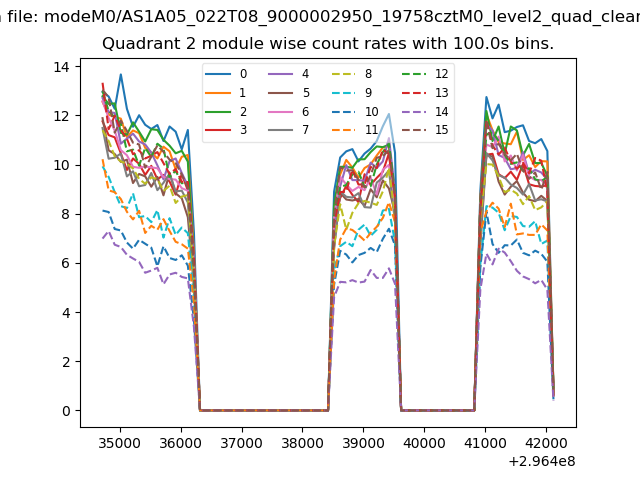
| Module-wise count rates for Quadrant B Data is divided into 100 sec bins |
 |
 |
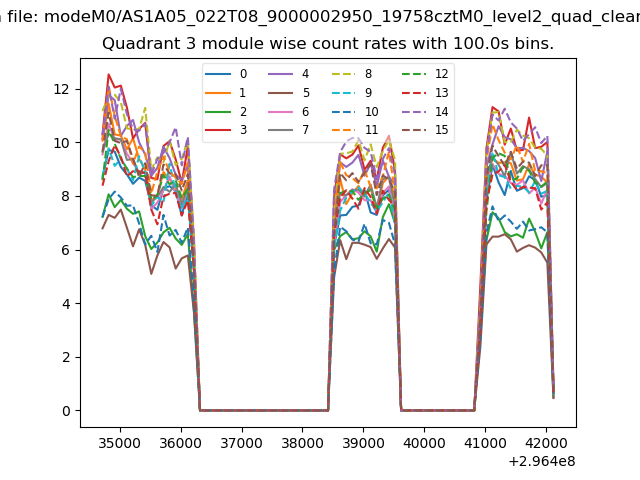
| Module-wise count rates for Quadrant C Data is divided into 100 sec bins |
 |
 |
| Module-wise count rates for Quadrant D Data is divided into 100 sec bins |
 |
 |
| Parameter | Plot |
|---|---|
| CZT HV Monitor | 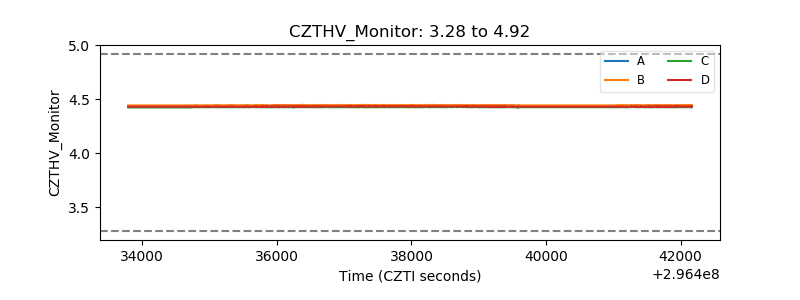 |
| D_VDD | 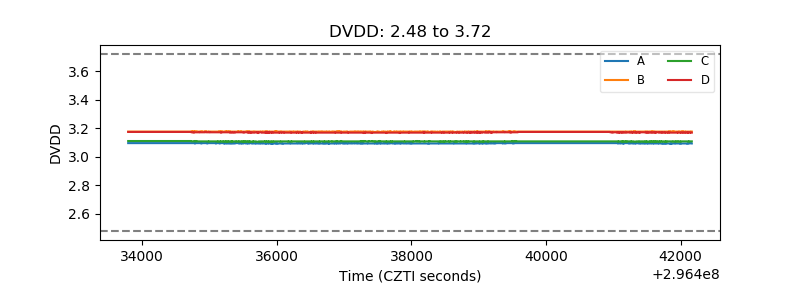 |
| Temperature 1 | 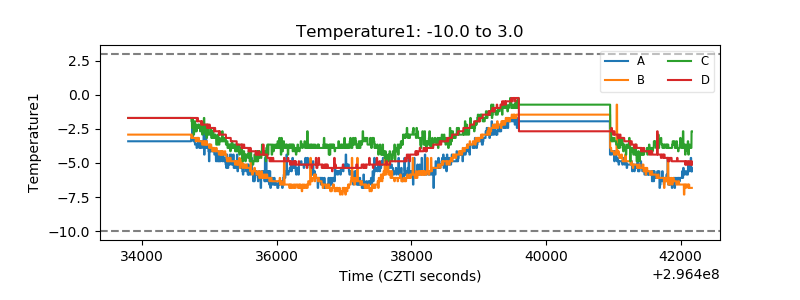 |
| Veto HV Monitor | 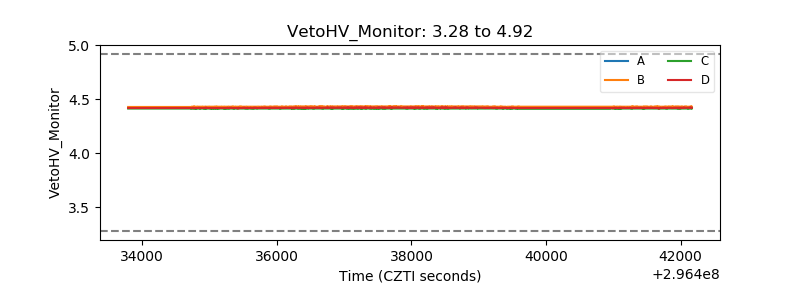 |
| Veto LLD | 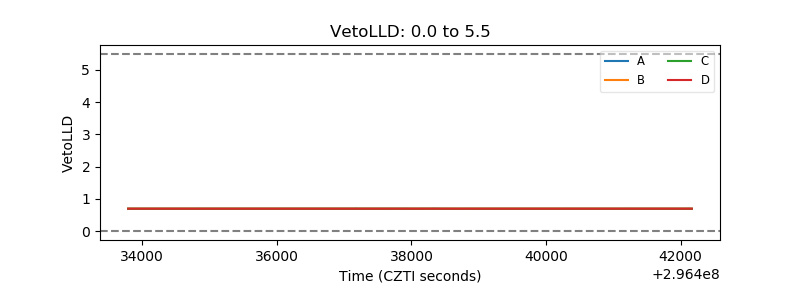 |
| Alpha Counter | 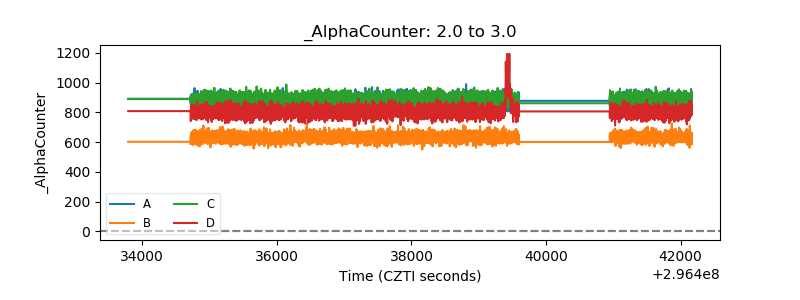 |
| _CPM_Rate | 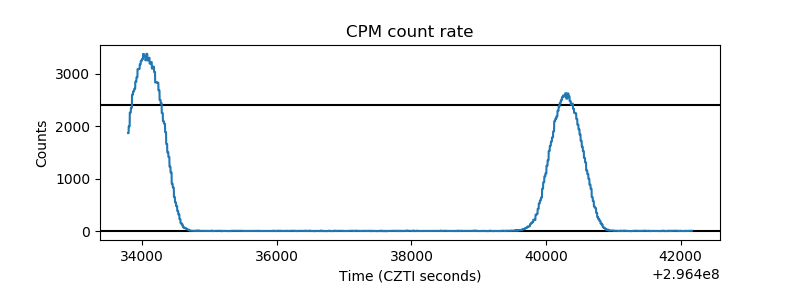 |
| CZT Counter | 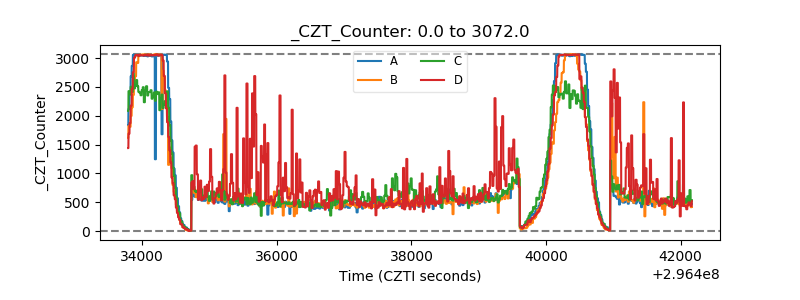 |
| +2.5 Volts monitor |  |
| +5 Volts monitor |  |
| _ROLL_ROT | 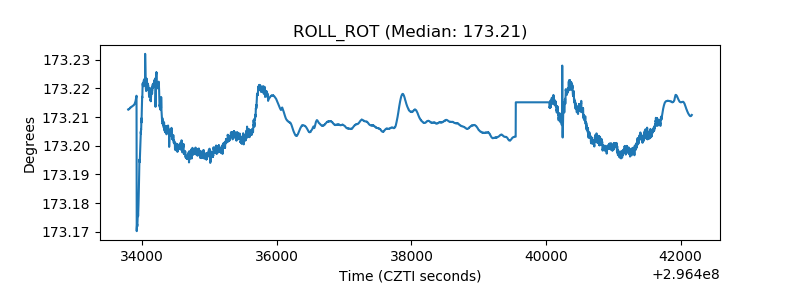 |
| _Roll_DEC | 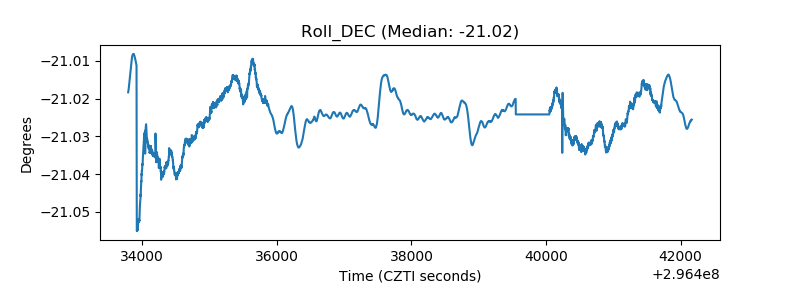 |
| _Roll_RA | 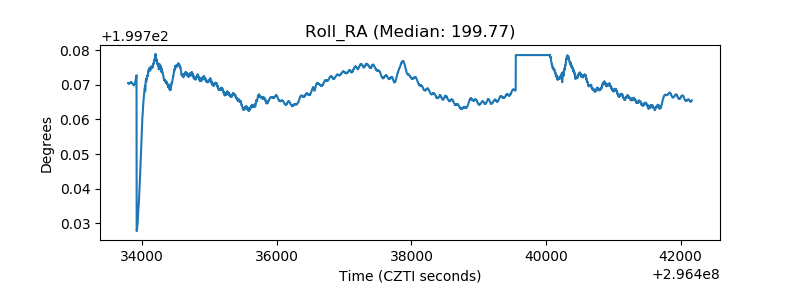 |
| Veto Counter | 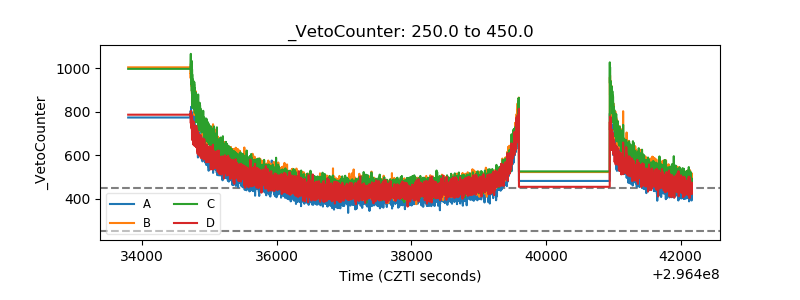 |