| Param | Original file | Final file |
|---|---|---|
| Filename | modeM0/AS1A05_022T08_9000002950_19759cztM0_level2.evt | modeM0/AS1A05_022T08_9000002950_19759cztM0_level2_quad_clean.evt |
| Size (bytes) | 526,798,080 | 79,770,240 |
| Size | 502.4 MB | 76.1 MB |
| Events in quadrant A | 3,128,227 | 515,504 |
| Events in quadrant B | 3,395,201 | 526,668 |
| Events in quadrant C | 4,013,825 | 491,259 |
| Events in quadrant D | 4,992,275 | 444,750 |
| Mode SS | |||
|---|---|---|---|
| Quadrant | BADHDUFLAG | Total packets | Discarded packets |
| A | 0 | 128 | 0 |
| B | 0 | 128 | 0 |
| C | 0 | 128 | 0 |
| D | 0 | 128 | 0 |
| Mode M9 | |||
|---|---|---|---|
| Quadrant | BADHDUFLAG | Total packets | Discarded packets |
| A | 0 | 21 | 0 |
| B | 0 | 21 | 0 |
| C | 0 | 21 | 0 |
| D | 0 | 22 | 0 |
| Mode M0 | |||
|---|---|---|---|
| Quadrant | BADHDUFLAG | Total packets | Discarded packets |
| A | 0 | 13178 | 3 |
| B | 0 | 13885 | 2 |
| C | 0 | 16123 | 2 |
| D | 0 | 18976 | 2 |
| Quadrant | Total seconds | Saturated seconds | Saturation percentage |
|---|---|---|---|
| A | 6260 | 21 | 0.335463% |
| B | 6260 | 85 | 1.357827% |
| C | 6260 | 100 | 1.597444% |
| D | 6260 | 488 | 7.795527% |
Noise dominated data is calculated using 1-second bins in cleaned event files. If a bin has >2000 counts, and if more than 50% of those come from <1% of pixels, then it is considered to be noise-dominated and hence unusable.
| Quadrant | # 1 sec bins | Bins with >0 counts | Bins with >2000 counts | High rate bins dominated by noise | Noise dominated (total time) | Noise dominated (detector-on time) | Marked lightcurve |
|---|---|---|---|---|---|---|---|
| A | 7565 | 6261 | 1 | 1 | 0.01% | 0.02% | 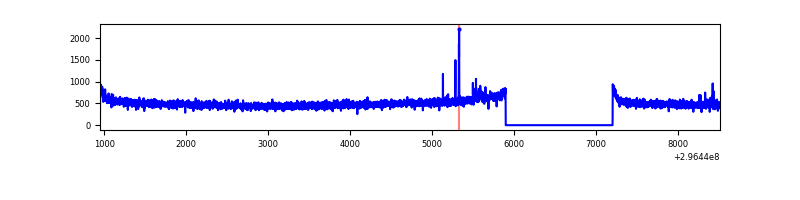 |
| B | 7565 | 6261 | 25 | 25 | 0.33% | 0.40% | 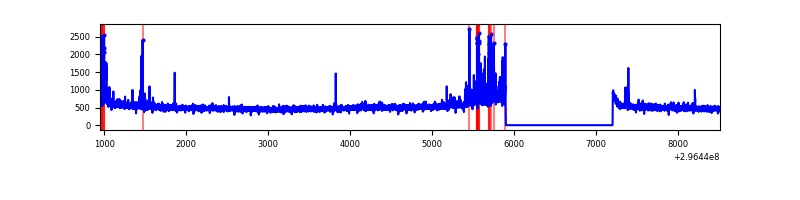 |
| C | 7565 | 6260 | 2 | 2 | 0.03% | 0.03% | 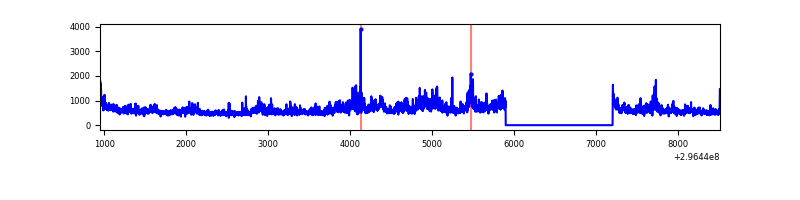 |
| D | 7565 | 6261 | 458 | 458 | 6.05% | 7.32% | 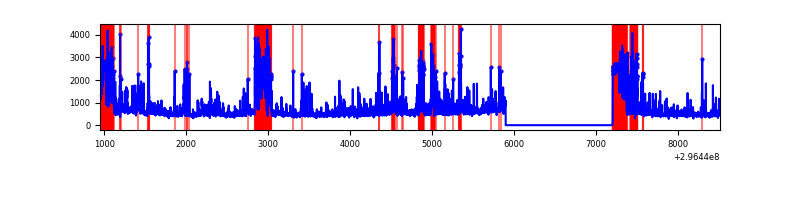 |
Top three noisy pixels from each quadrant. If the there are fewer than three noisy pixels in the level2.evt file, extra rows are filled as -1
| Pixel properties | Quadrant properties | ||||||
|---|---|---|---|---|---|---|---|
| Quadrant | DetID | PixID | Counts | Sigma | Mean | Median | Sigma |
| A | 10 | 253 | 28143 | 171.08 | 798 | 785 | 159.9 |
| A | 0 | 23 | 12354 | 72.35 | 798 | 785 | 159.9 |
| A | 4 | 2 | 8572 | 48.69 | 798 | 785 | 159.9 |
| B | 7 | 220 | 176041 | 1160.15 | 801 | 783 | 151.1 |
| B | 0 | 197 | 32118 | 207.43 | 801 | 783 | 151.1 |
| B | 0 | 198 | 22321 | 142.57 | 801 | 783 | 151.1 |
| C | 3 | 233 | 917758 | 5161.0 | 762 | 770 | 177.7 |
| C | 14 | 238 | 120864 | 675.91 | 762 | 770 | 177.7 |
| C | 13 | 61 | 5503 | 26.64 | 762 | 770 | 177.7 |
| D | 1 | 52 | 910001 | 5101.78 | 735 | 715 | 178.2 |
| D | 9 | 1 | 369898 | 2071.4 | 735 | 715 | 178.2 |
| D | 2 | 184 | 318209 | 1781.38 | 735 | 715 | 178.2 |
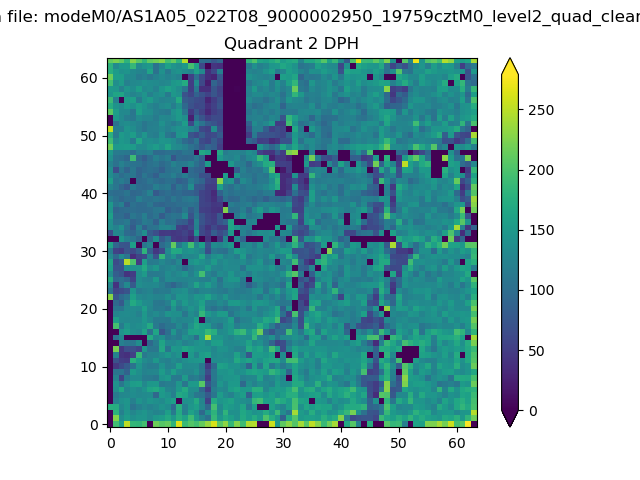
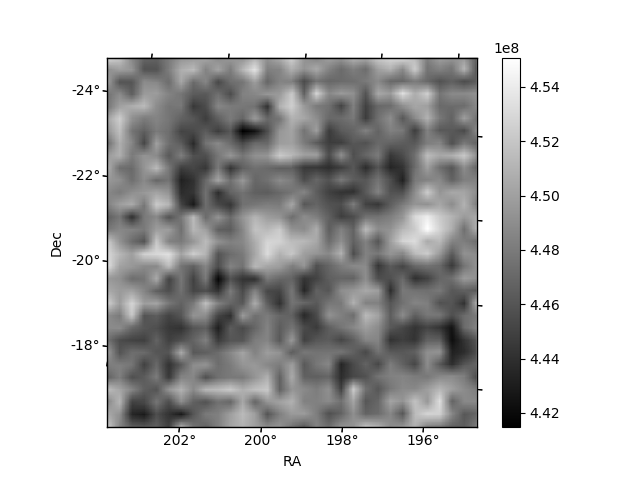
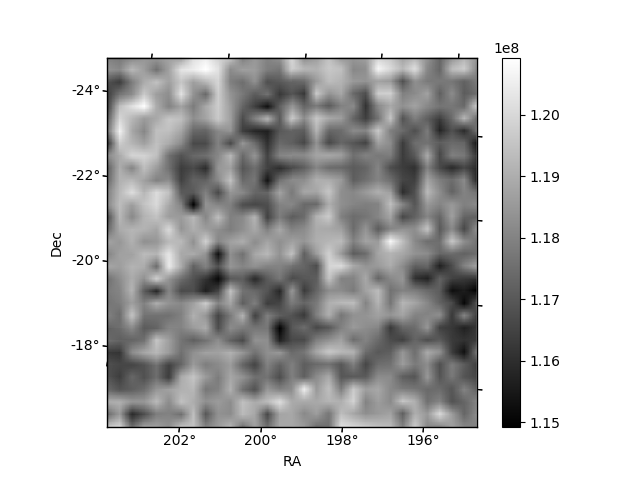
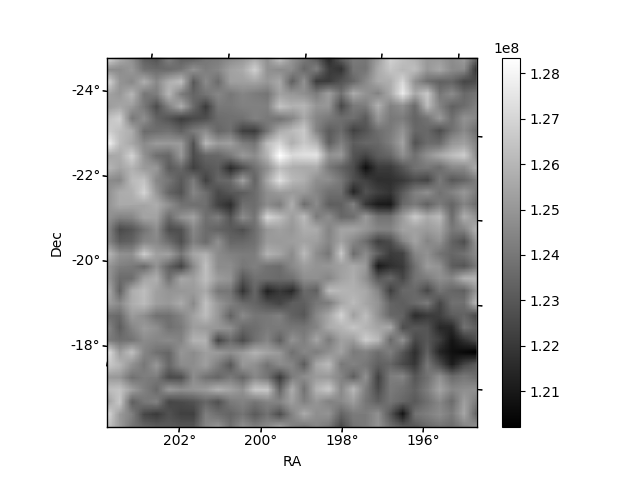
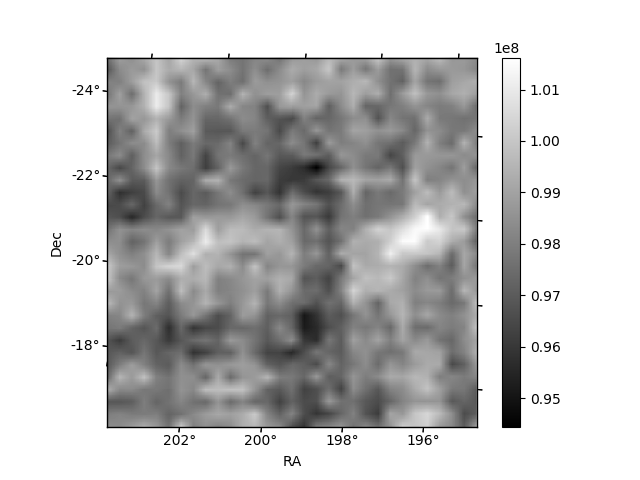
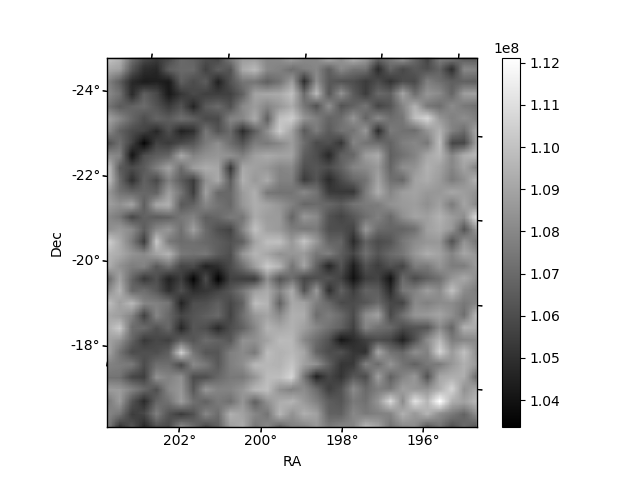
Histogram calculated using DETX and DETY for each event in the final _common_clean file
| Quadrant A | 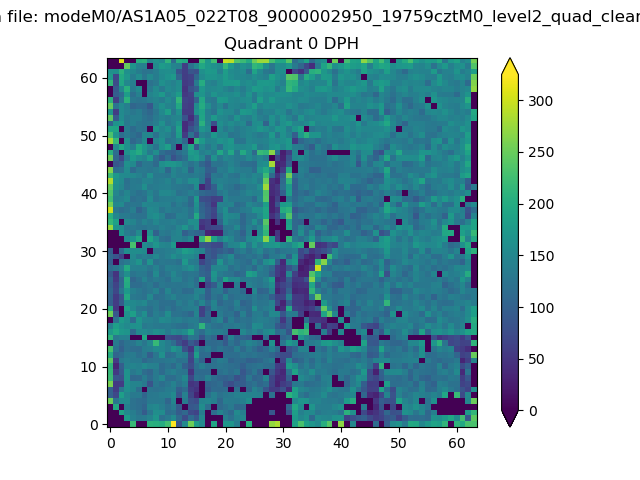 |
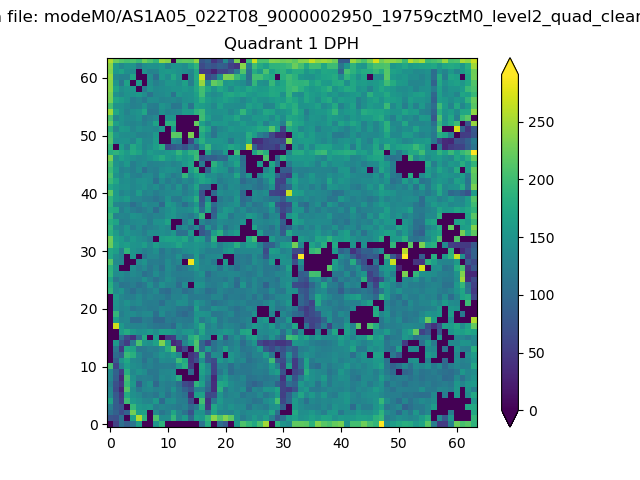 |
Quadrant B |
|---|---|---|---|
| Quadrant D | 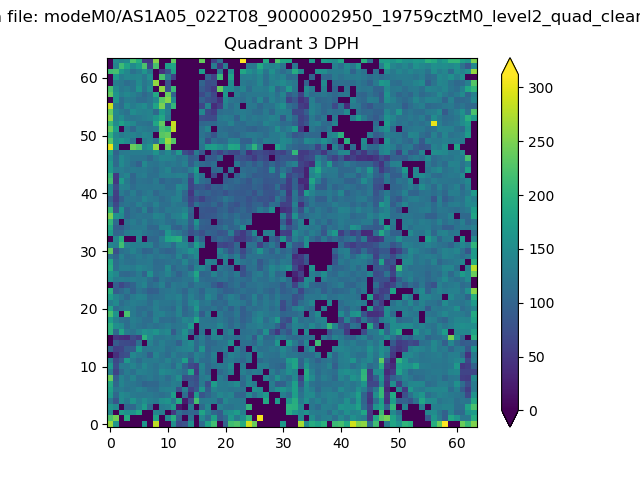 |
 |
Quadrant C |
| Plot type | Count rate plots | Images |
|---|---|---|
| Comparison with Poisson distribution Blue bars denote a histogram of data divided into 1 sec bins. Red curve is a Poisson curve with rate = median count rate of data. |
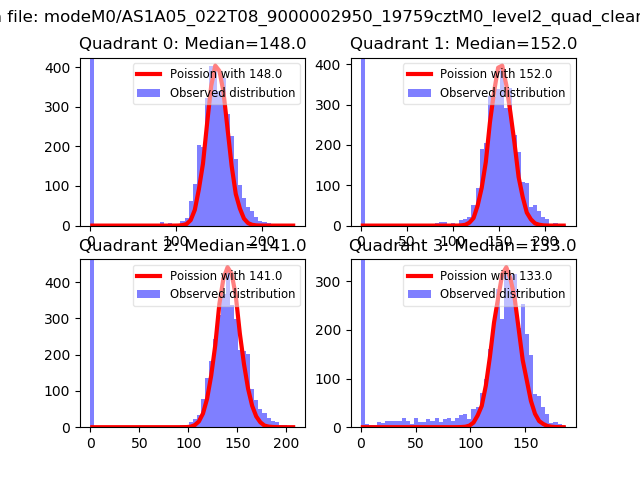 |
 |
| Quadrant-wise count rates Data is divided into 100 sec bins |
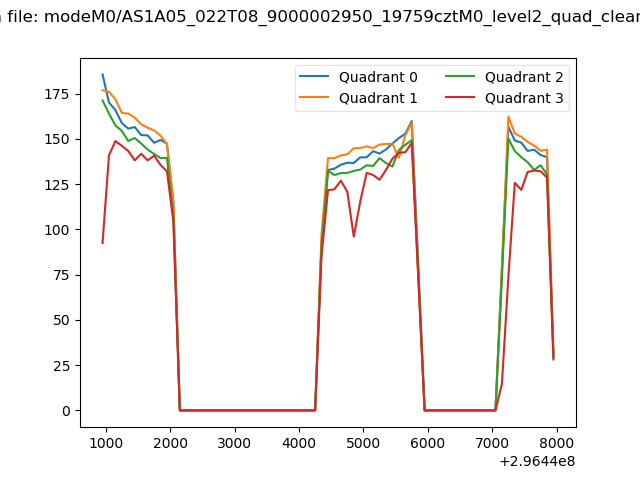 |
|
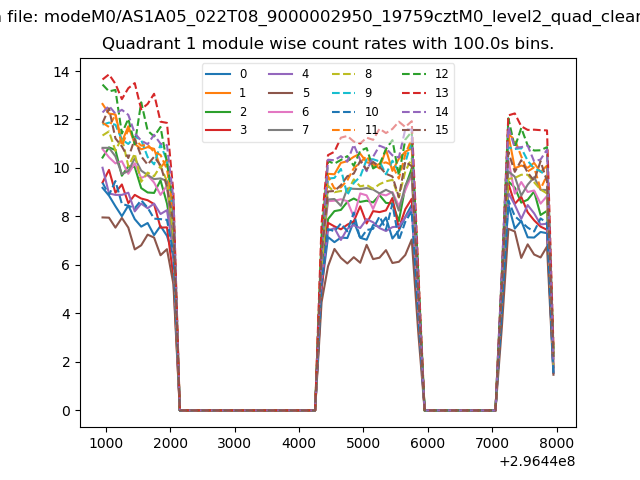
| Module-wise count rates for Quadrant A Data is divided into 100 sec bins |
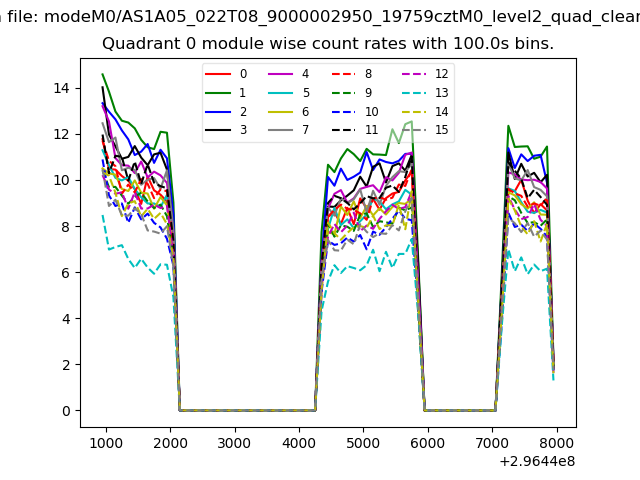 |
 |
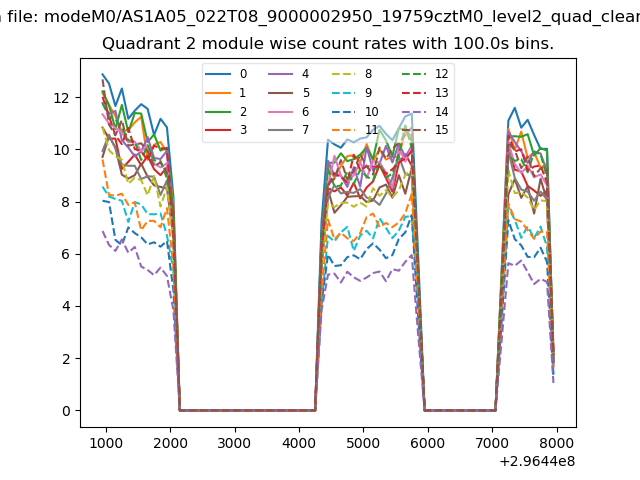
| Module-wise count rates for Quadrant B Data is divided into 100 sec bins |
 |
 |
| Module-wise count rates for Quadrant C Data is divided into 100 sec bins |
 |
 |
| Module-wise count rates for Quadrant D Data is divided into 100 sec bins |
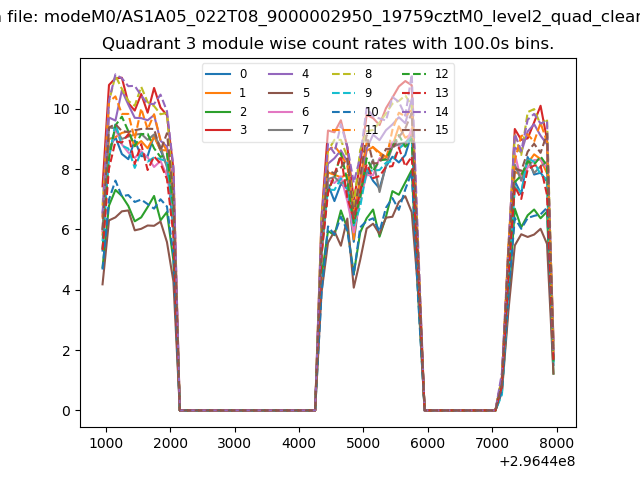 |
 |
| Parameter | Plot |
|---|---|
| CZT HV Monitor | 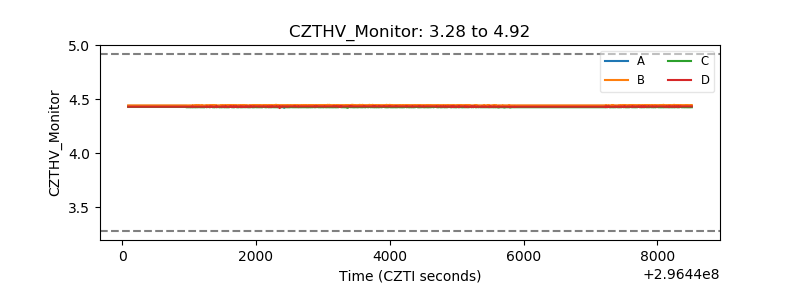 |
| D_VDD | 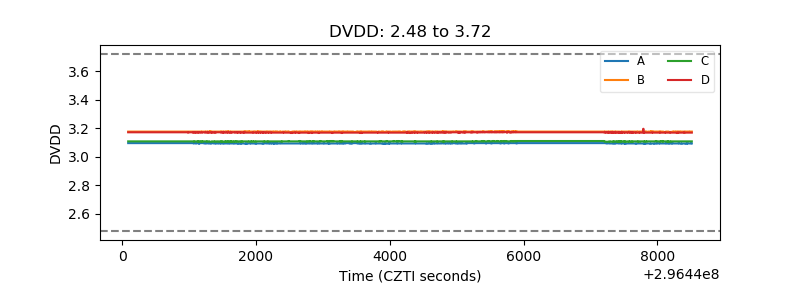 |
| Temperature 1 |  |
| Veto HV Monitor | 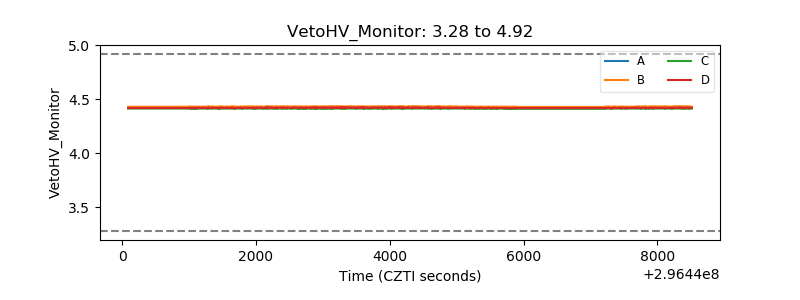 |
| Veto LLD | 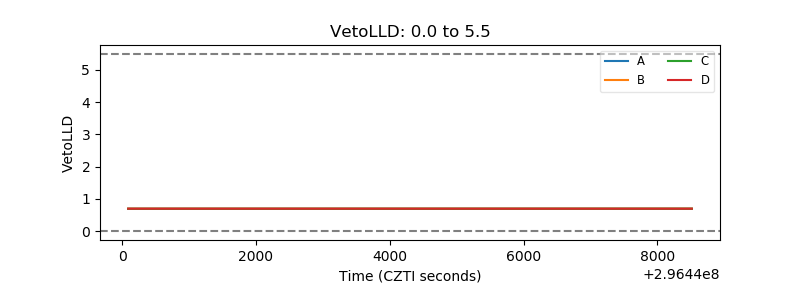 |
| Alpha Counter | 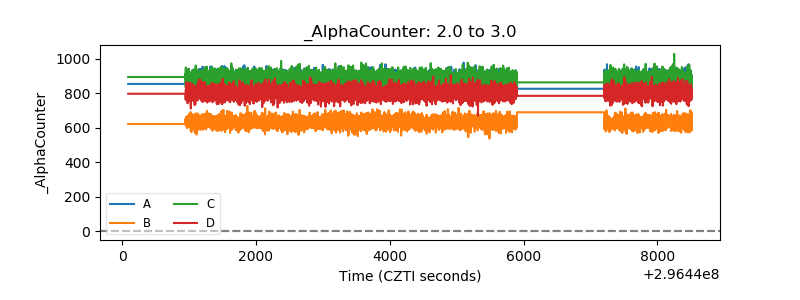 |
| _CPM_Rate | 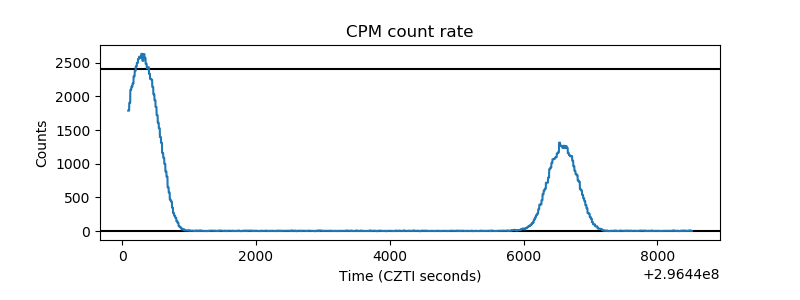 |
| CZT Counter | 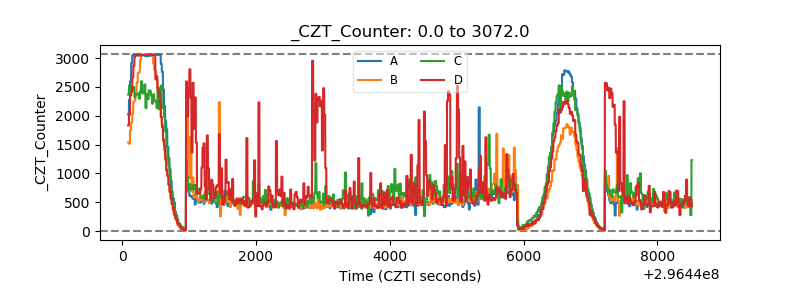 |
| +2.5 Volts monitor |  |
| +5 Volts monitor |  |
| _ROLL_ROT | 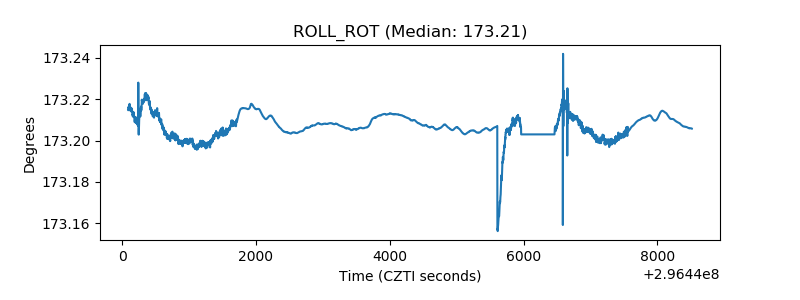 |
| _Roll_DEC | 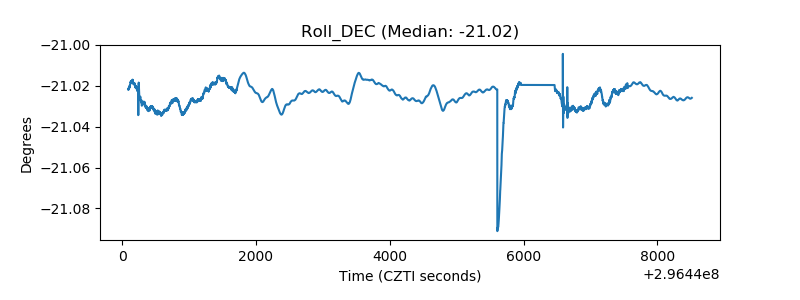 |
| _Roll_RA | 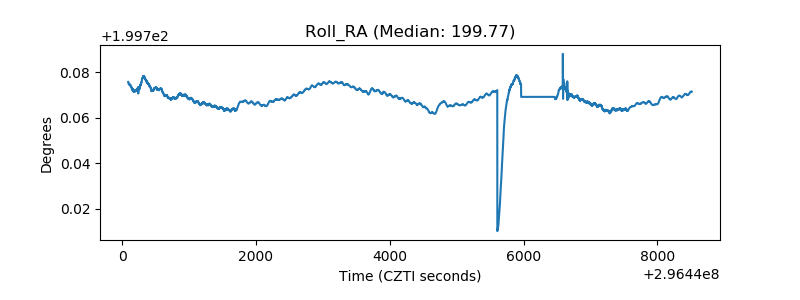 |
| Veto Counter |  |