| Param | Original file | Final file |
|---|---|---|
| Filename | modeM0/AS1A05_022T08_9000002950_19762cztM0_level2.evt | modeM0/AS1A05_022T08_9000002950_19762cztM0_level2_quad_clean.evt |
| Size (bytes) | 437,935,680 | 37,880,640 |
| Size | 417.6 MB | 36.1 MB |
| Events in quadrant A | 1,867,797 | 228,410 |
| Events in quadrant B | 2,041,827 | 232,538 |
| Events in quadrant C | 4,414,807 | 193,042 |
| Events in quadrant D | 4,661,049 | 204,395 |
| Mode SS | |||
|---|---|---|---|
| Quadrant | BADHDUFLAG | Total packets | Discarded packets |
| A | 0 | 82 | 0 |
| B | 0 | 82 | 0 |
| C | 0 | 82 | 0 |
| D | 0 | 82 | 0 |
| Mode M9 | |||
|---|---|---|---|
| Quadrant | BADHDUFLAG | Total packets | Discarded packets |
| A | 1 | 140564824116008 | 46 |
| B | 1 | -1 | -1 |
| C | 1 | -1 | -1 |
| D | 1 | -1 | -1 |
| Mode M0 | |||
|---|---|---|---|
| Quadrant | BADHDUFLAG | Total packets | Discarded packets |
| A | 0 | 8262 | 1 |
| B | 0 | 8704 | 1 |
| C | 0 | 15976 | 1 |
| D | 0 | 16586 | 1 |
| Quadrant | Total seconds | Saturated seconds | Saturation percentage |
|---|---|---|---|
| A | 4081 | 11 | 0.269542% |
| B | 4081 | 17 | 0.416565% |
| C | 4081 | 565 | 13.844646% |
| D | 4081 | 1061 | 25.998530% |
Noise dominated data is calculated using 1-second bins in cleaned event files. If a bin has >2000 counts, and if more than 50% of those come from <1% of pixels, then it is considered to be noise-dominated and hence unusable.
| Quadrant | # 1 sec bins | Bins with >0 counts | Bins with >2000 counts | High rate bins dominated by noise | Noise dominated (total time) | Noise dominated (detector-on time) | Marked lightcurve |
|---|---|---|---|---|---|---|---|
| A | 4081 | 4081 | 0 | 0 | 0.00% | 0.00% | 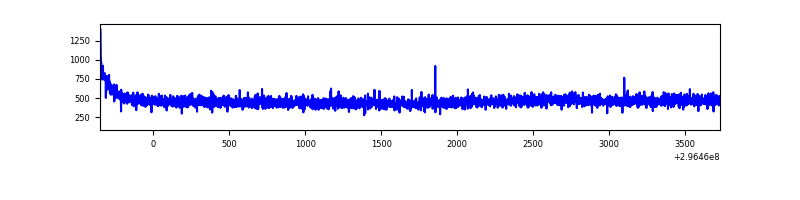 |
| B | 4081 | 4081 | 9 | 9 | 0.22% | 0.22% | 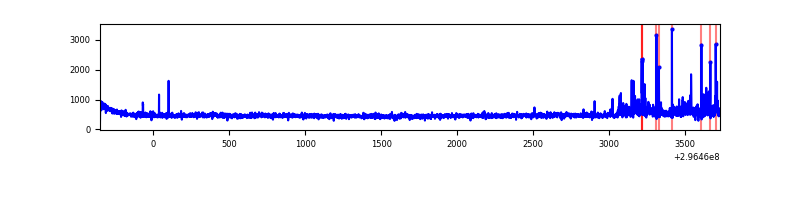 |
| C | 4081 | 4081 | 373 | 373 | 9.14% | 9.14% | 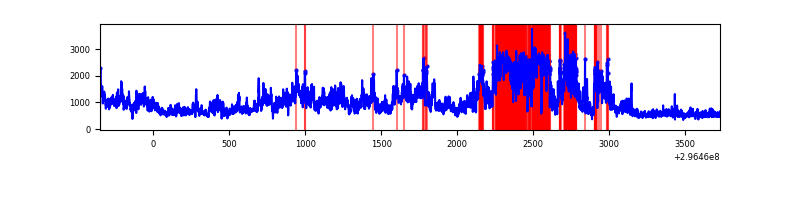 |
| D | 4081 | 4081 | 915 | 915 | 22.42% | 22.42% | 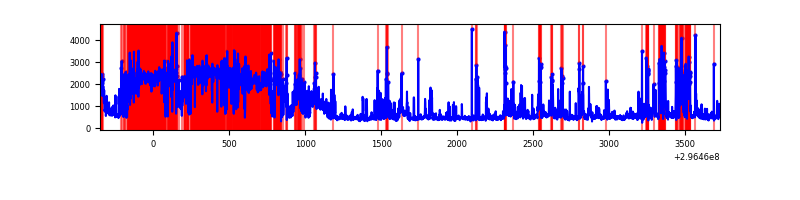 |
Top three noisy pixels from each quadrant. If the there are fewer than three noisy pixels in the level2.evt file, extra rows are filled as -1
| Pixel properties | Quadrant properties | ||||||
|---|---|---|---|---|---|---|---|
| Quadrant | DetID | PixID | Counts | Sigma | Mean | Median | Sigma |
| A | 0 | 226 | 4228 | 38.02 | 483 | 471 | 98.8 |
| A | 13 | 254 | 4151 | 37.24 | 483 | 471 | 98.8 |
| A | 3 | 137 | 3967 | 35.38 | 483 | 471 | 98.8 |
| B | 7 | 220 | 115622 | 1228.24 | 482 | 470 | 93.8 |
| B | 0 | 190 | 14691 | 151.68 | 482 | 470 | 93.8 |
| B | 12 | 111 | 11311 | 115.63 | 482 | 470 | 93.8 |
| C | 3 | 233 | 2633138 | 25348.17 | 439 | 441 | 103.9 |
| C | 14 | 238 | 67865 | 649.17 | 439 | 441 | 103.9 |
| C | 13 | 61 | 3058 | 25.2 | 439 | 441 | 103.9 |
| D | 7 | 238 | 2361670 | 24730.43 | 387 | 376 | 95.5 |
| D | 1 | 52 | 542751 | 5680.43 | 387 | 376 | 95.5 |
| D | 12 | 218 | 173265 | 1810.71 | 387 | 376 | 95.5 |
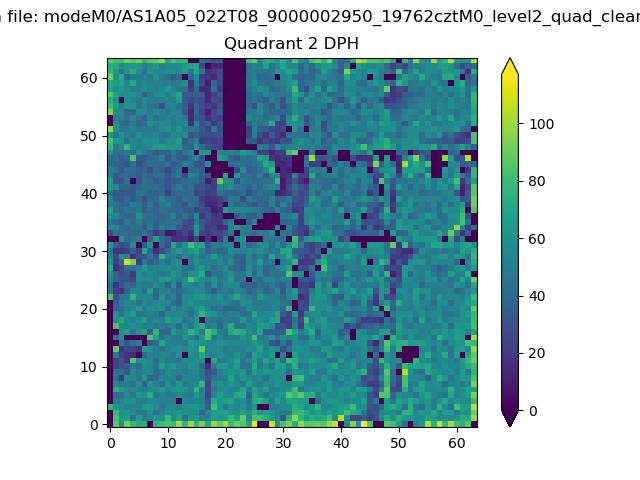
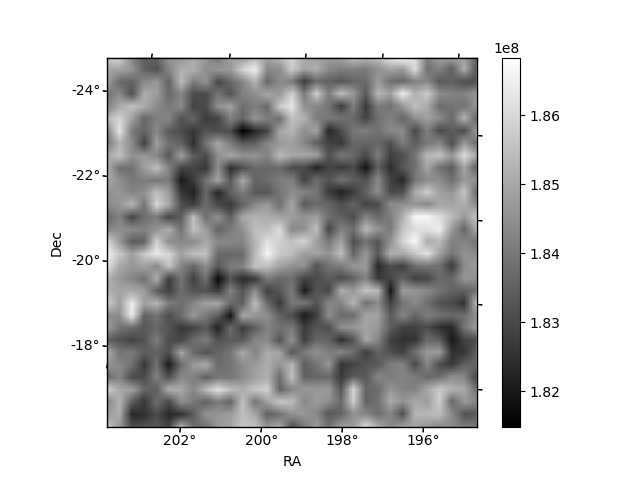
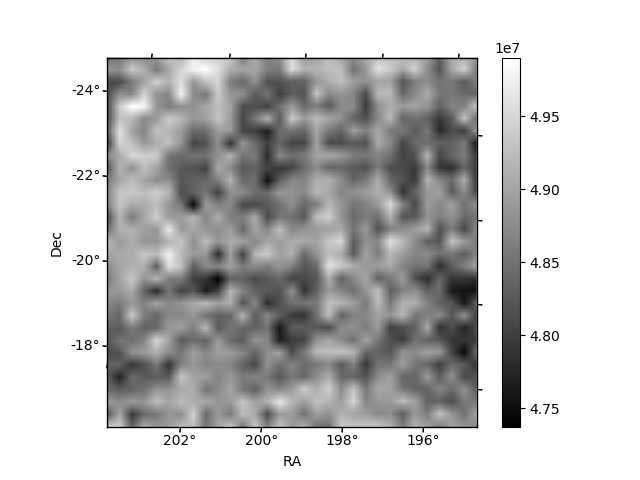
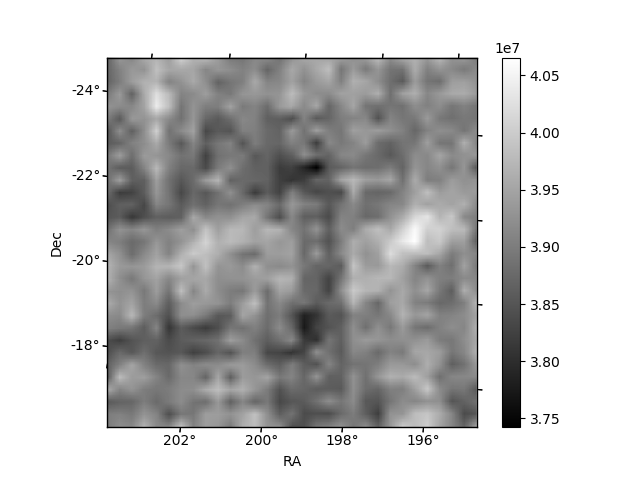
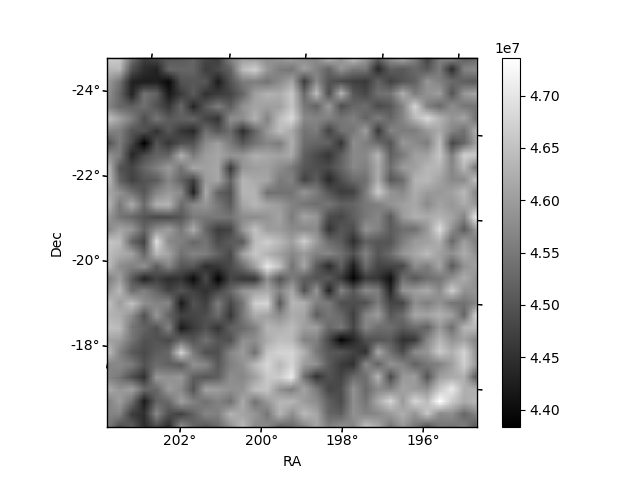
Histogram calculated using DETX and DETY for each event in the final _common_clean file
| Quadrant A | 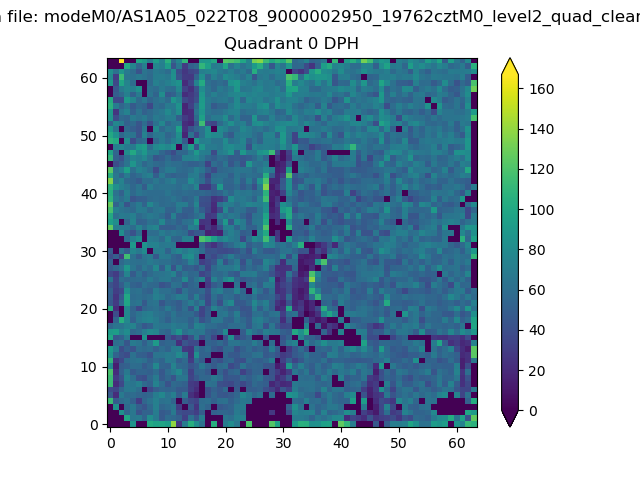 |
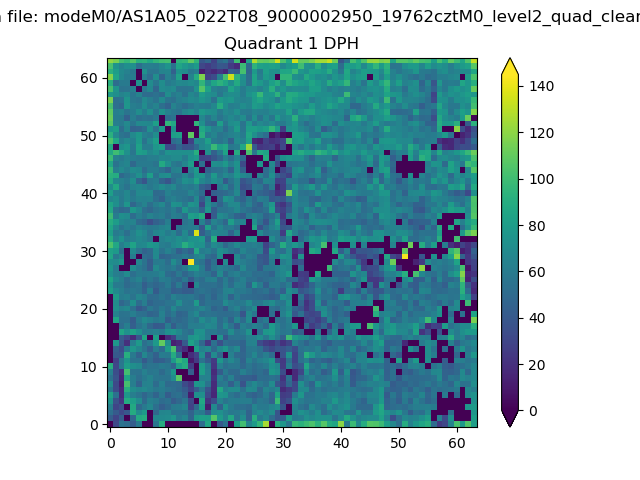 |
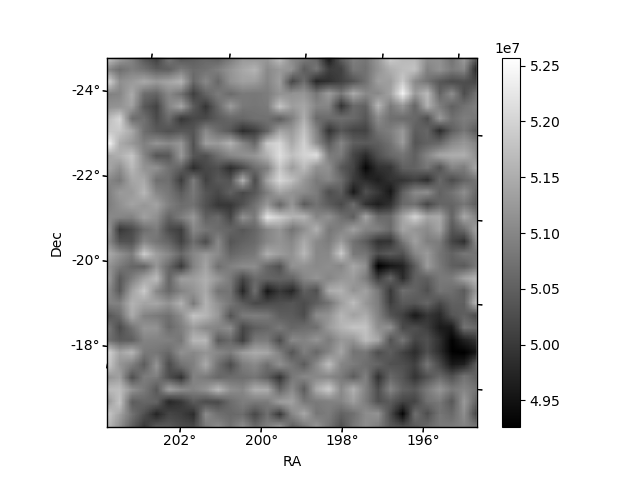
Quadrant B |
|---|---|---|---|
| Quadrant D | 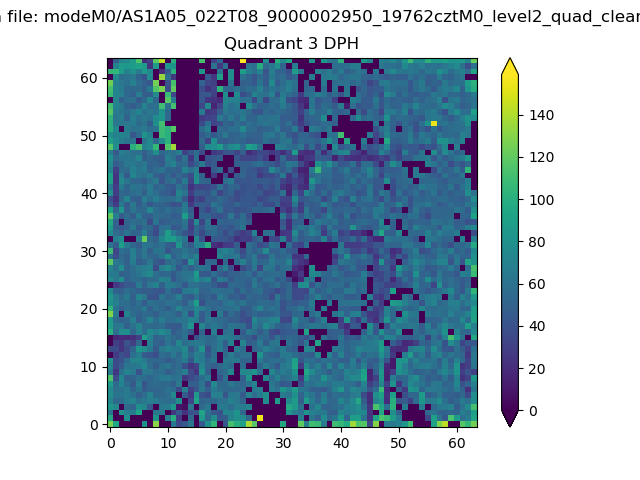 |
 |
Quadrant C |
| Plot type | Count rate plots | Images |
|---|---|---|
| Comparison with Poisson distribution Blue bars denote a histogram of data divided into 1 sec bins. Red curve is a Poisson curve with rate = median count rate of data. |
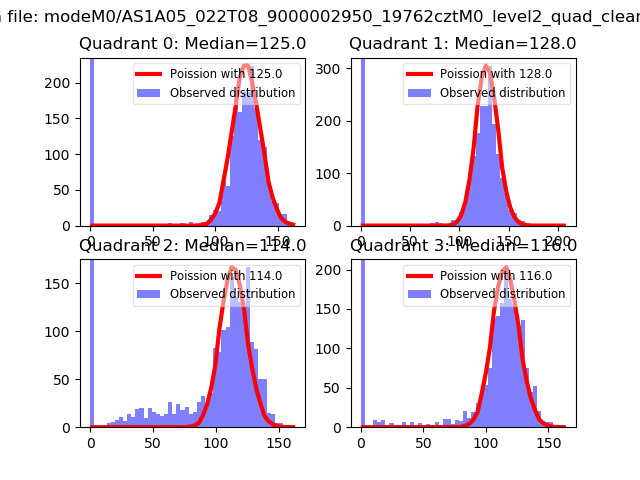 |
 |
| Quadrant-wise count rates Data is divided into 100 sec bins |
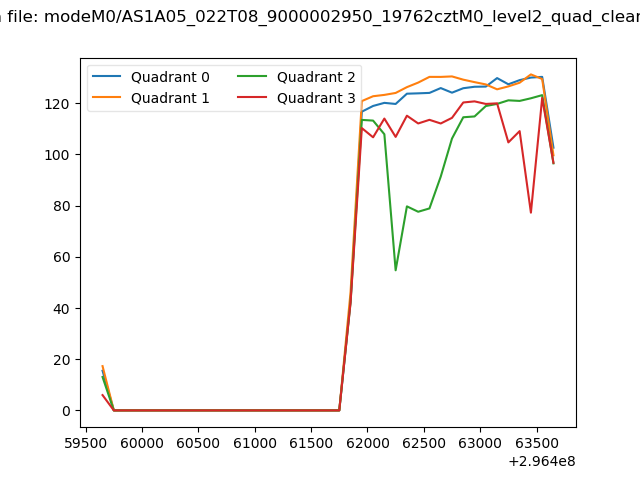 |
|
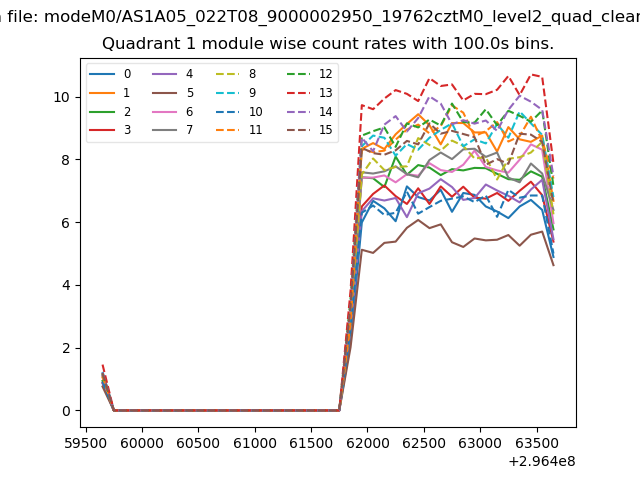
| Module-wise count rates for Quadrant A Data is divided into 100 sec bins |
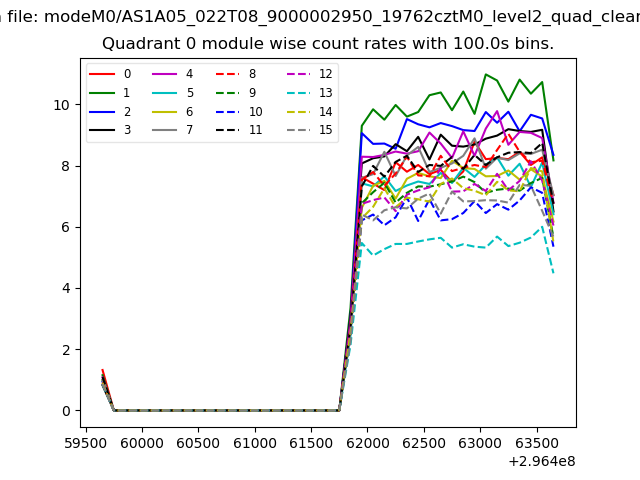 |
 |
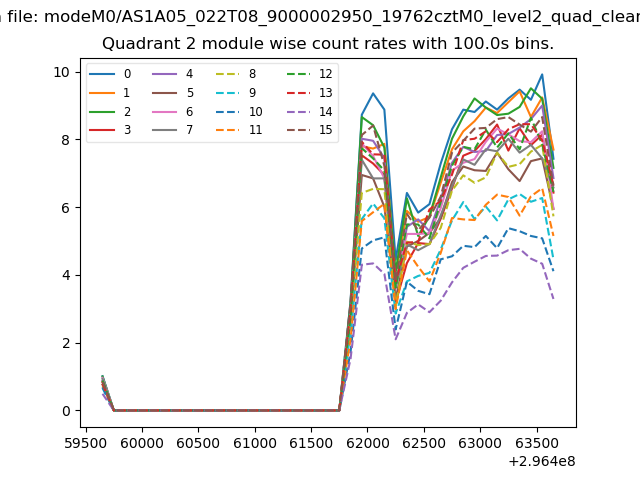
| Module-wise count rates for Quadrant B Data is divided into 100 sec bins |
 |
 |
| Module-wise count rates for Quadrant C Data is divided into 100 sec bins |
 |
 |
| Module-wise count rates for Quadrant D Data is divided into 100 sec bins |
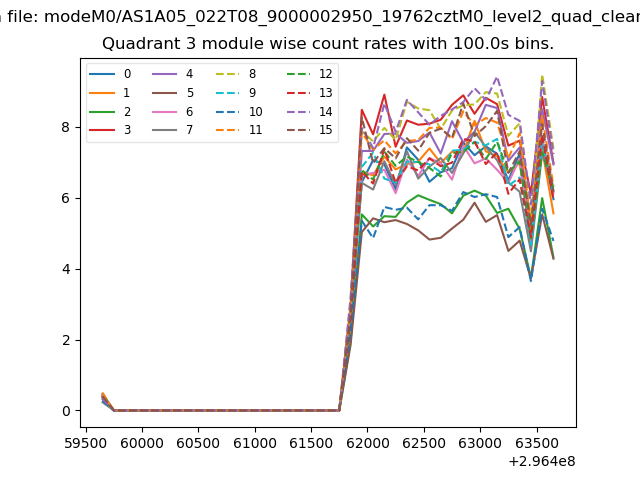 |
 |
| Parameter | Plot |
|---|---|
| CZT HV Monitor | 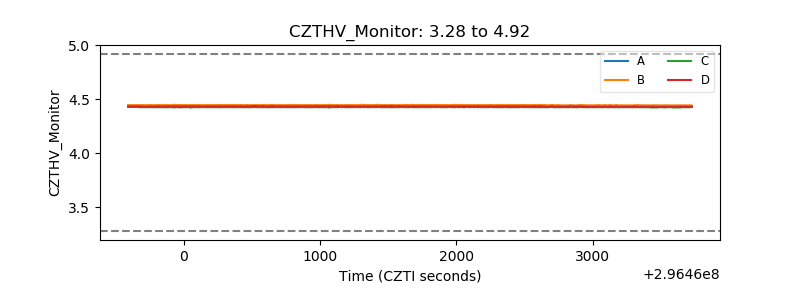 |
| D_VDD | 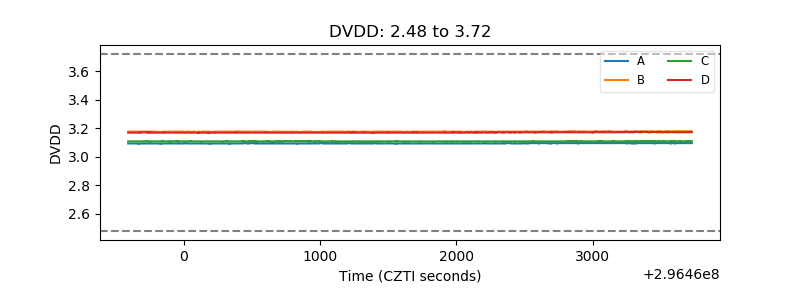 |
| Temperature 1 | 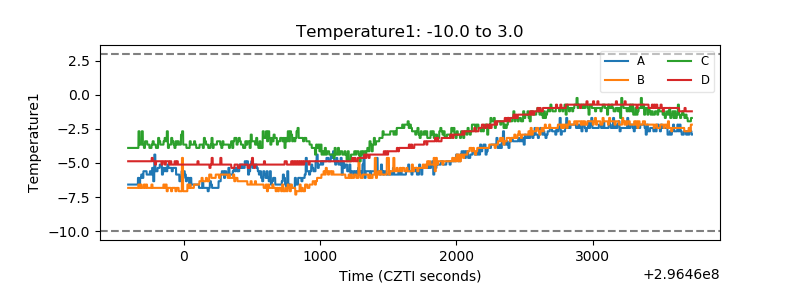 |
| Veto HV Monitor | 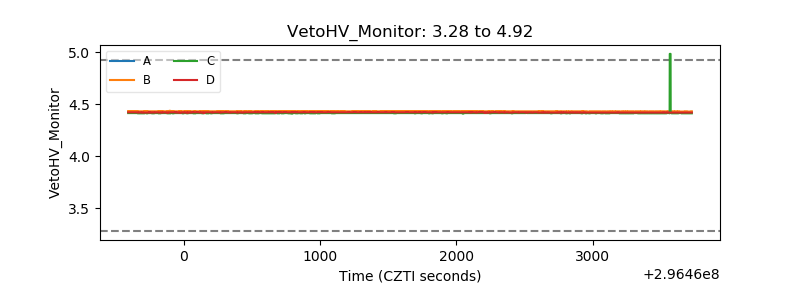 |
| Veto LLD | 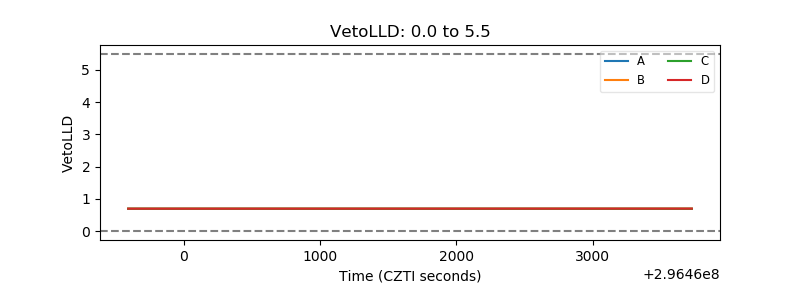 |
| Alpha Counter | 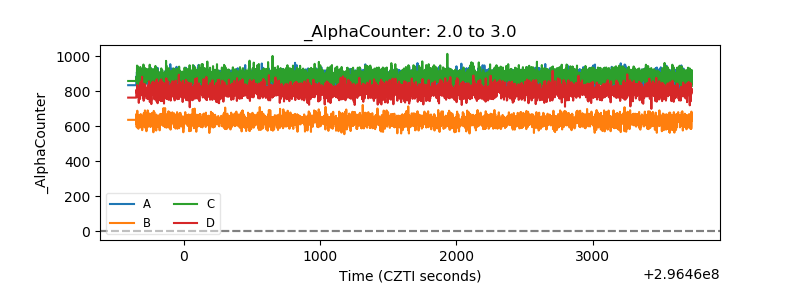 |
| _CPM_Rate | 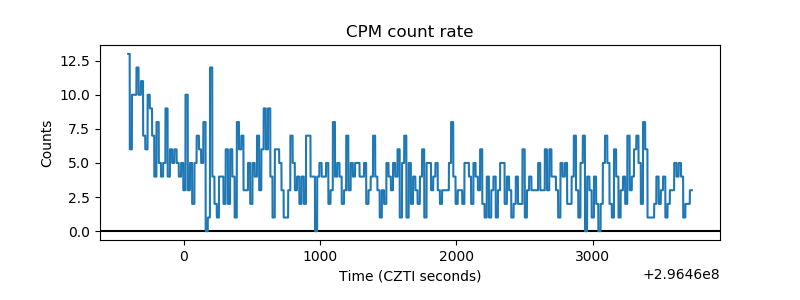 |
| CZT Counter | 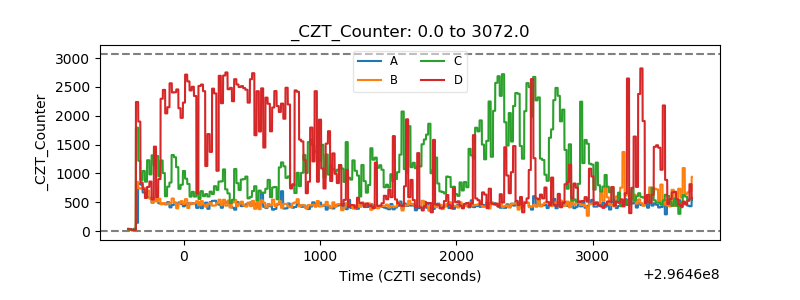 |
| +2.5 Volts monitor |  |
| +5 Volts monitor |  |
| _ROLL_ROT | 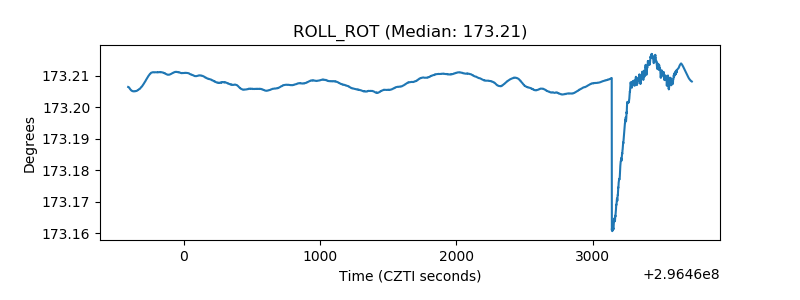 |
| _Roll_DEC | 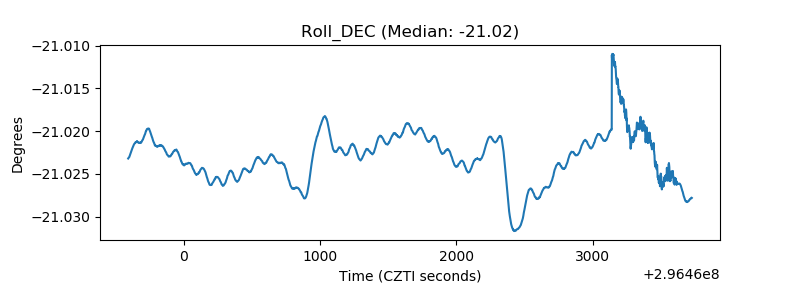 |
| _Roll_RA | 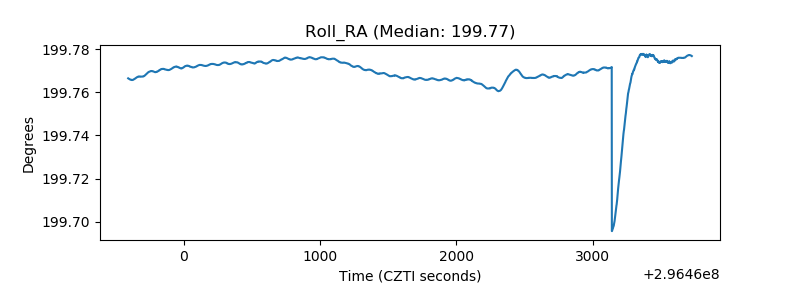 |
| Veto Counter | 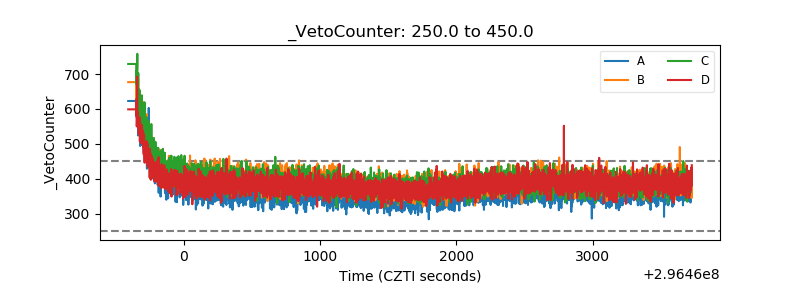 |