| Param | Original file | Final file |
|---|---|---|
| Filename | modeM0/AS1A05_088T05_9000002952cztM0_level2.fits | modeM0/AS1A05_088T05_9000002952cztM0_level2_quad_clean.evt |
| Size (bytes) | 331,611,840 | 342,552,960 |
| Size | 316.2 MB | 326.7 MB |
| Events in quadrant A | 2,054,130 | 2,200,492 |
| Events in quadrant B | 1,989,496 | 2,208,946 |
| Events in quadrant C | 1,834,020 | 1,663,564 |
| Events in quadrant D | 1,682,406 | 1,822,886 |
| Mode M0 | |||
|---|---|---|---|
| Quadrant | BADHDUFLAG | Total packets | Discarded packets |
| A | 0 | 75391 | 0 |
| B | 0 | 74742 | 0 |
| C | 0 | 135940 | 0 |
| D | 0 | 107918 | 0 |
| Mode SS | |||
|---|---|---|---|
| Quadrant | BADHDUFLAG | Total packets | Discarded packets |
| A | 0 | 734 | 0 |
| B | 0 | 734 | 0 |
| C | 0 | 734 | 0 |
| D | 0 | 734 | 0 |
| Mode M9 | |||
|---|---|---|---|
| Quadrant | BADHDUFLAG | Total packets | Discarded packets |
| A | 0 | 43 | 0 |
| B | 0 | 43 | 0 |
| C | 0 | 43 | 0 |
| D | 0 | 43 | 0 |
| Quadrant | Total seconds | Saturated seconds | Saturation percentage |
|---|---|---|---|
| A | 36081 | 724 | 2.006596% |
| B | 36081 | 750 | 2.078656% |
| C | 36081 | 6949 | 19.259444% |
| D | 36081 | 3628 | 10.055154% |
Noise dominated data is calculated using 1-second bins in cleaned event files. If a bin has >2000 counts, and if more than 50% of those come from <1% of pixels, then it is considered to be noise-dominated and hence unusable.
| Quadrant | # 1 sec bins | Bins with >0 counts | Bins with >2000 counts | High rate bins dominated by noise | Noise dominated (total time) | Noise dominated (detector-on time) | Marked lightcurve |
|---|---|---|---|---|---|---|---|
| A | 40291 | 36073 | 0 | 0 | 0.00% | 0.00% |  |
| B | 40291 | 36076 | 0 | 0 | 0.00% | 0.00% |  |
| C | 40291 | 36045 | 0 | 0 | 0.00% | 0.00% | 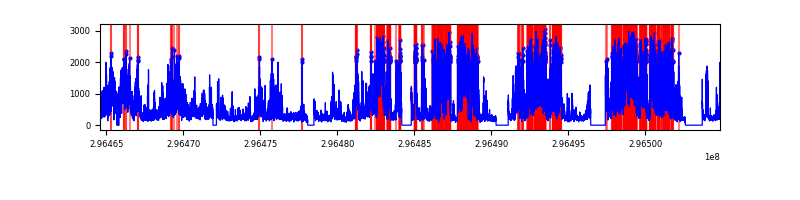 |
| D | 40291 | 36036 | 0 | 0 | 0.00% | 0.00% | 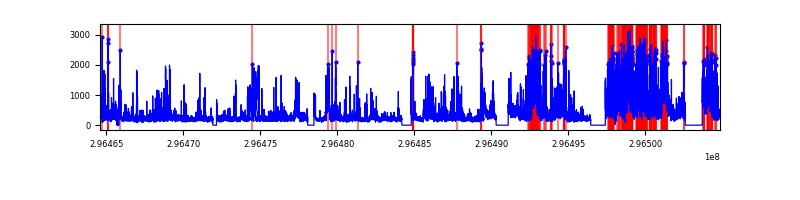 |
Top three noisy pixels from each quadrant. If the there are fewer than three noisy pixels in the level2.evt file, extra rows are filled as -1
| Pixel properties | Quadrant properties | ||||||
|---|---|---|---|---|---|---|---|
| Quadrant | DetID | PixID | Counts | Sigma | Mean | Median | Sigma |
| A | 0 | 29 | 1958 | 10.66 | 535 | 498 | 136.9 |
| A | 7 | 110 | 1665 | 8.52 | 535 | 498 | 136.9 |
| A | 0 | 30 | 1618 | 8.18 | 535 | 498 | 136.9 |
| B | 2 | 9 | 1697 | 11.16 | 524 | 498 | 107.5 |
| B | 14 | 254 | 1380 | 8.21 | 524 | 498 | 107.5 |
| B | 2 | 8 | 1372 | 8.13 | 524 | 498 | 107.5 |
| C | 1 | 80 | 1374 | 7.28 | 483 | 448 | 127.1 |
| C | 1 | 81 | 1355 | 7.13 | 483 | 448 | 127.1 |
| C | 12 | 241 | 1278 | 6.53 | 483 | 448 | 127.1 |
| D | 3 | 14 | 1302 | 6.78 | 479 | 436 | 127.7 |
| D | 10 | 189 | 1196 | 5.95 | 479 | 436 | 127.7 |
| D | 7 | 3 | 1189 | 5.9 | 479 | 436 | 127.7 |
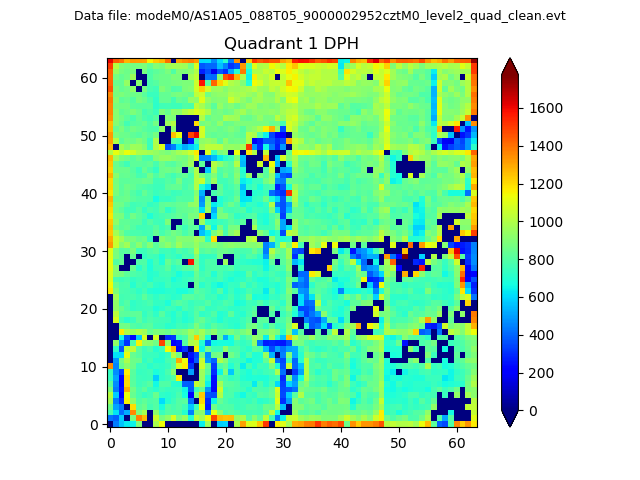
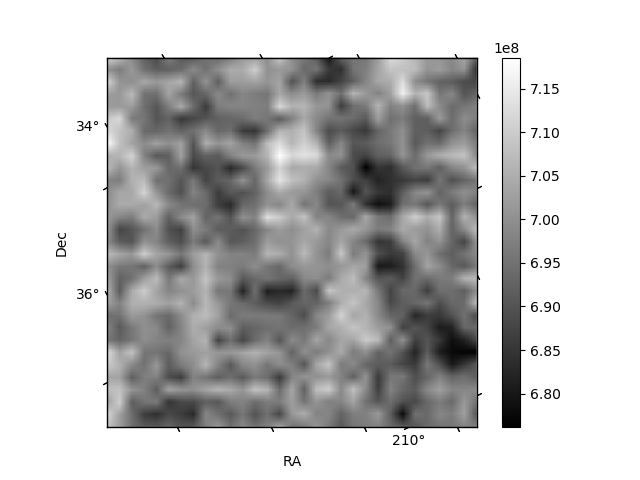
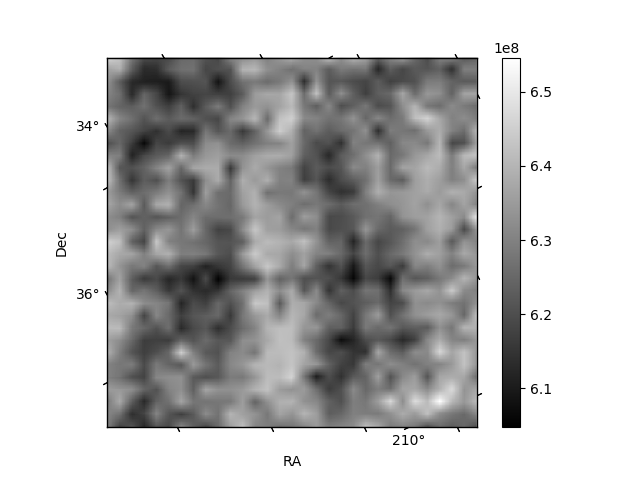
Histogram calculated using DETX and DETY for each event in the final _common_clean file
| Quadrant A |  |
 |
Quadrant B |
|---|---|---|---|
| Quadrant D | 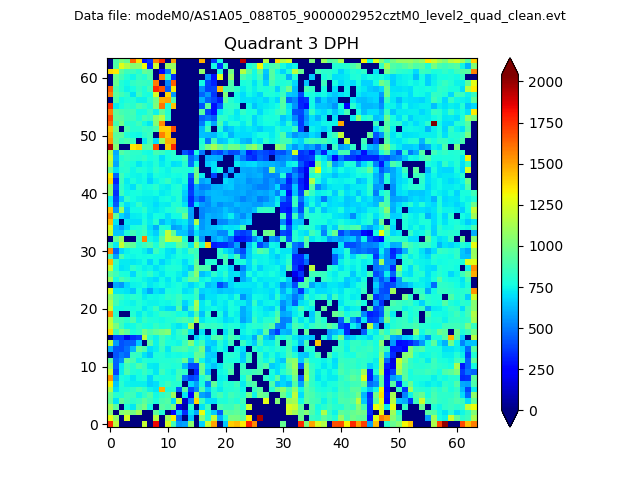 |
 |
Quadrant C |
| Plot type | Count rate plots | Images |
|---|---|---|
| Comparison with Poisson distribution Blue bars denote a histogram of data divided into 1 sec bins. Red curve is a Poisson curve with rate = median count rate of data. |
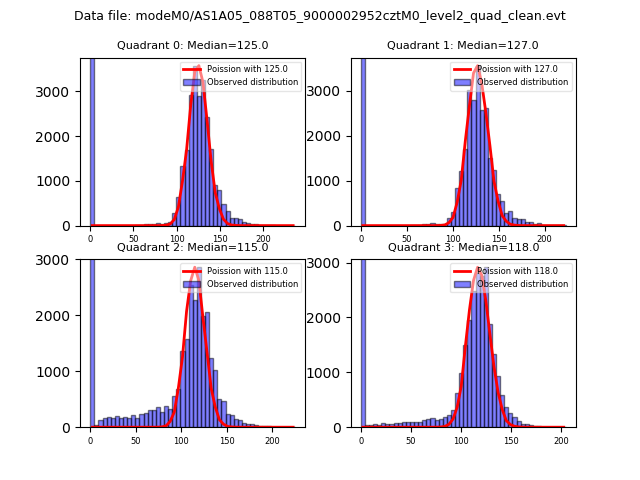 |
 |
| Quadrant-wise count rates Data is divided into 100 sec bins |
 |
|
| Module-wise count rates for Quadrant A Data is divided into 100 sec bins |
 |
 |
| Module-wise count rates for Quadrant B Data is divided into 100 sec bins |
 |
 |
| Module-wise count rates for Quadrant C Data is divided into 100 sec bins |
 |
 |
| Module-wise count rates for Quadrant D Data is divided into 100 sec bins |
 |
 |
| Parameter | Plot |
|---|---|
| CZT HV Monitor |  |
| D_VDD | 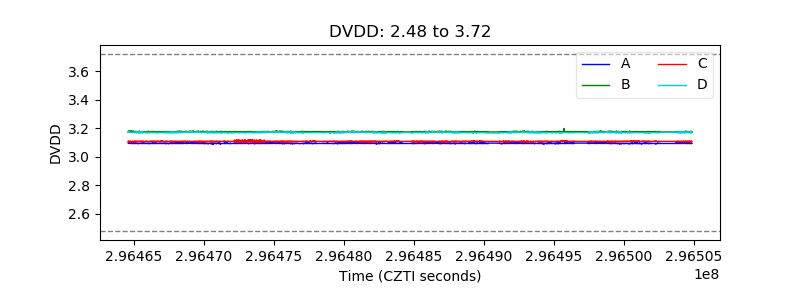 |
| Temperature 1 |  |
| Veto HV Monitor |  |
| Veto LLD |  |
| Alpha Counter | 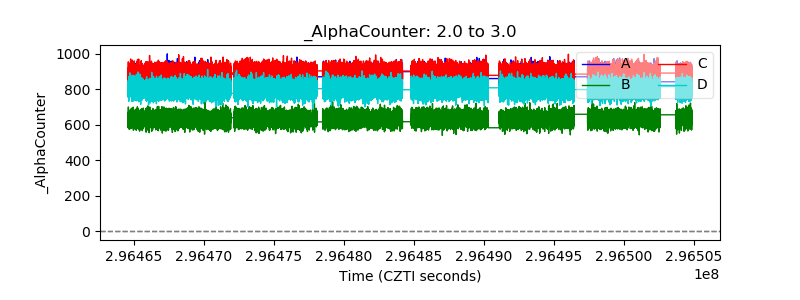 |
| _CPM_Rate | 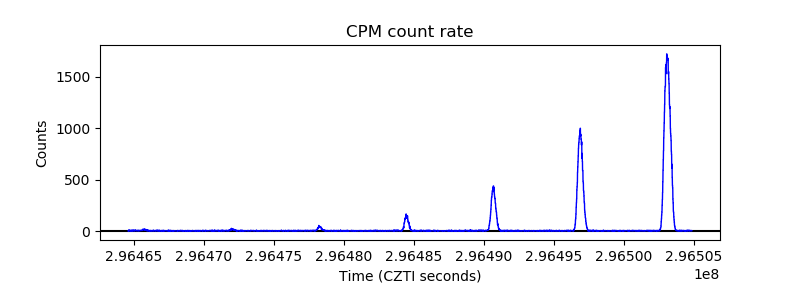 |
| CZT Counter |  |
| +2.5 Volts monitor |  |
| +5 Volts monitor |  |
| _ROLL_ROT |  |
| _Roll_DEC |  |
| _Roll_RA |  |
| Veto Counter | 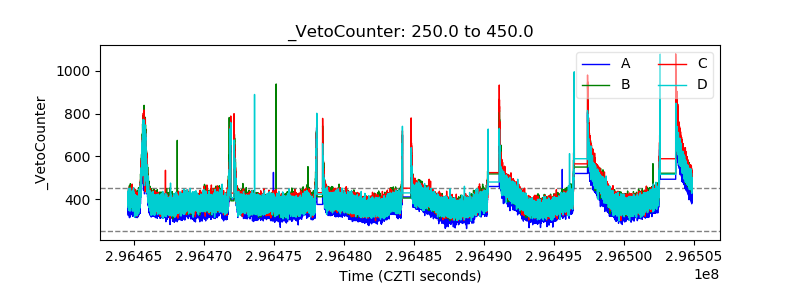 |