| Param | Original file | Final file |
|---|---|---|
| Filename | modeM0/AS1A05_088T05_9000002952_19762cztM0_level2.evt | modeM0/AS1A05_088T05_9000002952_19762cztM0_level2_quad_clean.evt |
| Size (bytes) | 271,984,320 | 26,225,280 |
| Size | 259.4 MB | 25.0 MB |
| Events in quadrant A | 1,596,850 | 153,537 |
| Events in quadrant B | 1,441,777 | 157,691 |
| Events in quadrant C | 3,292,928 | 138,583 |
| Events in quadrant D | 1,718,783 | 148,372 |
| Mode M0 | |||
|---|---|---|---|
| Quadrant | BADHDUFLAG | Total packets | Discarded packets |
| A | 0 | 6517 | 2 |
| B | 0 | 5975 | 1 |
| C | 0 | 11687 | 1 |
| D | 0 | 6988 | 1 |
| Mode SS | |||
|---|---|---|---|
| Quadrant | BADHDUFLAG | Total packets | Discarded packets |
| A | 0 | 58 | 0 |
| B | 0 | 58 | 0 |
| C | 0 | 58 | 0 |
| D | 0 | 58 | 0 |
| Mode M9 | |||
|---|---|---|---|
| Quadrant | BADHDUFLAG | Total packets | Discarded packets |
| A | 0 | 2 | 0 |
| B | 0 | 2 | 0 |
| C | 0 | 2 | 0 |
| D | 0 | 2 | 0 |
| Quadrant | Total seconds | Saturated seconds | Saturation percentage |
|---|---|---|---|
| A | 2724 | 268 | 9.838473% |
| B | 2724 | 256 | 9.397944% |
| C | 2724 | 664 | 24.375918% |
| D | 2724 | 252 | 9.251101% |
Noise dominated data is calculated using 1-second bins in cleaned event files. If a bin has >2000 counts, and if more than 50% of those come from <1% of pixels, then it is considered to be noise-dominated and hence unusable.
| Quadrant | # 1 sec bins | Bins with >0 counts | Bins with >2000 counts | High rate bins dominated by noise | Noise dominated (total time) | Noise dominated (detector-on time) | Marked lightcurve |
|---|---|---|---|---|---|---|---|
| A | 2829 | 2726 | 29 | 29 | 1.03% | 1.06% | 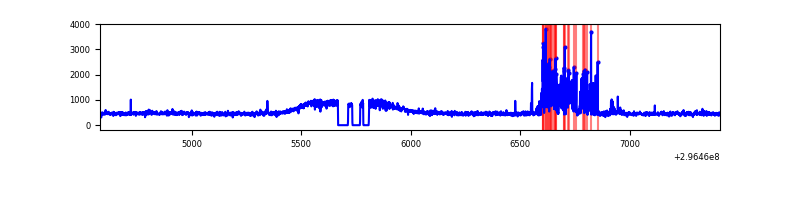 |
| B | 2829 | 2725 | 0 | 0 | 0.00% | 0.00% |  |
| C | 2829 | 2724 | 168 | 168 | 5.94% | 6.17% |  |
| D | 2829 | 2727 | 58 | 58 | 2.05% | 2.13% | 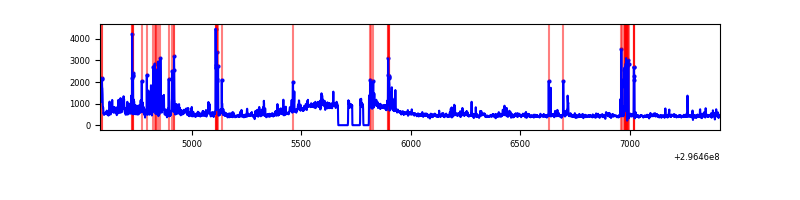 |
Top three noisy pixels from each quadrant. If the there are fewer than three noisy pixels in the level2.evt file, extra rows are filled as -1
| Pixel properties | Quadrant properties | ||||||
|---|---|---|---|---|---|---|---|
| Quadrant | DetID | PixID | Counts | Sigma | Mean | Median | Sigma |
| A | 4 | 2 | 216466 | 2821.3 | 357 | 347 | 76.6 |
| A | 0 | 226 | 3206 | 37.32 | 357 | 347 | 76.6 |
| A | 3 | 137 | 3148 | 36.57 | 357 | 347 | 76.6 |
| B | 0 | 198 | 19349 | 260.52 | 358 | 348 | 72.9 |
| B | 0 | 197 | 10056 | 133.1 | 358 | 348 | 72.9 |
| B | 12 | 111 | 9087 | 119.82 | 358 | 348 | 72.9 |
| C | 3 | 233 | 2003331 | 25791.63 | 318 | 319 | 77.7 |
| C | 14 | 238 | 47350 | 605.59 | 318 | 319 | 77.7 |
| C | 13 | 61 | 2289 | 25.37 | 318 | 319 | 77.7 |
| D | 1 | 52 | 265628 | 3095.34 | 344 | 333 | 85.7 |
| D | 7 | 238 | 111017 | 1291.41 | 344 | 333 | 85.7 |
| D | 12 | 218 | 26210 | 301.92 | 344 | 333 | 85.7 |
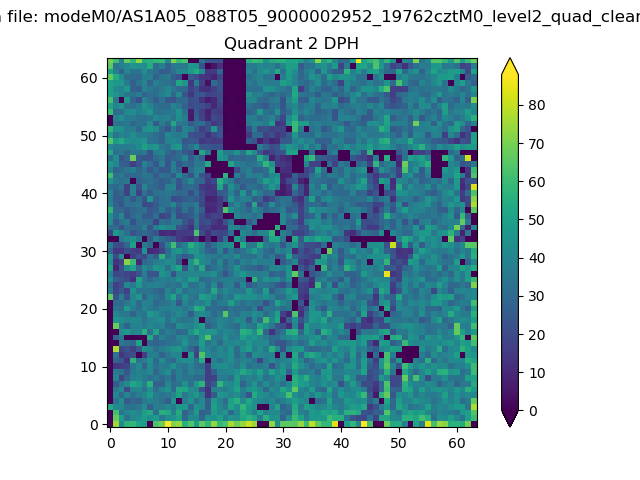
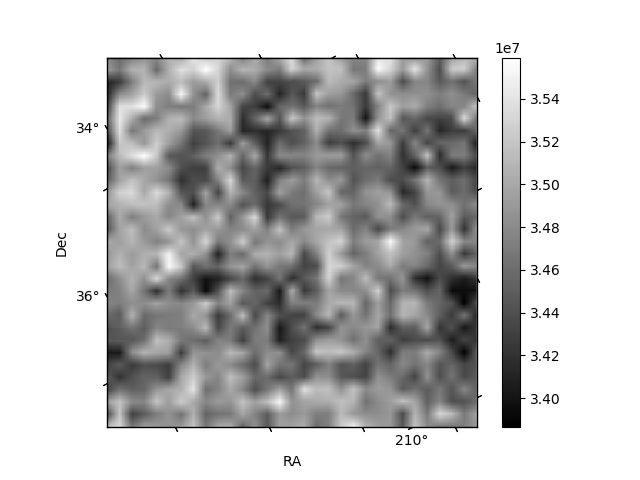
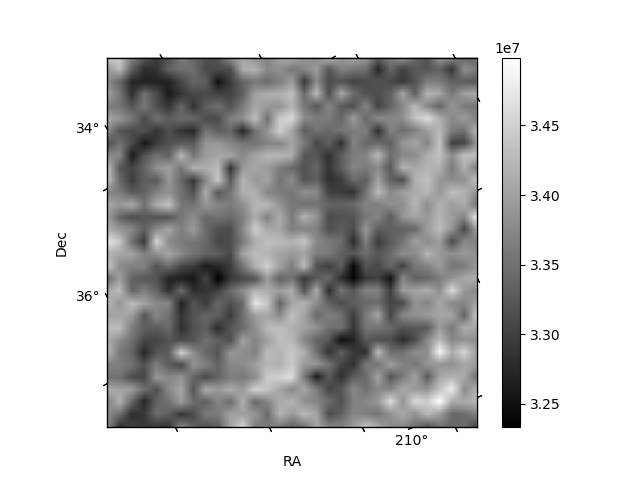
Histogram calculated using DETX and DETY for each event in the final _common_clean file
| Quadrant A | 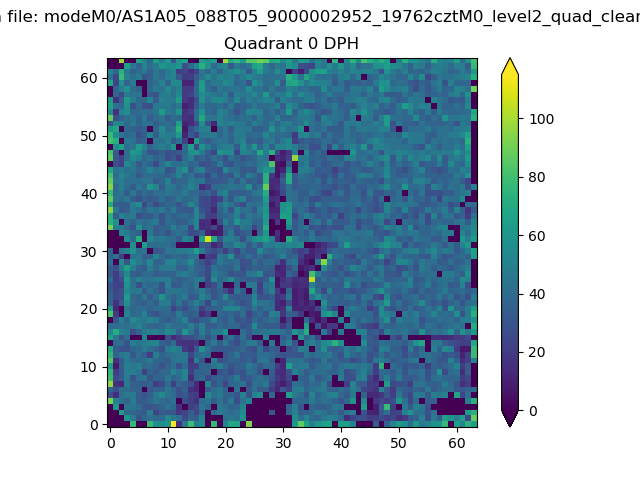 |
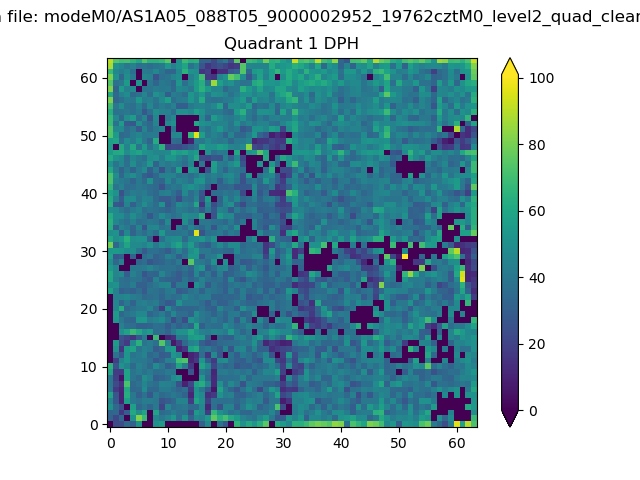 |
Quadrant B |
|---|---|---|---|
| Quadrant D | 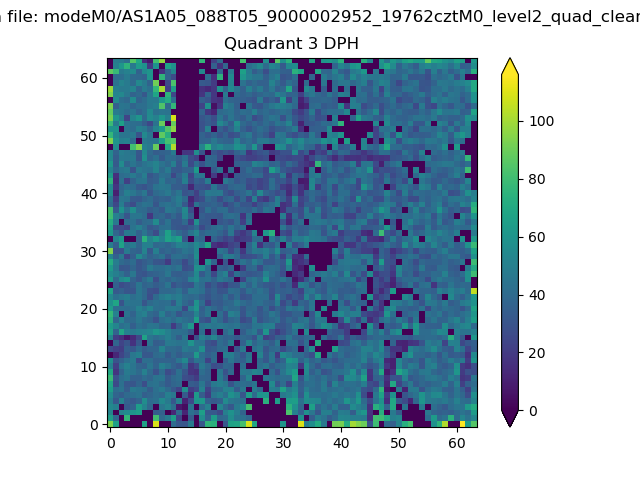 |
 |
Quadrant C |
| Plot type | Count rate plots | Images |
|---|---|---|
| Comparison with Poisson distribution Blue bars denote a histogram of data divided into 1 sec bins. Red curve is a Poisson curve with rate = median count rate of data. |
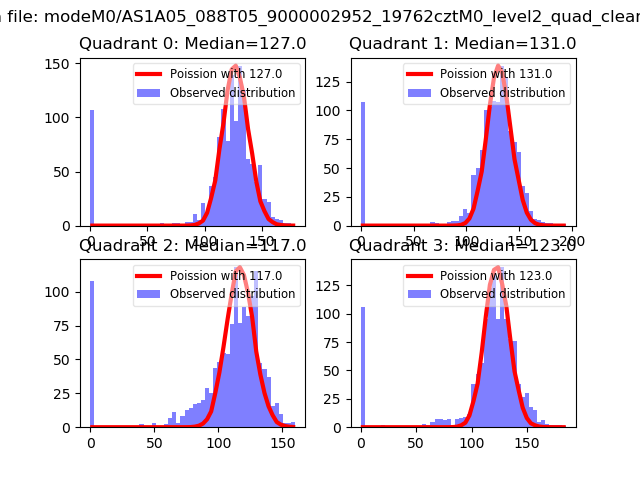 |
 |
| Quadrant-wise count rates Data is divided into 100 sec bins |
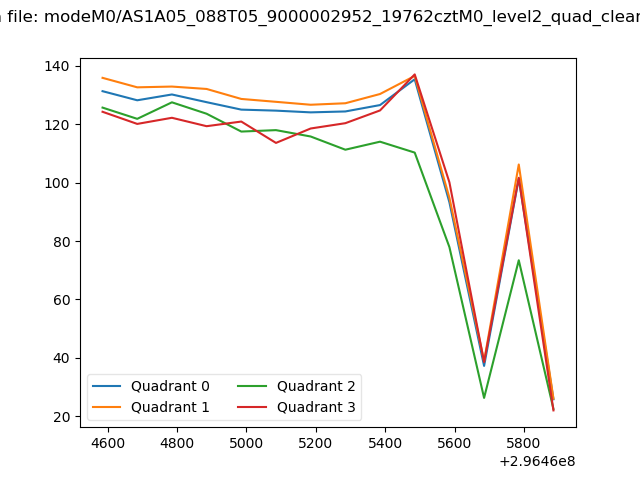 |
|
| Module-wise count rates for Quadrant A Data is divided into 100 sec bins |
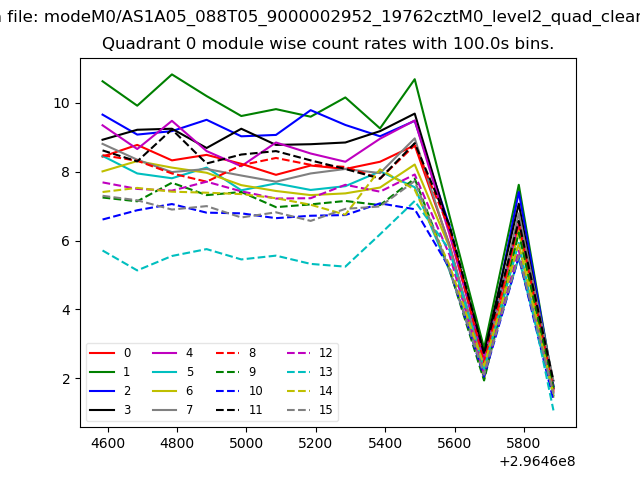 |
 |
| Module-wise count rates for Quadrant B Data is divided into 100 sec bins |
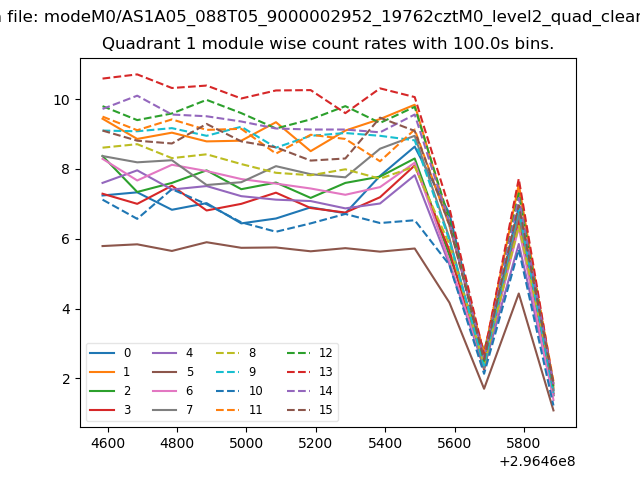 |
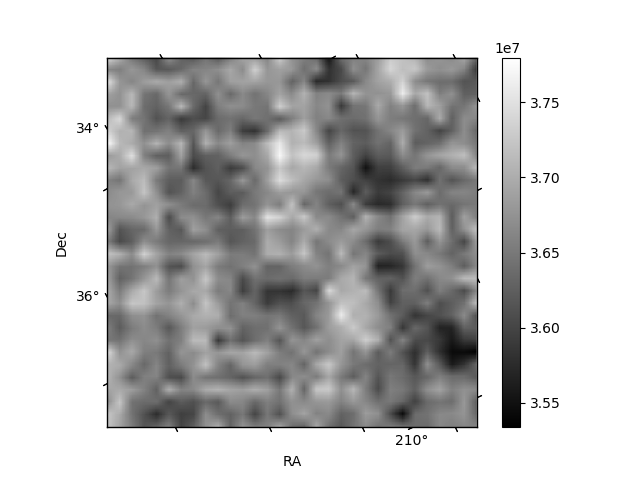 |
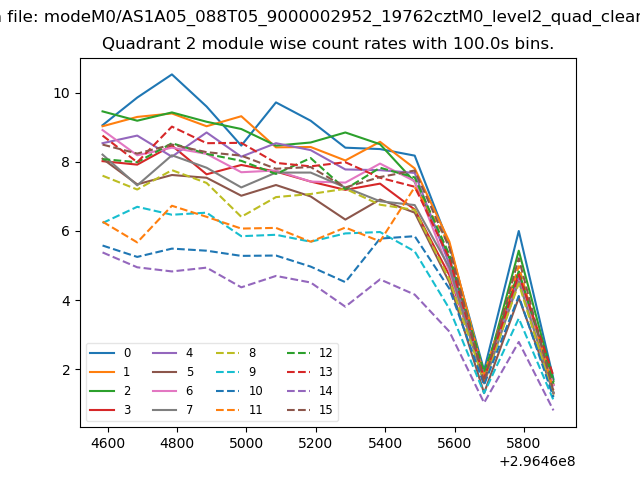
| Module-wise count rates for Quadrant C Data is divided into 100 sec bins |
 |
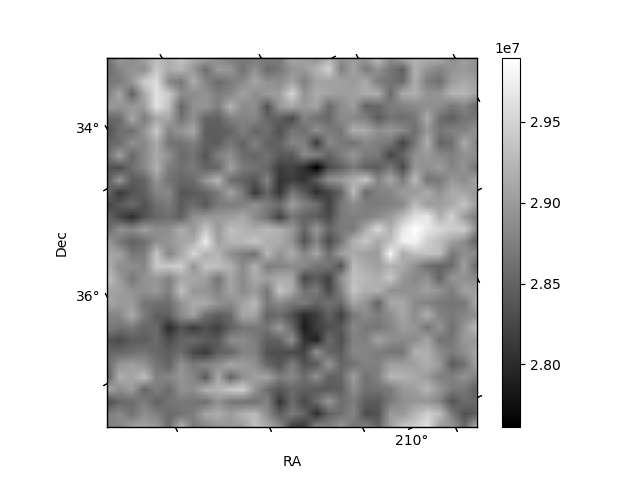 |
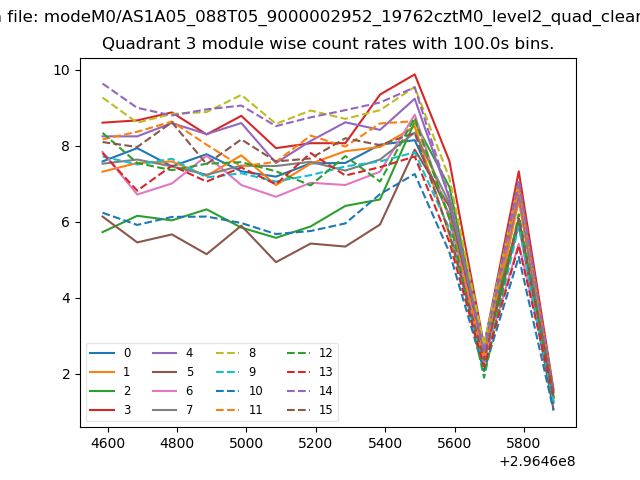
| Module-wise count rates for Quadrant D Data is divided into 100 sec bins |
 |
 |
| Parameter | Plot |
|---|---|
| CZT HV Monitor | 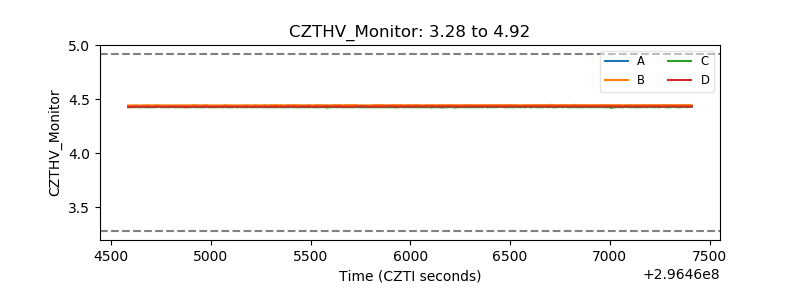 |
| D_VDD | 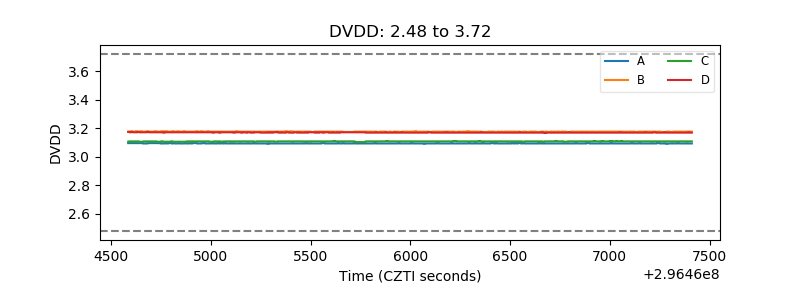 |
| Temperature 1 | 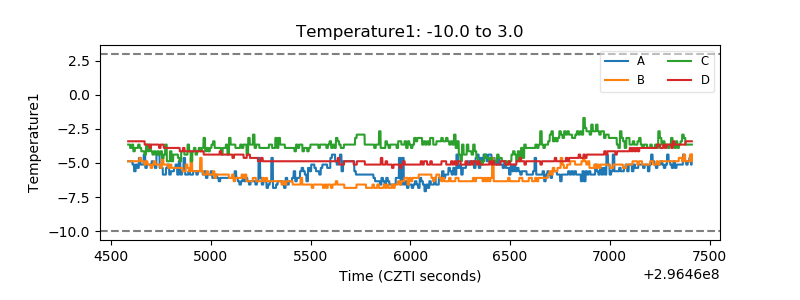 |
| Veto HV Monitor | 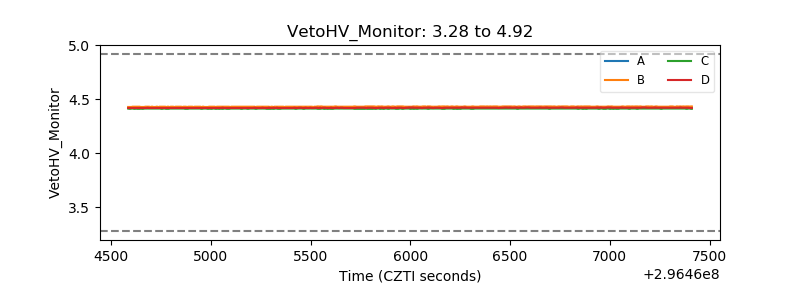 |
| Veto LLD | 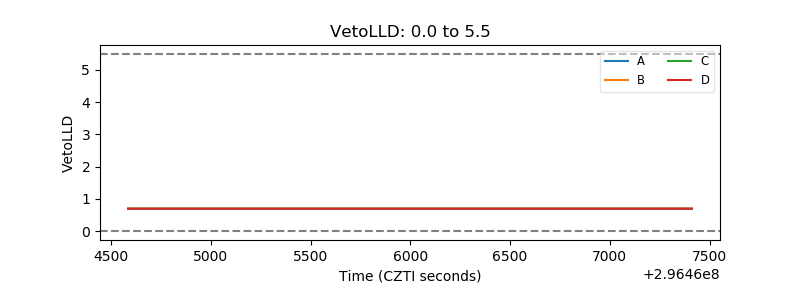 |
| Alpha Counter | 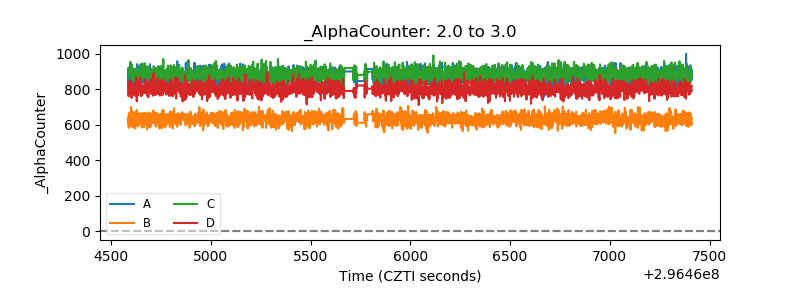 |
| _CPM_Rate | 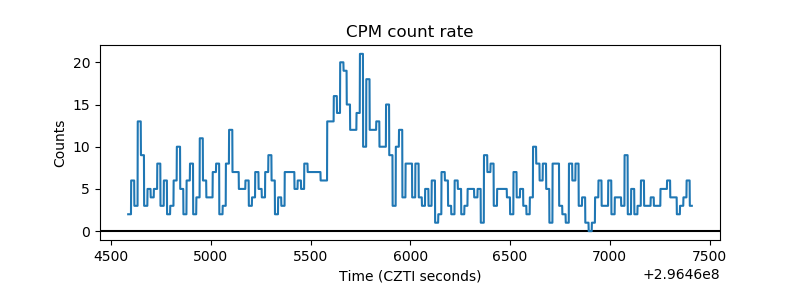 |
| CZT Counter | 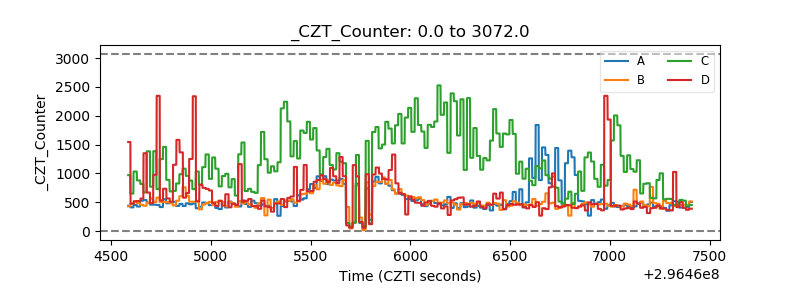 |
| +2.5 Volts monitor | 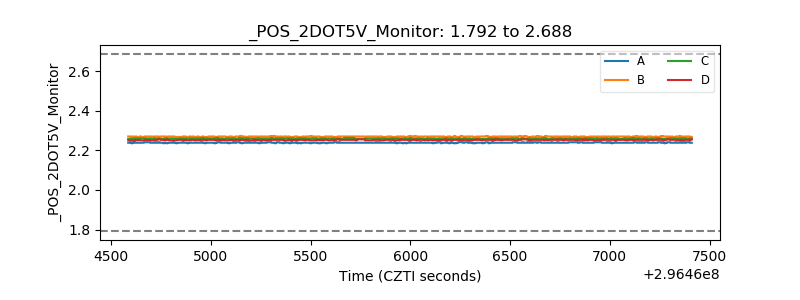 |
| +5 Volts monitor |  |
| _ROLL_ROT | 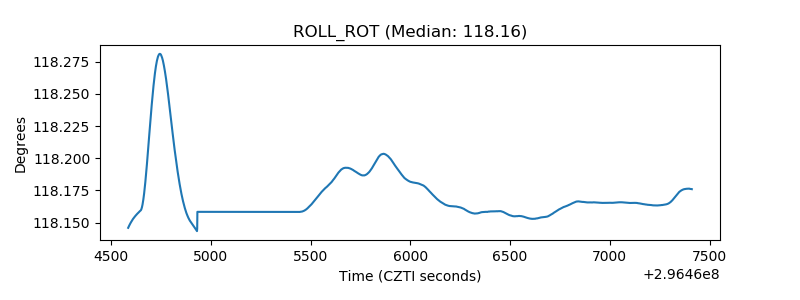 |
| _Roll_DEC | 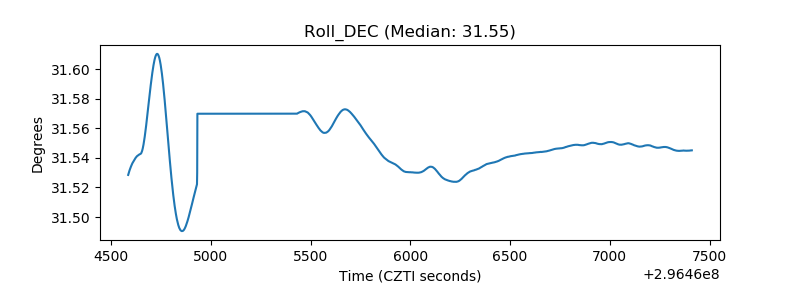 |
| _Roll_RA | 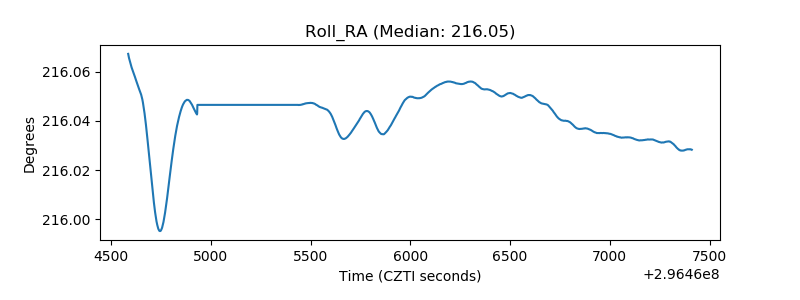 |
| Veto Counter | 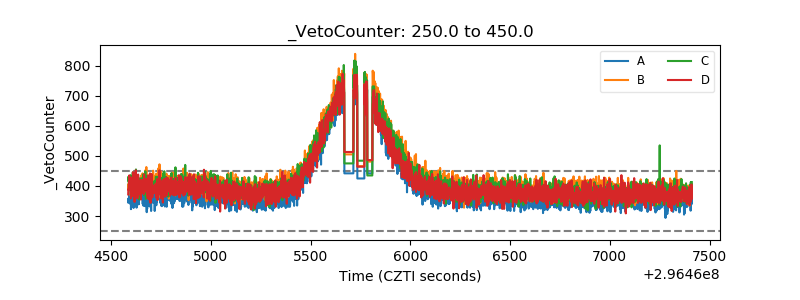 |