| Param | Original file | Final file |
|---|---|---|
| Filename | modeM0/AS1A05_088T05_9000002952_19763cztM0_level2.evt | modeM0/AS1A05_088T05_9000002952_19763cztM0_level2_quad_clean.evt |
| Size (bytes) | 658,923,840 | 83,963,520 |
| Size | 628.4 MB | 80.1 MB |
| Events in quadrant A | 4,114,357 | 507,037 |
| Events in quadrant B | 3,983,782 | 516,197 |
| Events in quadrant C | 7,056,207 | 473,870 |
| Events in quadrant D | 4,254,277 | 484,125 |
| Mode M0 | |||
|---|---|---|---|
| Quadrant | BADHDUFLAG | Total packets | Discarded packets |
| A | 0 | 17587 | 3 |
| B | 0 | 16987 | 2 |
| C | 0 | 26507 | 2 |
| D | 0 | 18147 | 2 |
| Mode SS | |||
|---|---|---|---|
| Quadrant | BADHDUFLAG | Total packets | Discarded packets |
| A | 0 | 166 | 0 |
| B | 0 | 166 | 0 |
| C | 0 | 166 | 0 |
| D | 0 | 166 | 0 |
| Mode M9 | |||
|---|---|---|---|
| Quadrant | BADHDUFLAG | Total packets | Discarded packets |
| A | 0 | 4 | 0 |
| B | 0 | 4 | 0 |
| C | 0 | 4 | 0 |
| D | 0 | 4 | 0 |
| Quadrant | Total seconds | Saturated seconds | Saturation percentage |
|---|---|---|---|
| A | 8075 | 418 | 5.176471% |
| B | 8075 | 422 | 5.226006% |
| C | 8075 | 958 | 11.863777% |
| D | 8075 | 362 | 4.482972% |
Noise dominated data is calculated using 1-second bins in cleaned event files. If a bin has >2000 counts, and if more than 50% of those come from <1% of pixels, then it is considered to be noise-dominated and hence unusable.
| Quadrant | # 1 sec bins | Bins with >0 counts | Bins with >2000 counts | High rate bins dominated by noise | Noise dominated (total time) | Noise dominated (detector-on time) | Marked lightcurve |
|---|---|---|---|---|---|---|---|
| A | 8410 | 8077 | 31 | 31 | 0.37% | 0.38% | 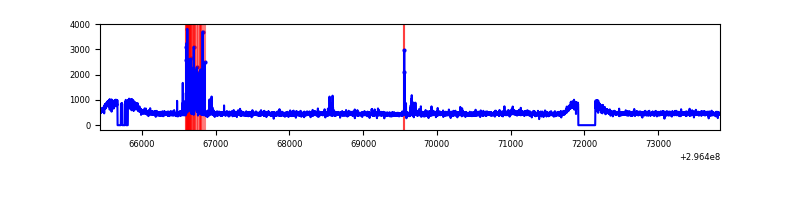 |
| B | 8410 | 8077 | 1 | 1 | 0.01% | 0.01% | 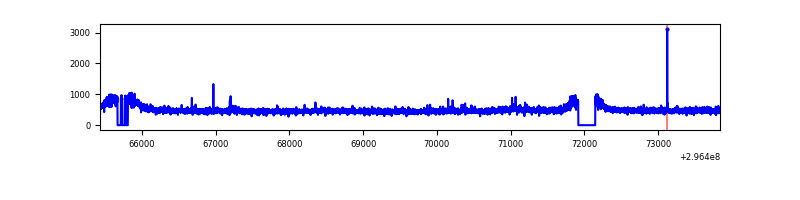 |
| C | 8410 | 8076 | 200 | 200 | 2.38% | 2.48% | 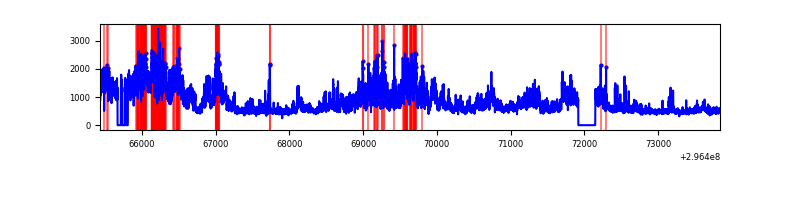 |
| D | 8410 | 8079 | 64 | 64 | 0.76% | 0.79% | 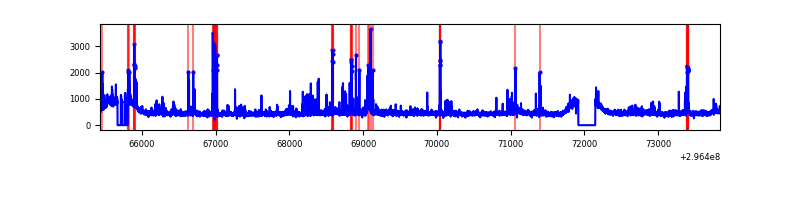 |
Top three noisy pixels from each quadrant. If the there are fewer than three noisy pixels in the level2.evt file, extra rows are filled as -1
| Pixel properties | Quadrant properties | ||||||
|---|---|---|---|---|---|---|---|
| Quadrant | DetID | PixID | Counts | Sigma | Mean | Median | Sigma |
| A | 4 | 2 | 248380 | 1199.56 | 1002 | 977 | 206.2 |
| A | 0 | 226 | 8768 | 37.78 | 1002 | 977 | 206.2 |
| A | 3 | 137 | 8626 | 37.09 | 1002 | 977 | 206.2 |
| B | 0 | 198 | 41345 | 205.48 | 999 | 971 | 196.5 |
| B | 12 | 111 | 24589 | 120.2 | 999 | 971 | 196.5 |
| B | 11 | 111 | 21434 | 104.15 | 999 | 971 | 196.5 |
| C | 3 | 233 | 3274107 | 14845.51 | 930 | 933 | 220.5 |
| C | 14 | 238 | 140985 | 635.21 | 930 | 933 | 220.5 |
| C | 7 | 220 | 10244 | 42.23 | 930 | 933 | 220.5 |
| D | 1 | 52 | 337335 | 1418.33 | 971 | 940 | 237.2 |
| D | 7 | 238 | 172436 | 723.07 | 971 | 940 | 237.2 |
| D | 2 | 234 | 32814 | 134.39 | 971 | 940 | 237.2 |
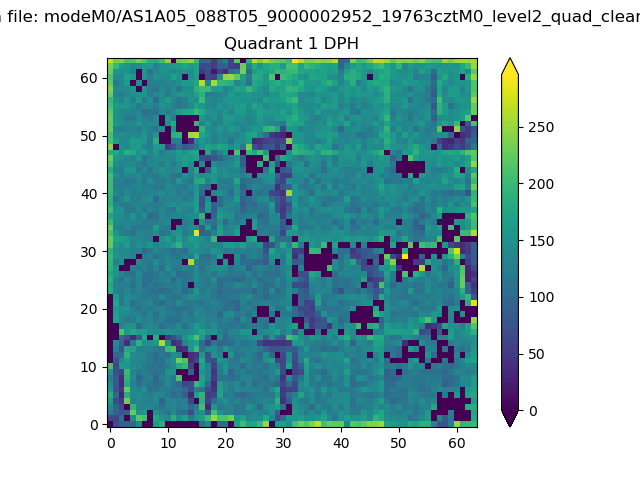
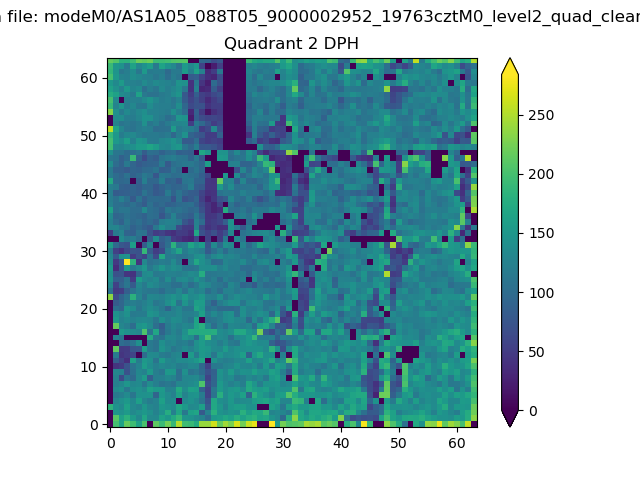
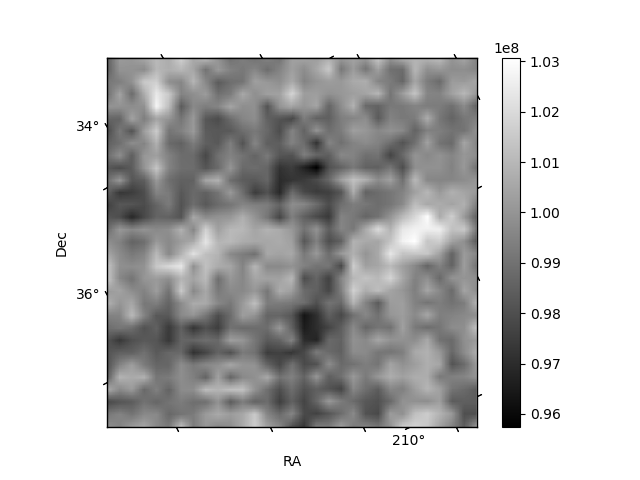
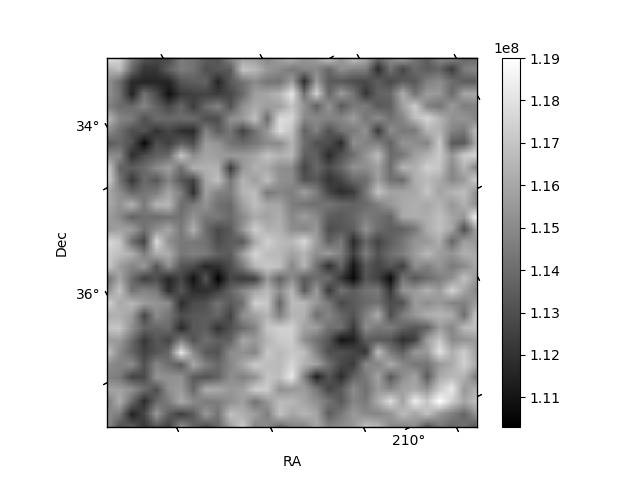
Histogram calculated using DETX and DETY for each event in the final _common_clean file
| Quadrant A |  |
 |
Quadrant B |
|---|---|---|---|
| Quadrant D |  |
 |
Quadrant C |
| Plot type | Count rate plots | Images |
|---|---|---|
| Comparison with Poisson distribution Blue bars denote a histogram of data divided into 1 sec bins. Red curve is a Poisson curve with rate = median count rate of data. |
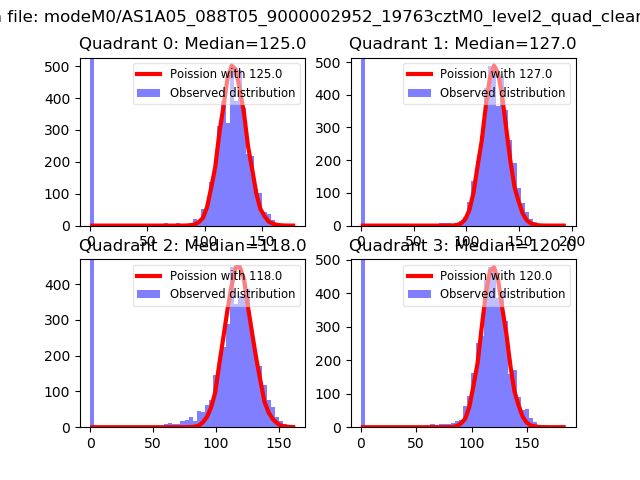 |
 |
| Quadrant-wise count rates Data is divided into 100 sec bins |
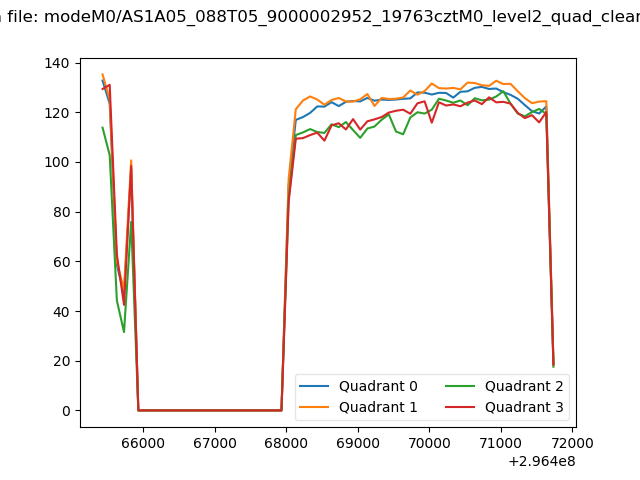 |
|
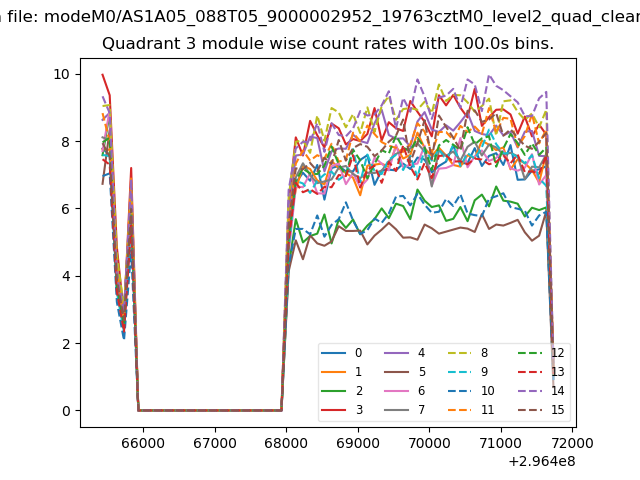
| Module-wise count rates for Quadrant A Data is divided into 100 sec bins |
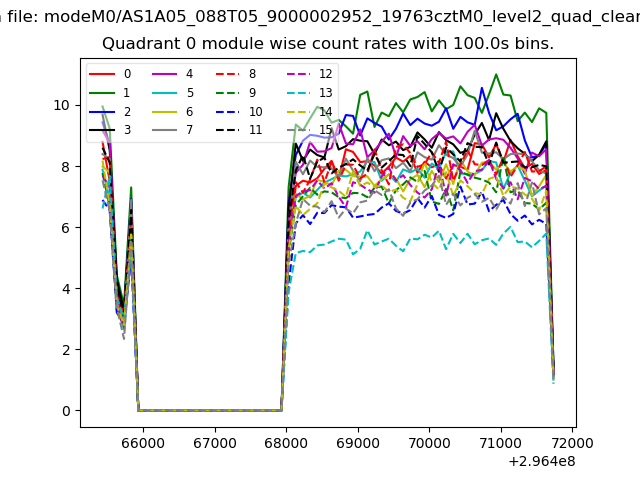 |
 |
| Module-wise count rates for Quadrant B Data is divided into 100 sec bins |
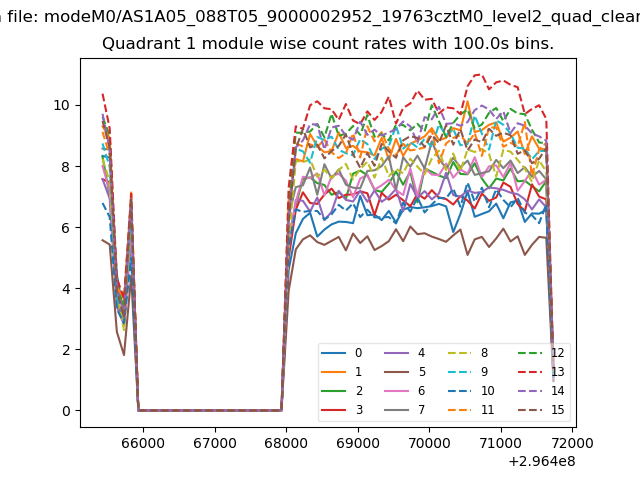 |
 |
| Module-wise count rates for Quadrant C Data is divided into 100 sec bins |
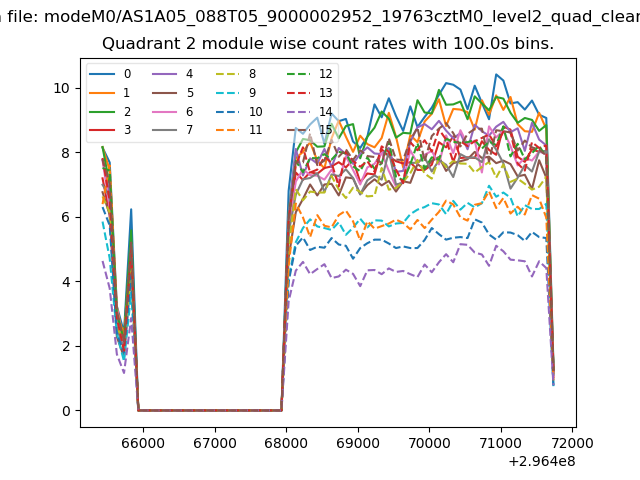 |
 |
| Module-wise count rates for Quadrant D Data is divided into 100 sec bins |
 |
 |
| Parameter | Plot |
|---|---|
| CZT HV Monitor | 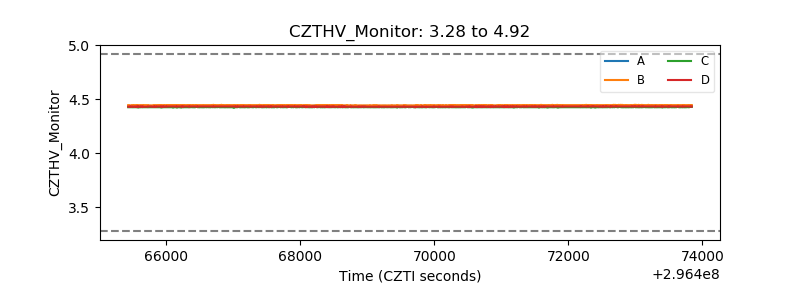 |
| D_VDD |  |
| Temperature 1 | 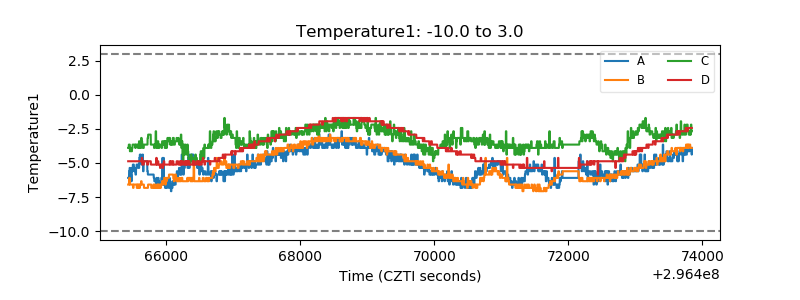 |
| Veto HV Monitor | 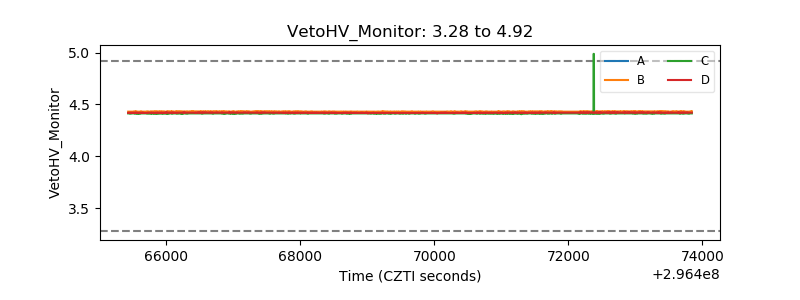 |
| Veto LLD | 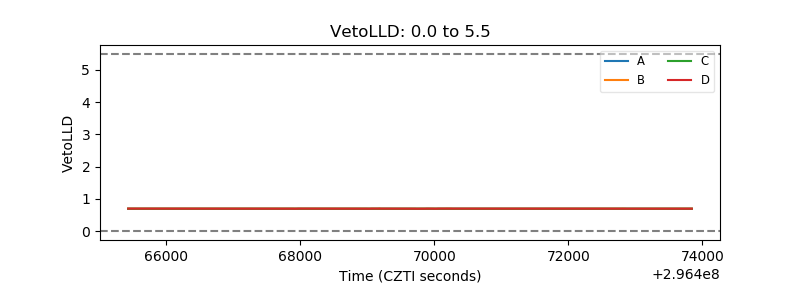 |
| Alpha Counter | 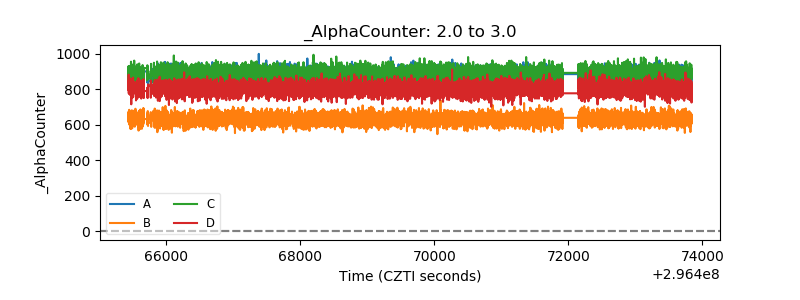 |
| _CPM_Rate | 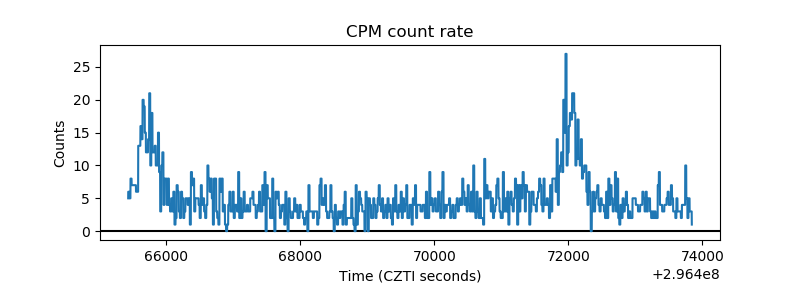 |
| CZT Counter | 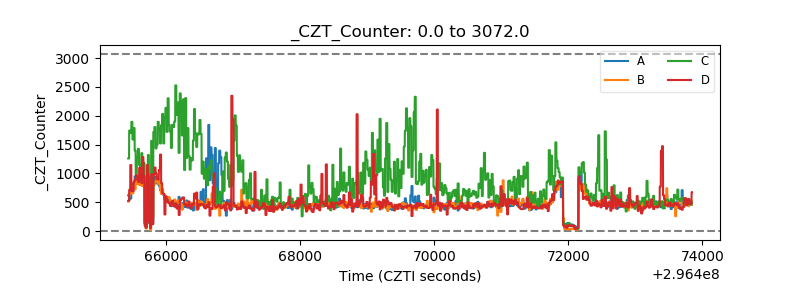 |
| +2.5 Volts monitor |  |
| +5 Volts monitor | 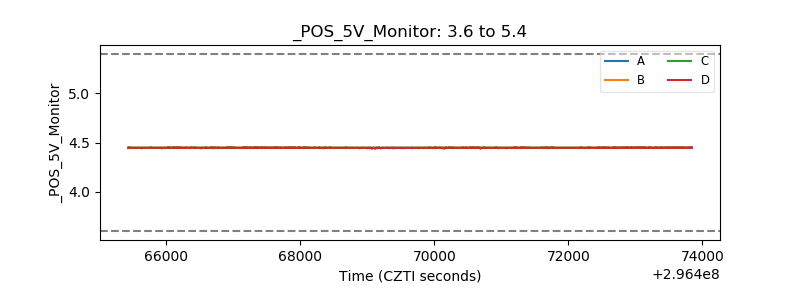 |
| _ROLL_ROT | 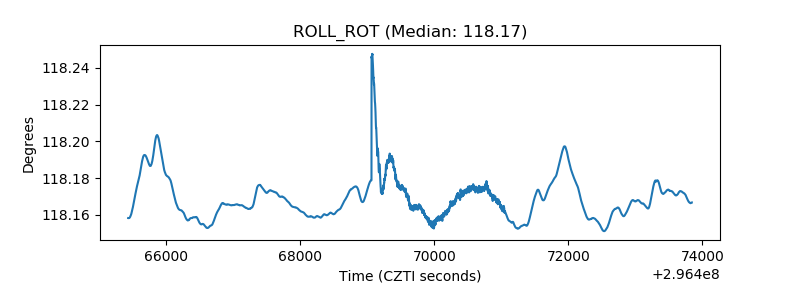 |
| _Roll_DEC | 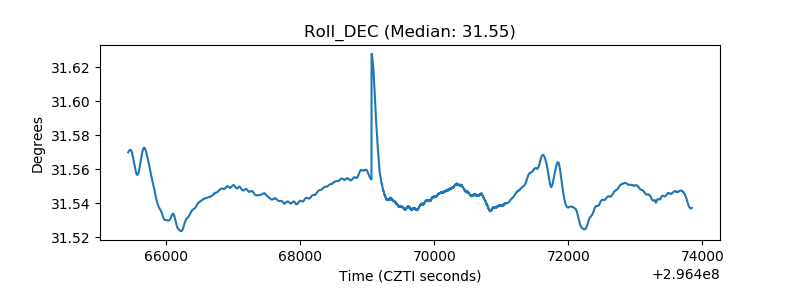 |
| _Roll_RA | 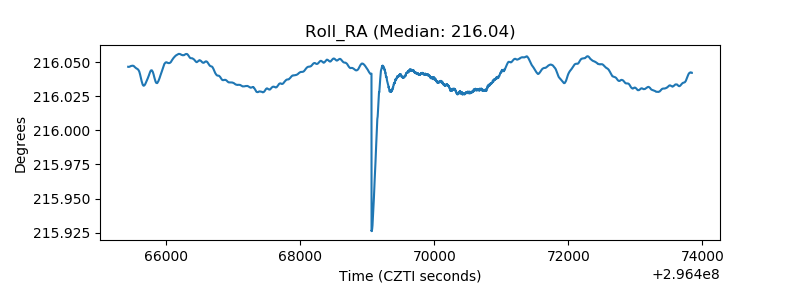 |
| Veto Counter | 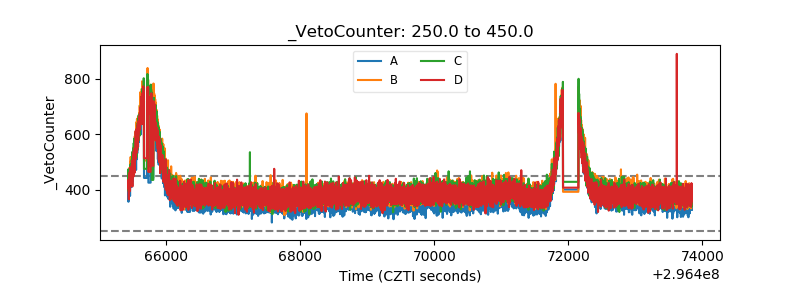 |