| Param | Original file | Final file |
|---|---|---|
| Filename | modeM0/AS1A05_088T05_9000002952_19766cztM0_level2.evt | modeM0/AS1A05_088T05_9000002952_19766cztM0_level2_quad_clean.evt |
| Size (bytes) | 1,597,489,920 | 235,604,160 |
| Size | 1.5 GB | 224.7 MB |
| Events in quadrant A | 8,827,355 | 1,529,435 |
| Events in quadrant B | 8,969,760 | 1,547,754 |
| Events in quadrant C | 17,776,747 | 1,319,626 |
| Events in quadrant D | 11,530,190 | 1,435,402 |
| Mode M0 | |||
|---|---|---|---|
| Quadrant | BADHDUFLAG | Total packets | Discarded packets |
| A | 0 | 38838 | 4 |
| B | 0 | 38924 | 4 |
| C | 0 | 65173 | 11 |
| D | 0 | 47368 | 4 |
| Mode SS | |||
|---|---|---|---|
| Quadrant | BADHDUFLAG | Total packets | Discarded packets |
| A | 0 | 384 | 0 |
| B | 0 | 384 | 0 |
| C | 0 | 384 | 0 |
| D | 0 | 384 | 0 |
| Mode M9 | |||
|---|---|---|---|
| Quadrant | BADHDUFLAG | Total packets | Discarded packets |
| A | 0 | 20 | 0 |
| B | 0 | 20 | 0 |
| C | 0 | 20 | 0 |
| D | 0 | 20 | 0 |
| Quadrant | Total seconds | Saturated seconds | Saturation percentage |
|---|---|---|---|
| A | 18906 | 356 | 1.883000% |
| B | 18907 | 393 | 2.078595% |
| C | 18906 | 3173 | 16.783032% |
| D | 18906 | 845 | 4.469481% |
Noise dominated data is calculated using 1-second bins in cleaned event files. If a bin has >2000 counts, and if more than 50% of those come from <1% of pixels, then it is considered to be noise-dominated and hence unusable.
| Quadrant | # 1 sec bins | Bins with >0 counts | Bins with >2000 counts | High rate bins dominated by noise | Noise dominated (total time) | Noise dominated (detector-on time) | Marked lightcurve |
|---|---|---|---|---|---|---|---|
| A | 20956 | 18907 | 0 | 0 | 0.00% | 0.00% | 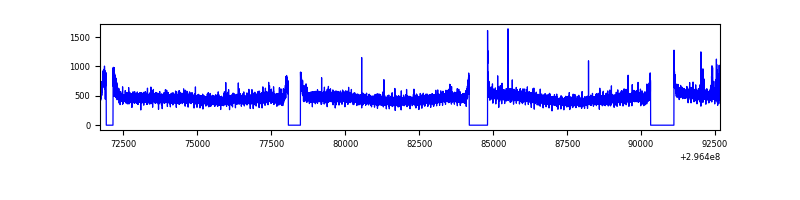 |
| B | 20957 | 18910 | 6 | 6 | 0.03% | 0.03% | 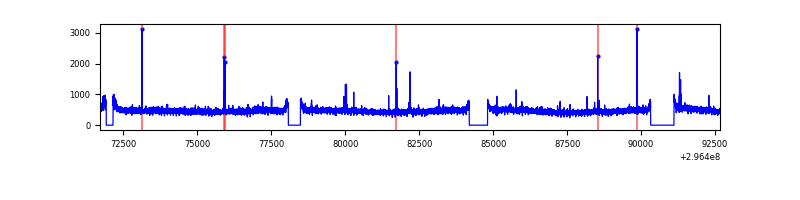 |
| C | 20955 | 18907 | 2160 | 2160 | 10.31% | 11.42% | 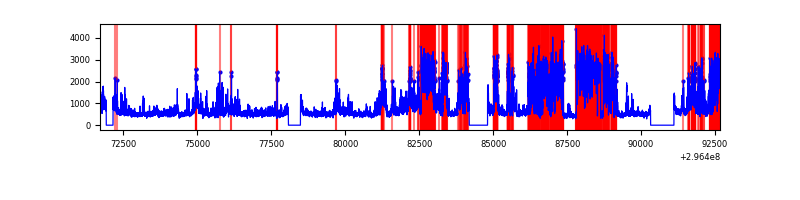 |
| D | 20956 | 18909 | 506 | 506 | 2.41% | 2.68% | 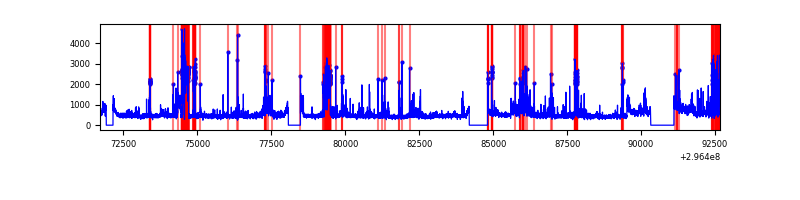 |
Top three noisy pixels from each quadrant. If the there are fewer than three noisy pixels in the level2.evt file, extra rows are filled as -1
| Pixel properties | Quadrant properties | ||||||
|---|---|---|---|---|---|---|---|
| Quadrant | DetID | PixID | Counts | Sigma | Mean | Median | Sigma |
| A | 6 | 16 | 61541 | 129.33 | 2273 | 2219 | 458.7 |
| A | 0 | 226 | 19882 | 38.51 | 2273 | 2219 | 458.7 |
| A | 3 | 137 | 19236 | 37.1 | 2273 | 2219 | 458.7 |
| B | 12 | 111 | 54318 | 119.06 | 2265 | 2203 | 437.7 |
| B | 11 | 111 | 48374 | 105.48 | 2265 | 2203 | 437.7 |
| B | 14 | 111 | 42169 | 91.3 | 2265 | 2203 | 437.7 |
| C | 3 | 233 | 9308899 | 19269.78 | 2059 | 2067 | 483.0 |
| C | 14 | 238 | 315528 | 649.02 | 2059 | 2067 | 483.0 |
| C | 7 | 220 | 86335 | 174.48 | 2059 | 2067 | 483.0 |
| D | 7 | 238 | 1984991 | 3737.13 | 2186 | 2119 | 530.6 |
| D | 1 | 52 | 1115767 | 2098.9 | 2186 | 2119 | 530.6 |
| D | 12 | 233 | 77678 | 142.41 | 2186 | 2119 | 530.6 |
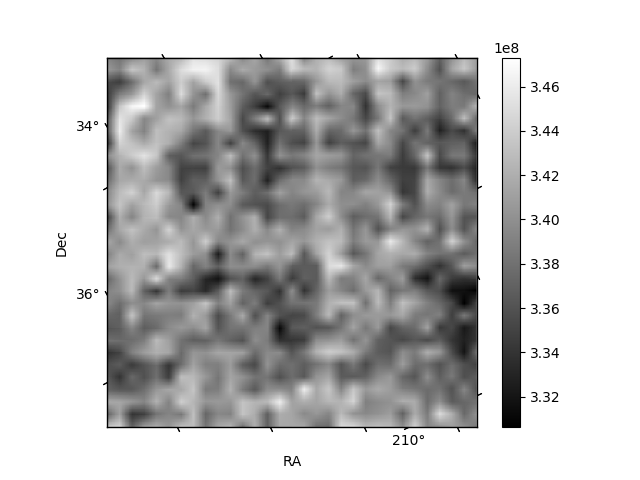
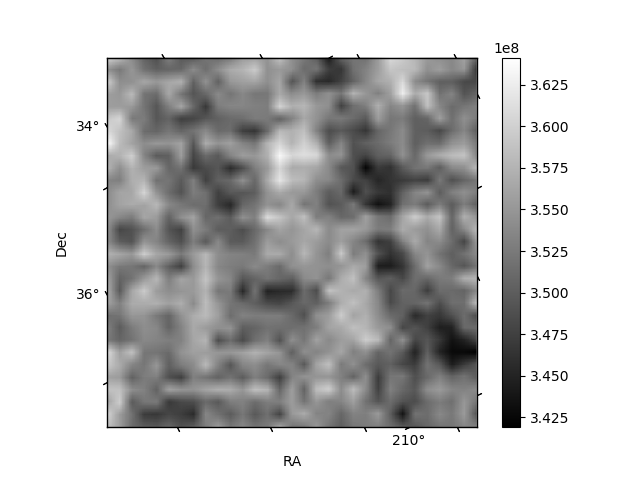
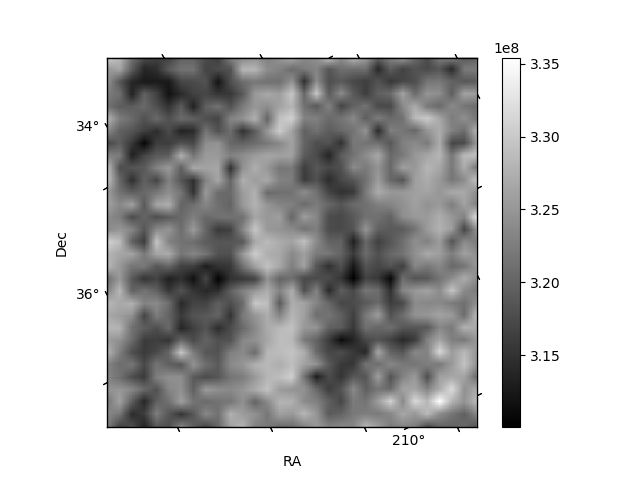
Histogram calculated using DETX and DETY for each event in the final _common_clean file
| Quadrant A |  |
 |
Quadrant B |
|---|---|---|---|
| Quadrant D |  |
 |
Quadrant C |
| Plot type | Count rate plots | Images |
|---|---|---|
| Comparison with Poisson distribution Blue bars denote a histogram of data divided into 1 sec bins. Red curve is a Poisson curve with rate = median count rate of data. |
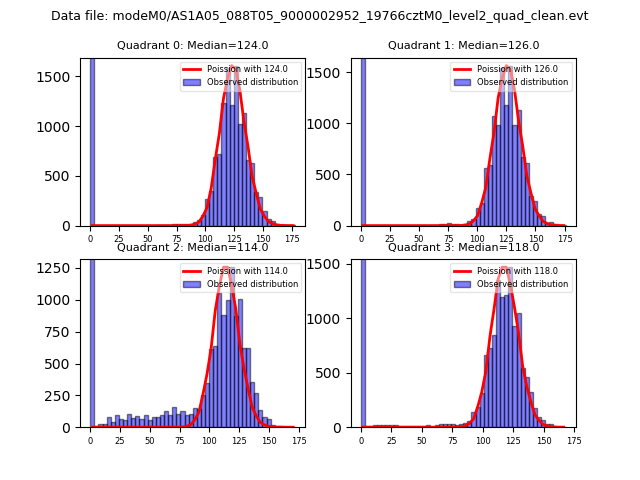 |
 |
| Quadrant-wise count rates Data is divided into 100 sec bins |
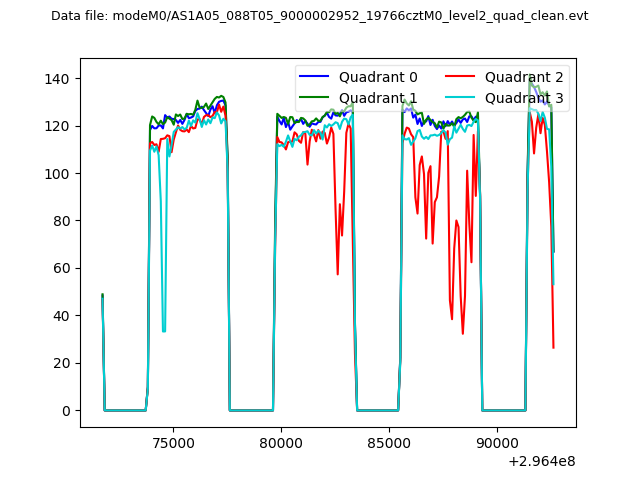 |
|
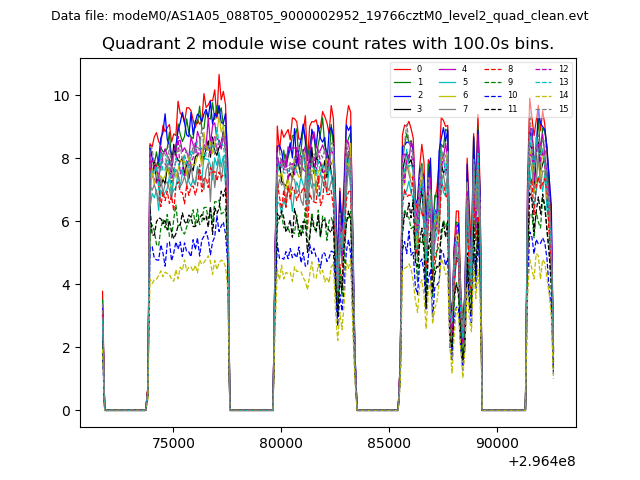
| Module-wise count rates for Quadrant A Data is divided into 100 sec bins |
 |
 |
| Module-wise count rates for Quadrant B Data is divided into 100 sec bins |
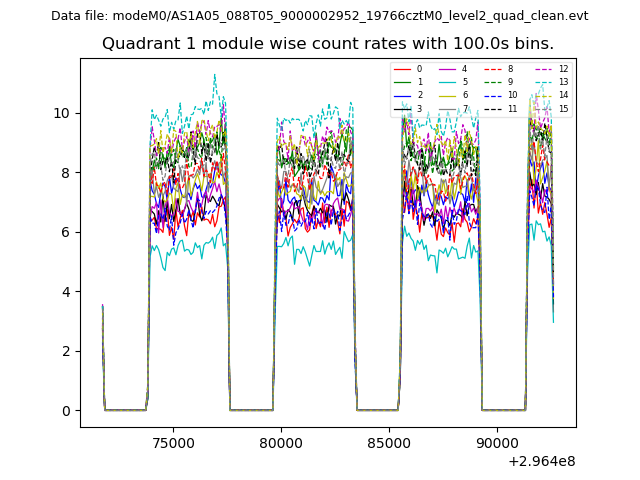 |
 |
| Module-wise count rates for Quadrant C Data is divided into 100 sec bins |
 |
 |
| Module-wise count rates for Quadrant D Data is divided into 100 sec bins |
 |
 |
| Parameter | Plot |
|---|---|
| CZT HV Monitor | 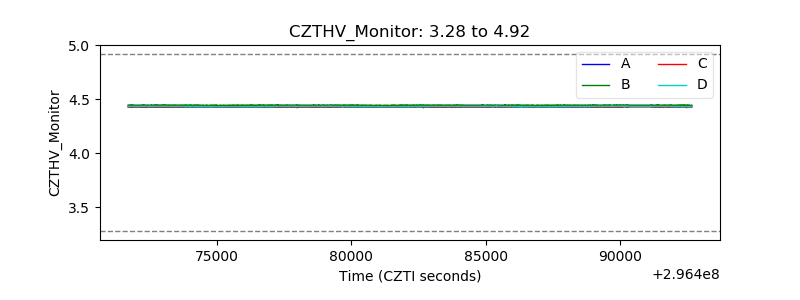 |
| D_VDD |  |
| Temperature 1 |  |
| Veto HV Monitor |  |
| Veto LLD |  |
| Alpha Counter | 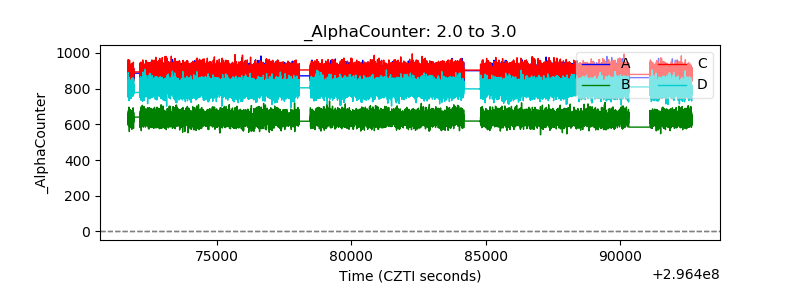 |
| _CPM_Rate | 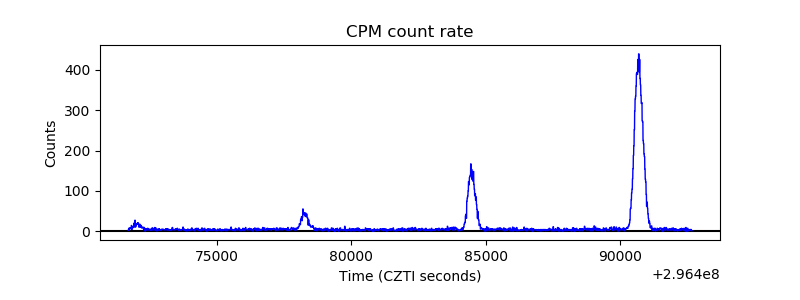 |
| CZT Counter |  |
| +2.5 Volts monitor |  |
| +5 Volts monitor |  |
| _ROLL_ROT |  |
| _Roll_DEC |  |
| _Roll_RA |  |
| Veto Counter |  |