| Param | Original file | Final file |
|---|---|---|
| Filename | modeM0/AS1A05_088T05_9000002952_19769cztM0_level2.evt | modeM0/AS1A05_088T05_9000002952_19769cztM0_level2_quad_clean.evt |
| Size (bytes) | 813,654,720 | 92,900,160 |
| Size | 776.0 MB | 88.6 MB |
| Events in quadrant A | 3,087,135 | 656,619 |
| Events in quadrant B | 3,126,174 | 668,086 |
| Events in quadrant C | 8,546,819 | 539,386 |
| Events in quadrant D | 9,453,360 | 504,955 |
| Mode M0 | |||
|---|---|---|---|
| Quadrant | BADHDUFLAG | Total packets | Discarded packets |
| A | 0 | 13526 | 2 |
| B | 0 | 13502 | 2 |
| C | 0 | 29765 | 2 |
| D | 0 | 32545 | 2 |
| Mode SS | |||
|---|---|---|---|
| Quadrant | BADHDUFLAG | Total packets | Discarded packets |
| A | 0 | 128 | 0 |
| B | 0 | 128 | 0 |
| C | 0 | 128 | 0 |
| D | 0 | 128 | 0 |
| Mode M9 | |||
|---|---|---|---|
| Quadrant | BADHDUFLAG | Total packets | Discarded packets |
| A | 0 | 11 | 0 |
| B | 0 | 12 | 0 |
| C | 0 | 12 | 0 |
| D | 0 | 12 | 0 |
| Quadrant | Total seconds | Saturated seconds | Saturation percentage |
|---|---|---|---|
| A | 6349 | 58 | 0.913530% |
| B | 6349 | 56 | 0.882029% |
| C | 6349 | 2010 | 31.658529% |
| D | 6349 | 2144 | 33.769097% |
Noise dominated data is calculated using 1-second bins in cleaned event files. If a bin has >2000 counts, and if more than 50% of those come from <1% of pixels, then it is considered to be noise-dominated and hence unusable.
| Quadrant | # 1 sec bins | Bins with >0 counts | Bins with >2000 counts | High rate bins dominated by noise | Noise dominated (total time) | Noise dominated (detector-on time) | Marked lightcurve |
|---|---|---|---|---|---|---|---|
| A | 7454 | 6349 | 3 | 3 | 0.04% | 0.05% | 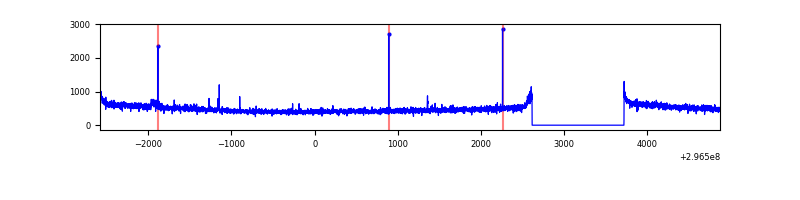 |
| B | 7454 | 6349 | 0 | 0 | 0.00% | 0.00% | 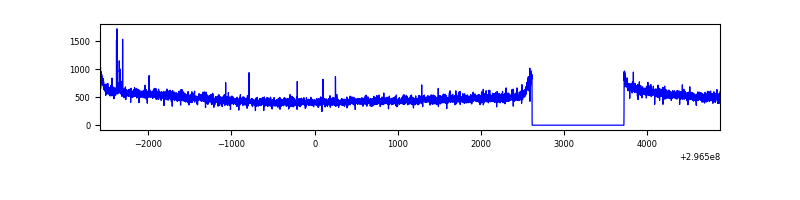 |
| C | 7454 | 6349 | 1527 | 1527 | 20.49% | 24.05% | 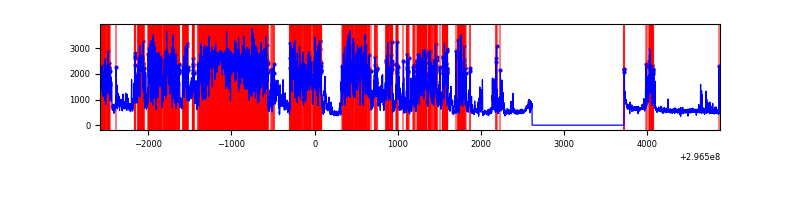 |
| D | 7454 | 6349 | 1886 | 1886 | 25.30% | 29.71% | 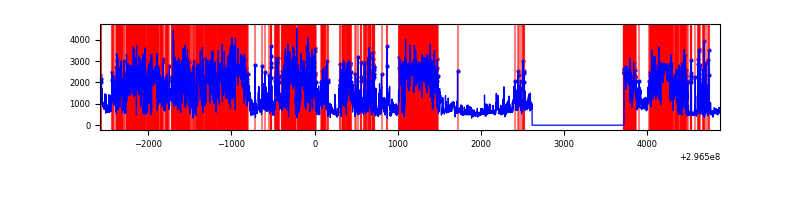 |
Top three noisy pixels from each quadrant. If the there are fewer than three noisy pixels in the level2.evt file, extra rows are filled as -1
| Pixel properties | Quadrant properties | ||||||
|---|---|---|---|---|---|---|---|
| Quadrant | DetID | PixID | Counts | Sigma | Mean | Median | Sigma |
| A | 0 | 23 | 29518 | 180.89 | 793 | 777 | 158.9 |
| A | 0 | 226 | 8417 | 48.09 | 793 | 777 | 158.9 |
| A | 3 | 137 | 6283 | 34.65 | 793 | 777 | 158.9 |
| B | 12 | 111 | 17758 | 113.12 | 792 | 770 | 150.2 |
| B | 11 | 111 | 15811 | 100.15 | 792 | 770 | 150.2 |
| B | 3 | 64 | 15191 | 96.02 | 792 | 770 | 150.2 |
| C | 3 | 233 | 5716558 | 35462.75 | 696 | 701 | 161.2 |
| C | 14 | 238 | 105983 | 653.2 | 696 | 701 | 161.2 |
| C | 10 | 223 | 5920 | 32.38 | 696 | 701 | 161.2 |
| D | 7 | 238 | 6748389 | 40716.98 | 676 | 655 | 165.7 |
| D | 1 | 52 | 74733 | 447.0 | 676 | 655 | 165.7 |
| D | 12 | 233 | 67072 | 400.77 | 676 | 655 | 165.7 |
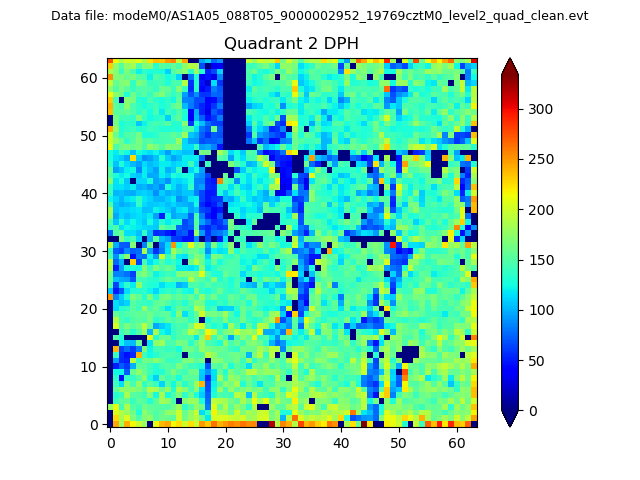
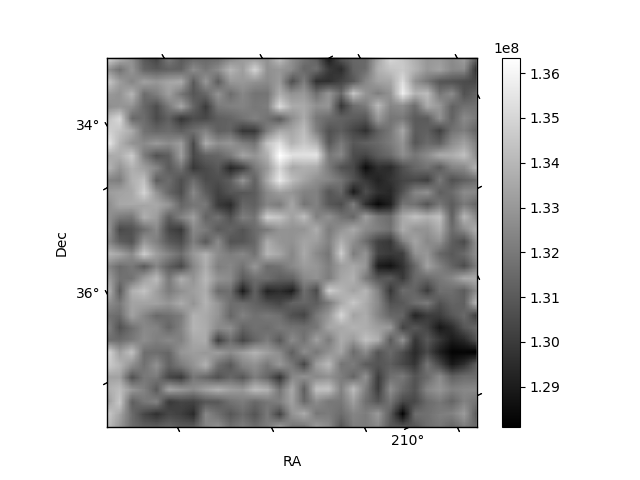
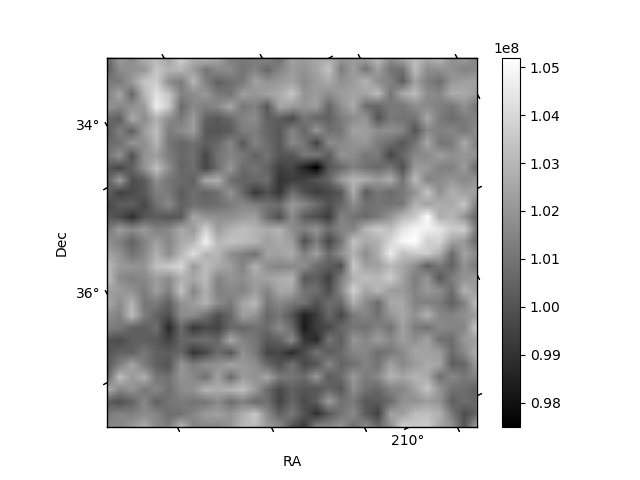
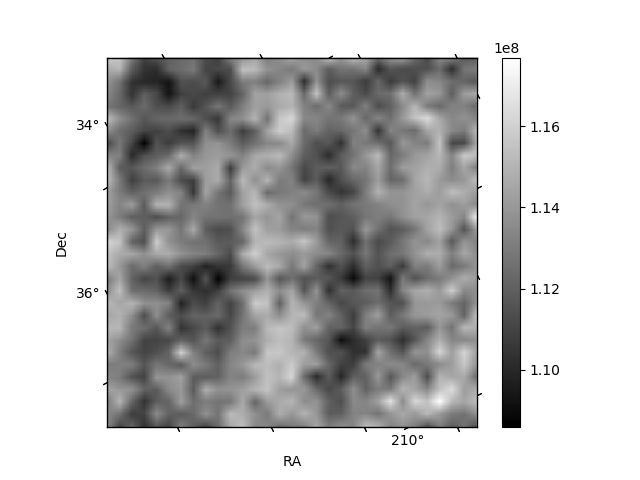
Histogram calculated using DETX and DETY for each event in the final _common_clean file
| Quadrant A | 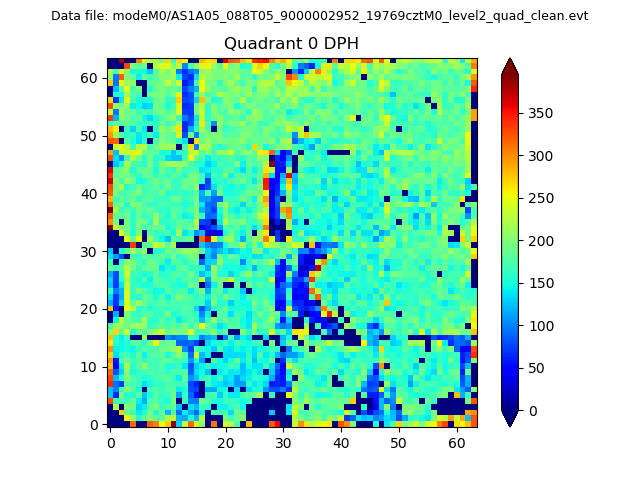 |
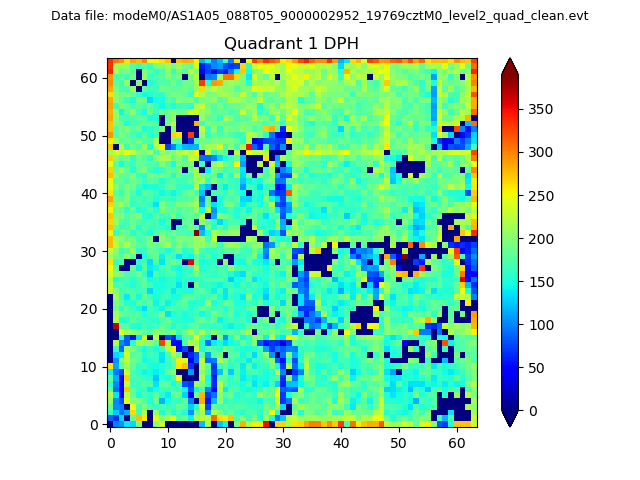 |
Quadrant B |
|---|---|---|---|
| Quadrant D | 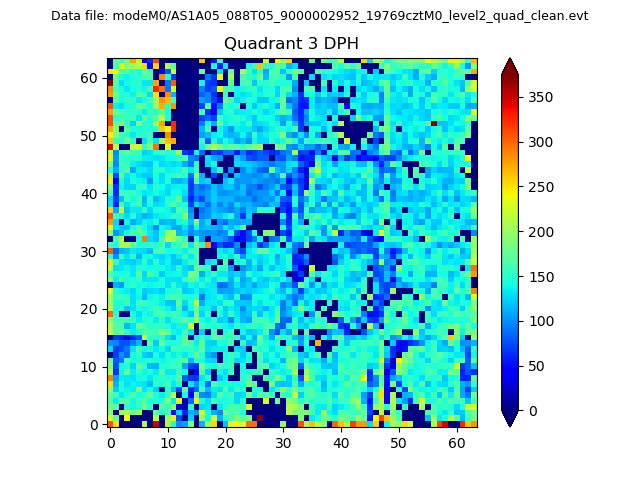 |
 |
Quadrant C |
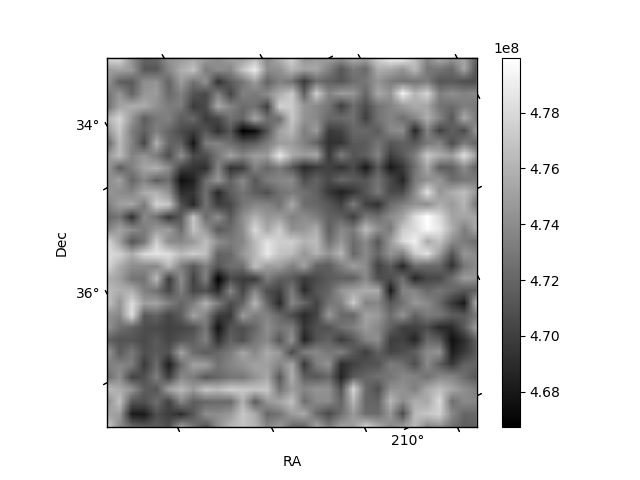
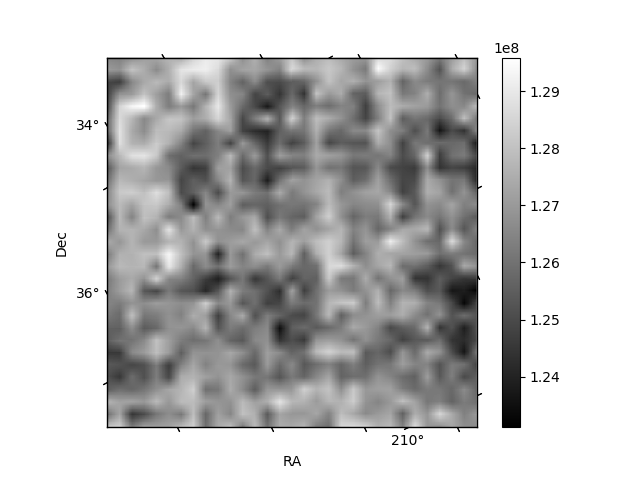
| Plot type | Count rate plots | Images |
|---|---|---|
| Comparison with Poisson distribution Blue bars denote a histogram of data divided into 1 sec bins. Red curve is a Poisson curve with rate = median count rate of data. |
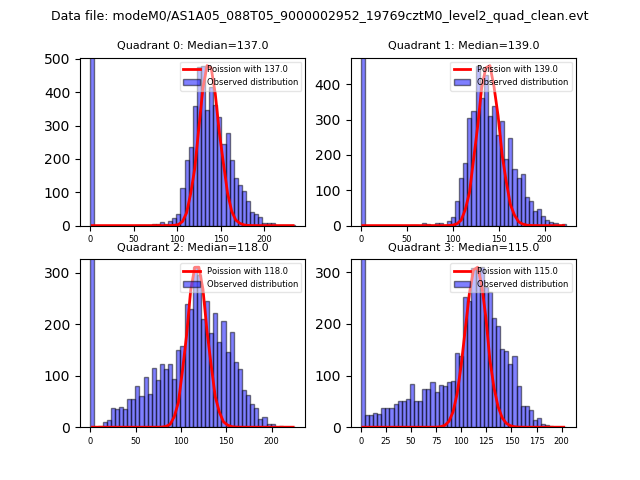 |
 |
| Quadrant-wise count rates Data is divided into 100 sec bins |
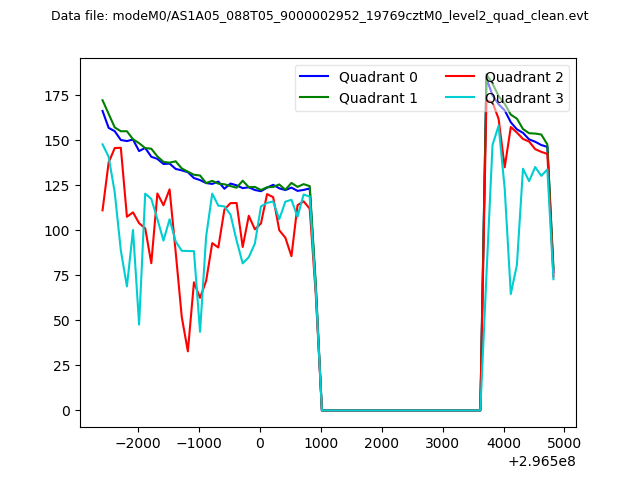 |
|
| Module-wise count rates for Quadrant A Data is divided into 100 sec bins |
 |
 |
| Module-wise count rates for Quadrant B Data is divided into 100 sec bins |
 |
 |
| Module-wise count rates for Quadrant C Data is divided into 100 sec bins |
 |
 |
| Module-wise count rates for Quadrant D Data is divided into 100 sec bins |
 |
 |
| Parameter | Plot |
|---|---|
| CZT HV Monitor |  |
| D_VDD | 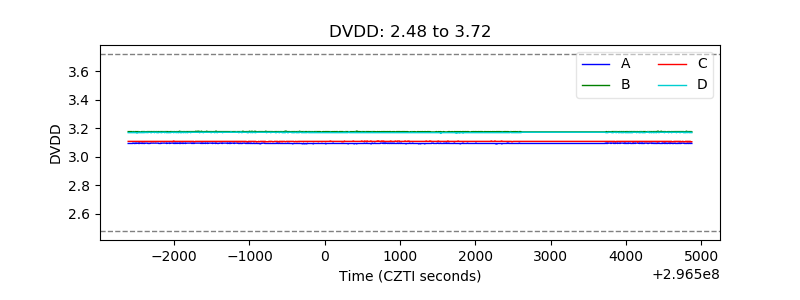 |
| Temperature 1 | 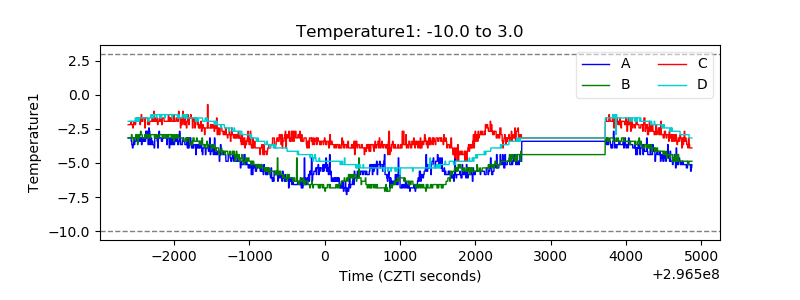 |
| Veto HV Monitor | 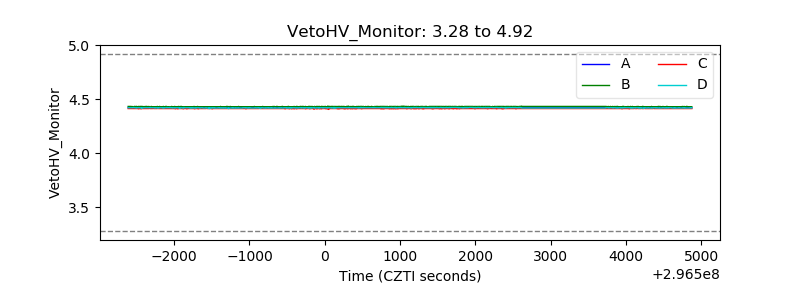 |
| Veto LLD | 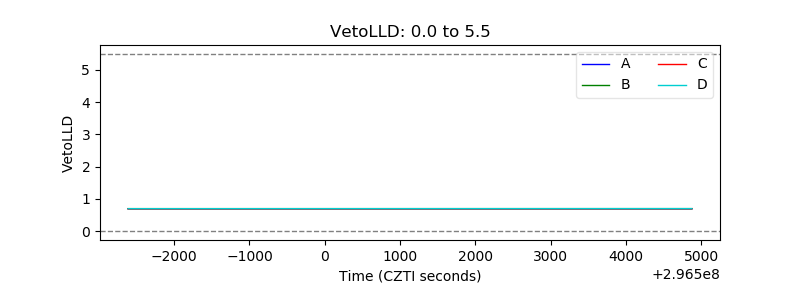 |
| Alpha Counter | 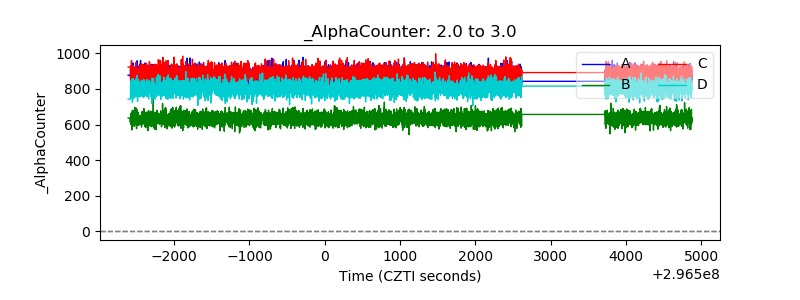 |
| _CPM_Rate | 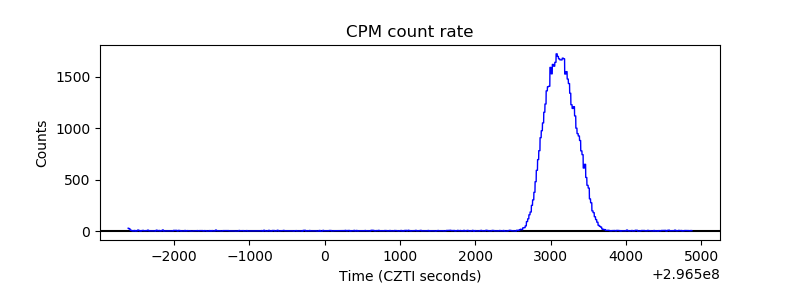 |
| CZT Counter | 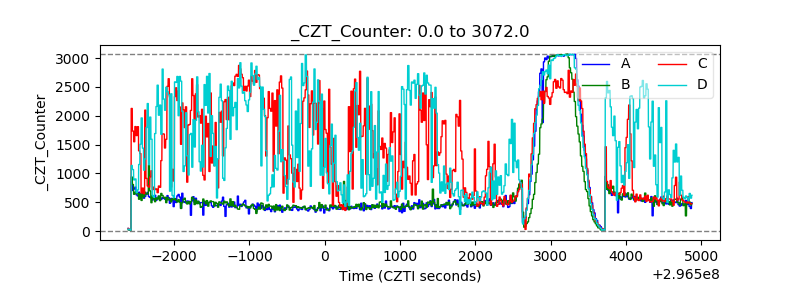 |
| +2.5 Volts monitor |  |
| +5 Volts monitor | 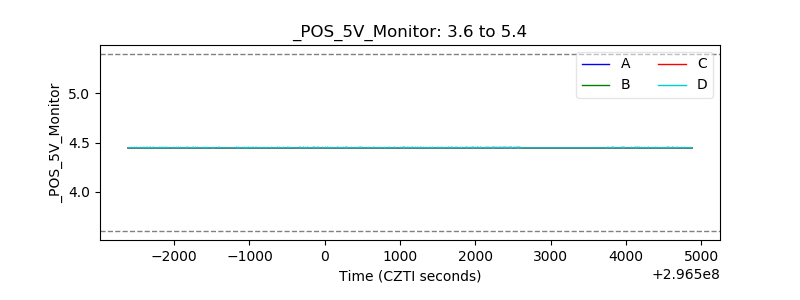 |
| _ROLL_ROT | 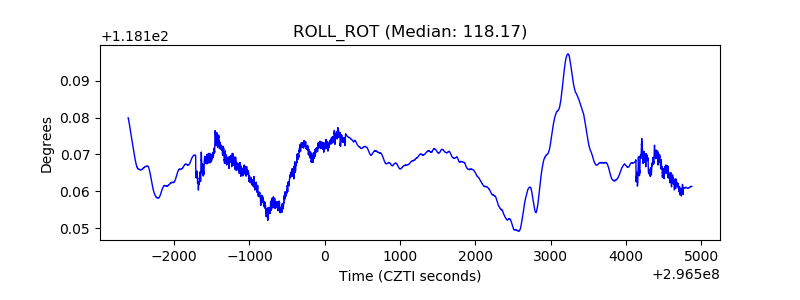 |
| _Roll_DEC | 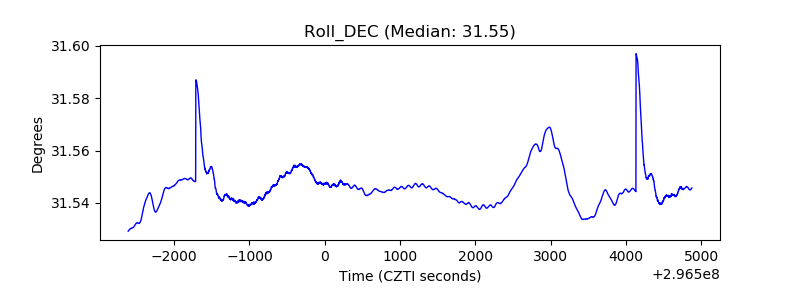 |
| _Roll_RA | 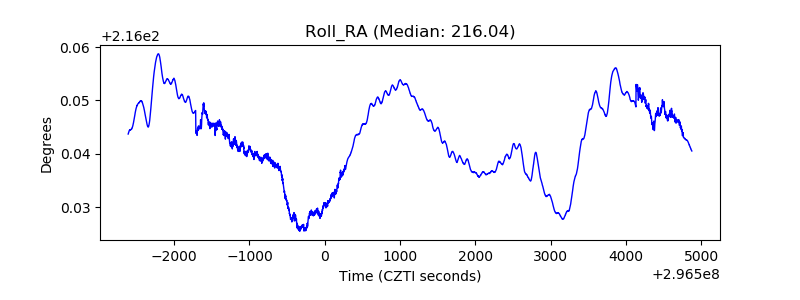 |
| Veto Counter | 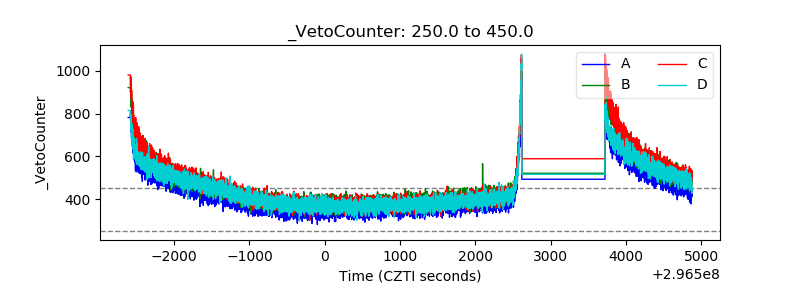 |