| Param | Original file | Final file |
|---|---|---|
| Filename | modeM0/AS1A05_088T05_9000002952_19770cztM0_level2.evt | modeM0/AS1A05_088T05_9000002952_19770cztM0_level2_quad_clean.evt |
| Size (bytes) | 89,818,560 | 18,204,480 |
| Size | 85.7 MB | 17.4 MB |
| Events in quadrant A | 442,554 | 128,906 |
| Events in quadrant B | 447,117 | 132,184 |
| Events in quadrant C | 561,567 | 123,996 |
| Events in quadrant D | 1,208,711 | 99,390 |
| Mode M0 | |||
|---|---|---|---|
| Quadrant | BADHDUFLAG | Total packets | Discarded packets |
| A | 0 | 1775 | 0 |
| B | 0 | 1778 | 0 |
| C | 0 | 2163 | 0 |
| D | 0 | 4170 | 0 |
| Mode SS | |||
|---|---|---|---|
| Quadrant | BADHDUFLAG | Total packets | Discarded packets |
| A | 0 | 16 | 0 |
| B | 0 | 16 | 0 |
| C | 0 | 16 | 0 |
| D | 0 | 16 | 0 |
| Quadrant | Total seconds | Saturated seconds | Saturation percentage |
|---|---|---|---|
| A | 845 | 1 | 0.118343% |
| B | 846 | 1 | 0.118203% |
| C | 846 | 48 | 5.673759% |
| D | 846 | 308 | 36.406619% |
Noise dominated data is calculated using 1-second bins in cleaned event files. If a bin has >2000 counts, and if more than 50% of those come from <1% of pixels, then it is considered to be noise-dominated and hence unusable.
| Quadrant | # 1 sec bins | Bins with >0 counts | Bins with >2000 counts | High rate bins dominated by noise | Noise dominated (total time) | Noise dominated (detector-on time) | Marked lightcurve |
|---|---|---|---|---|---|---|---|
| A | 845 | 845 | 0 | 0 | 0.00% | 0.00% | 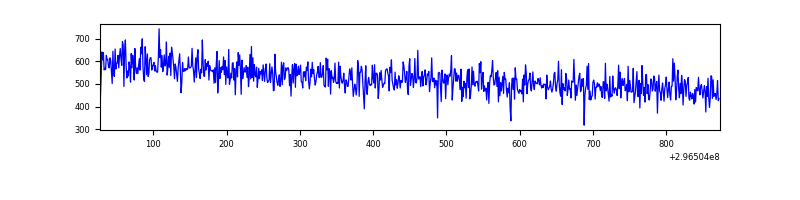 |
| B | 846 | 846 | 0 | 0 | 0.00% | 0.00% | 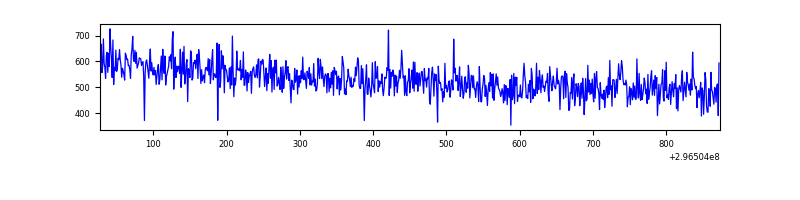 |
| C | 846 | 846 | 21 | 21 | 2.48% | 2.48% | 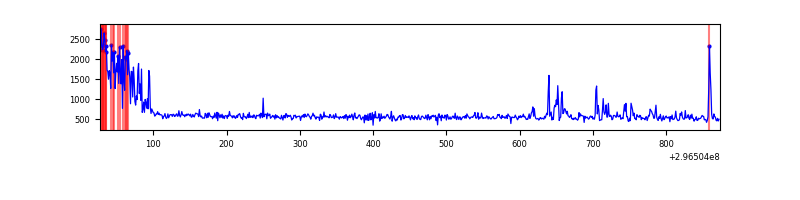 |
| D | 846 | 846 | 260 | 260 | 30.73% | 30.73% | 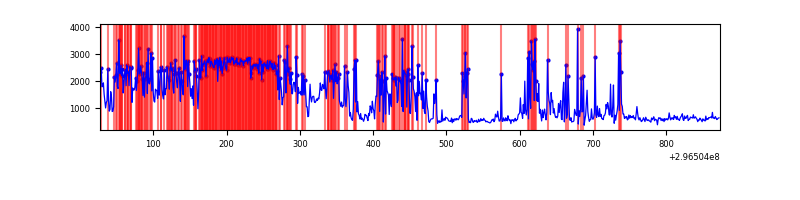 |
Top three noisy pixels from each quadrant. If the there are fewer than three noisy pixels in the level2.evt file, extra rows are filled as -1
| Pixel properties | Quadrant properties | ||||||
|---|---|---|---|---|---|---|---|
| Quadrant | DetID | PixID | Counts | Sigma | Mean | Median | Sigma |
| A | 0 | 226 | 946 | 33.26 | 114 | 112 | 25.1 |
| A | 3 | 137 | 870 | 30.23 | 114 | 112 | 25.1 |
| A | 12 | 194 | 813 | 27.96 | 114 | 112 | 25.1 |
| B | 12 | 111 | 2359 | 95.39 | 114 | 110 | 23.6 |
| B | 0 | 230 | 2286 | 92.29 | 114 | 110 | 23.6 |
| B | 11 | 111 | 2117 | 85.13 | 114 | 110 | 23.6 |
| C | 3 | 233 | 102556 | 3687.89 | 111 | 112 | 27.8 |
| C | 14 | 238 | 17598 | 629.48 | 111 | 112 | 27.8 |
| C | 10 | 223 | 5583 | 196.95 | 111 | 112 | 27.8 |
| D | 7 | 238 | 761058 | 30498.19 | 96 | 92 | 25.0 |
| D | 12 | 233 | 42927 | 1716.75 | 96 | 92 | 25.0 |
| D | 1 | 52 | 42162 | 1686.09 | 96 | 92 | 25.0 |
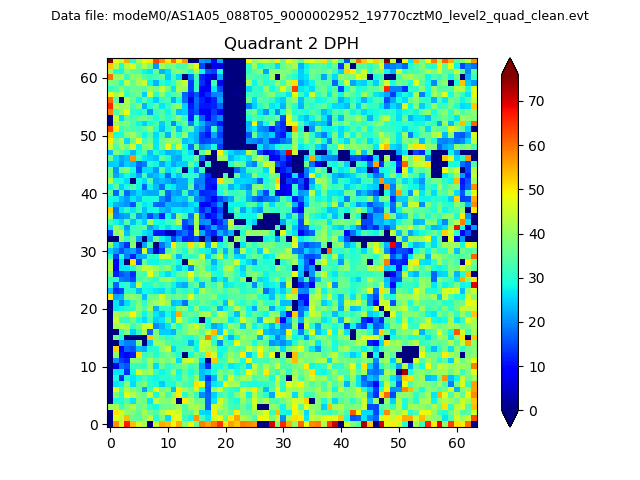
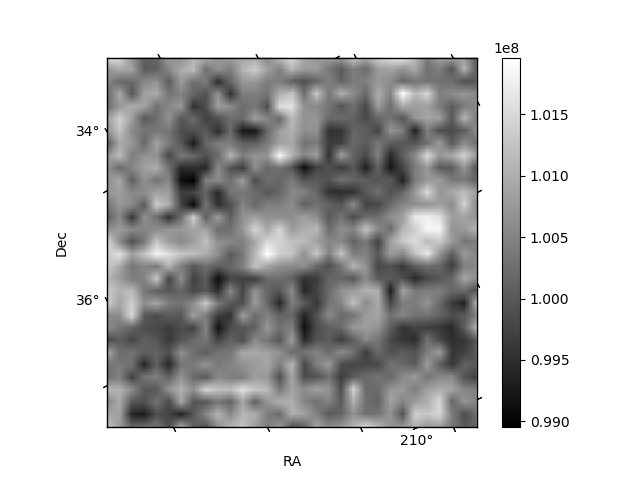
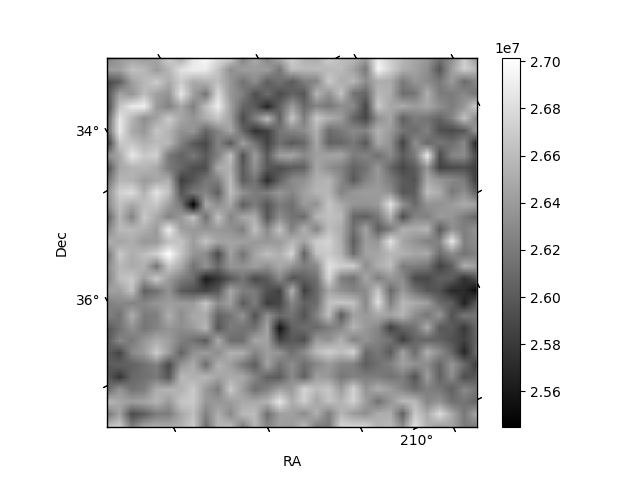
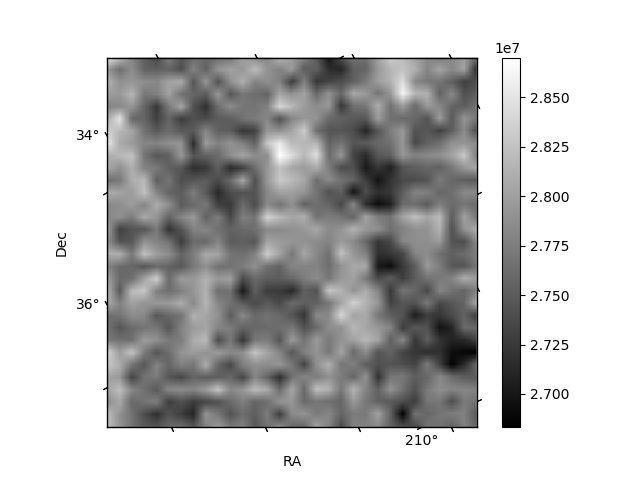
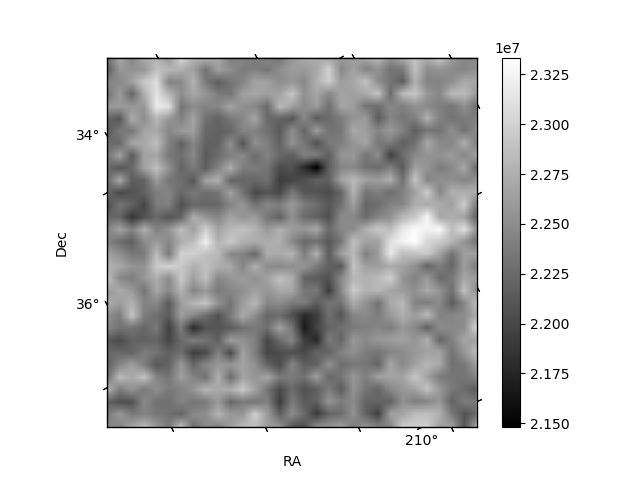
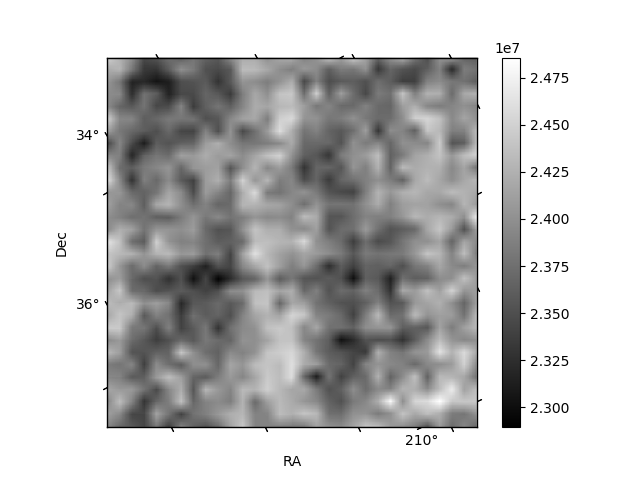
Histogram calculated using DETX and DETY for each event in the final _common_clean file
| Quadrant A | 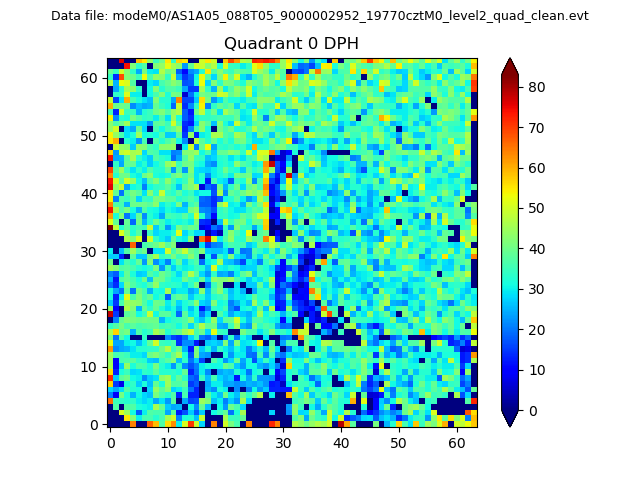 |
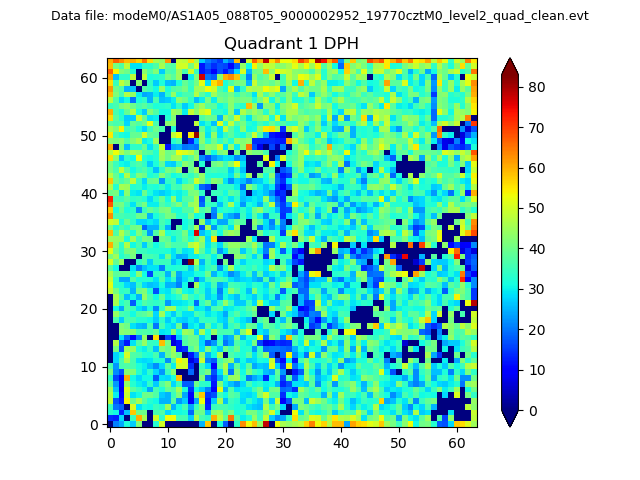 |
Quadrant B |
|---|---|---|---|
| Quadrant D | 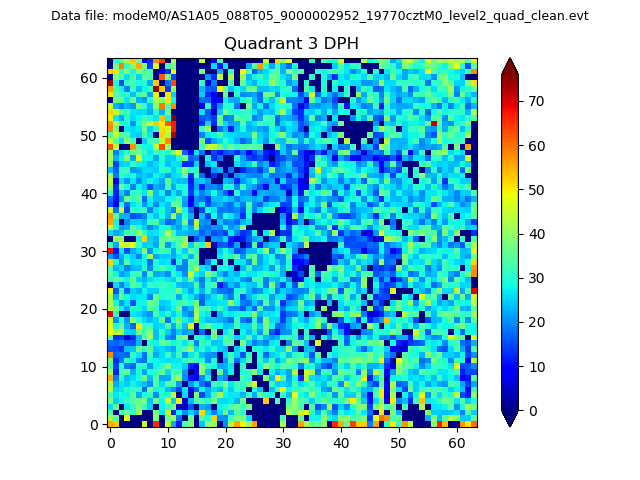 |
 |
Quadrant C |
| Plot type | Count rate plots | Images |
|---|---|---|
| Comparison with Poisson distribution Blue bars denote a histogram of data divided into 1 sec bins. Red curve is a Poisson curve with rate = median count rate of data. |
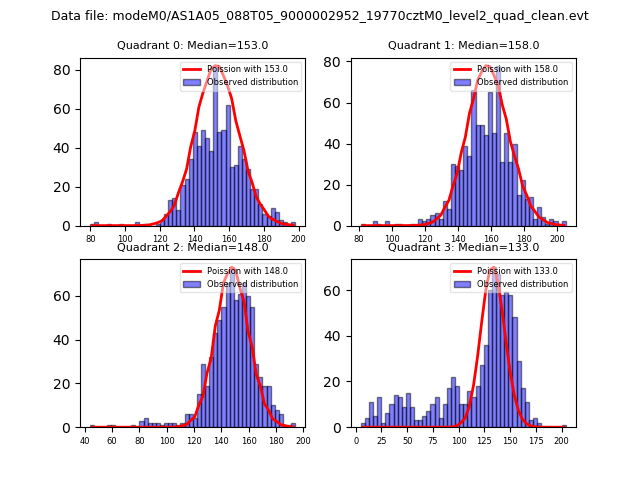 |
 |
| Quadrant-wise count rates Data is divided into 100 sec bins |
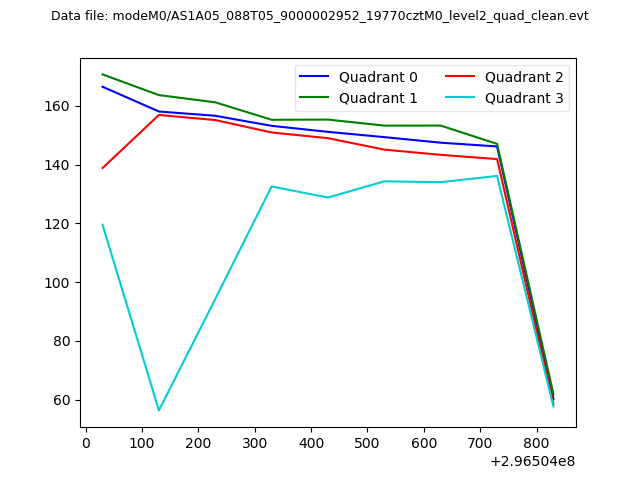 |
|
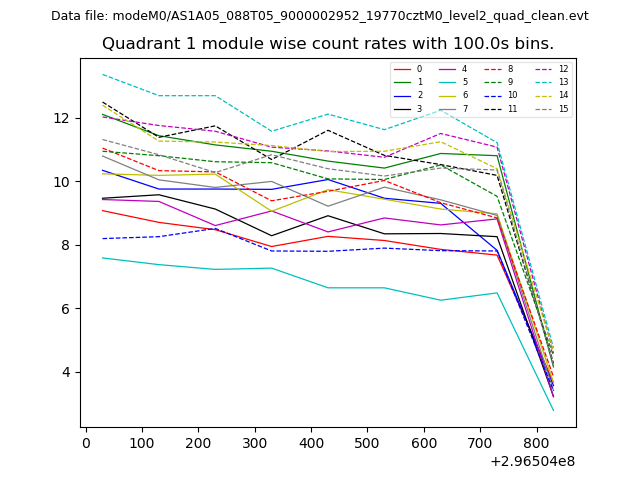
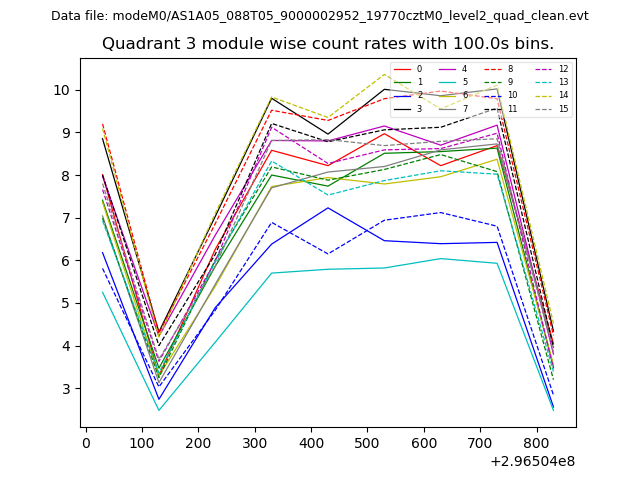
| Module-wise count rates for Quadrant A Data is divided into 100 sec bins |
 |
 |
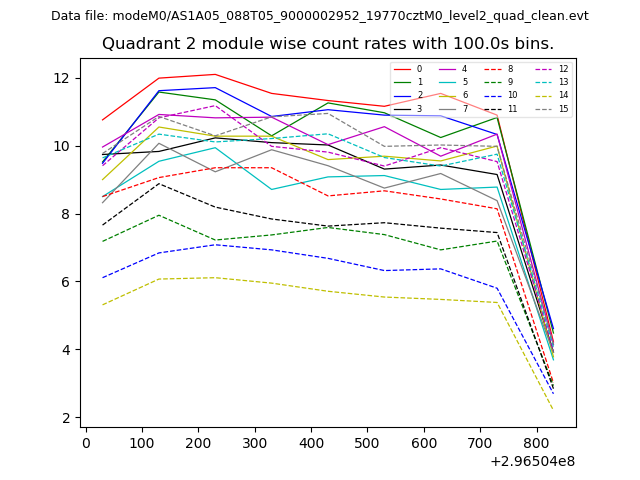
| Module-wise count rates for Quadrant B Data is divided into 100 sec bins |
 |
 |
| Module-wise count rates for Quadrant C Data is divided into 100 sec bins |
 |
 |
| Module-wise count rates for Quadrant D Data is divided into 100 sec bins |
 |
 |
| Parameter | Plot |
|---|---|
| CZT HV Monitor | 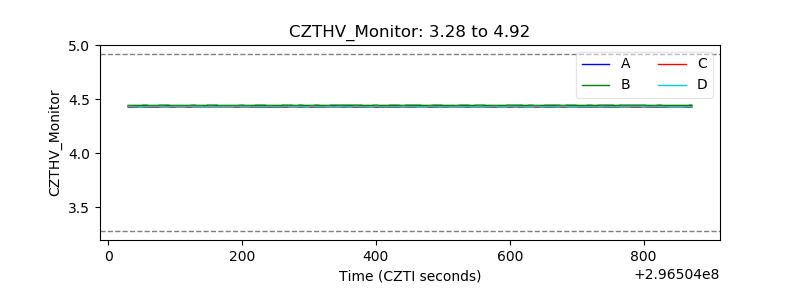 |
| D_VDD | 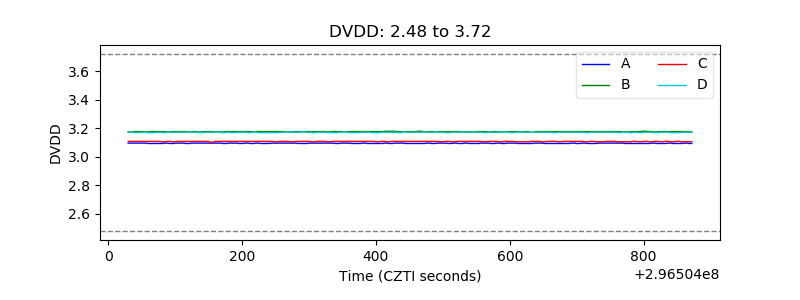 |
| Temperature 1 |  |
| Veto HV Monitor | 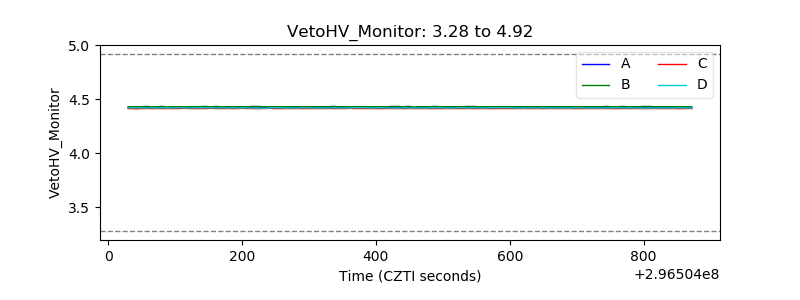 |
| Veto LLD | 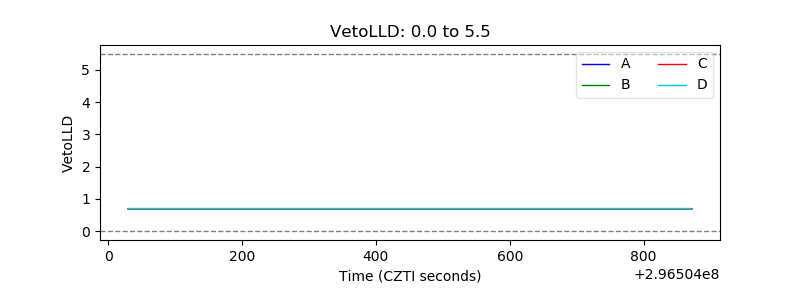 |
| Alpha Counter | 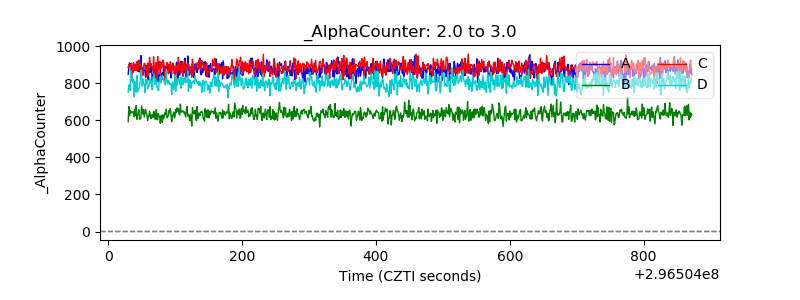 |
| _CPM_Rate | 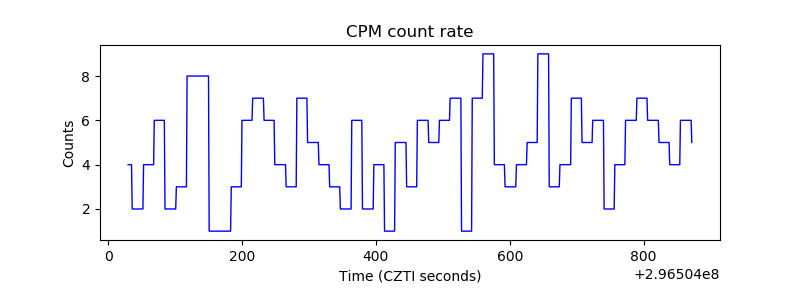 |
| CZT Counter | 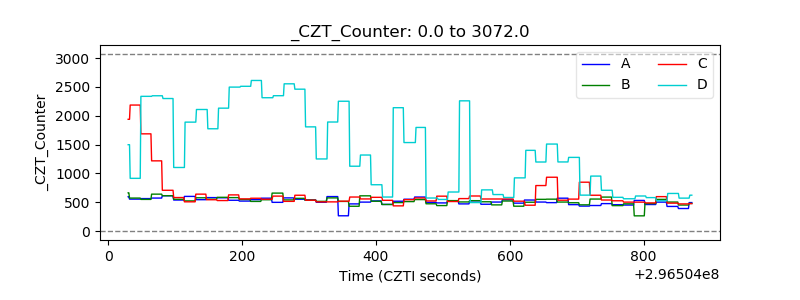 |
| +2.5 Volts monitor |  |
| +5 Volts monitor |  |
| _ROLL_ROT | 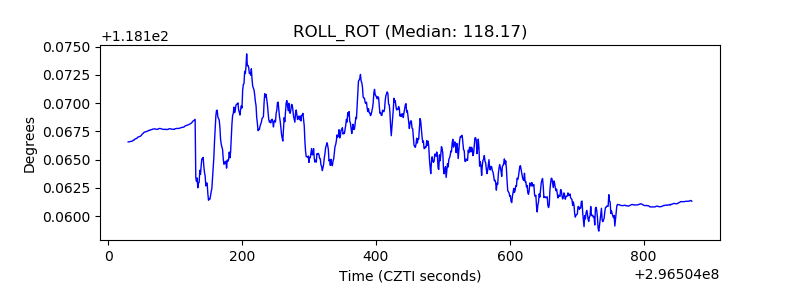 |
| _Roll_DEC | 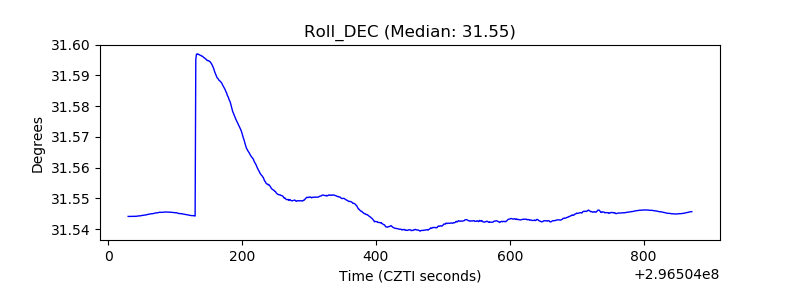 |
| _Roll_RA | 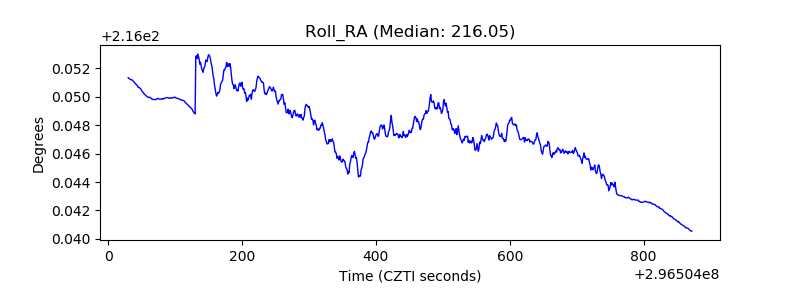 |
| Veto Counter | 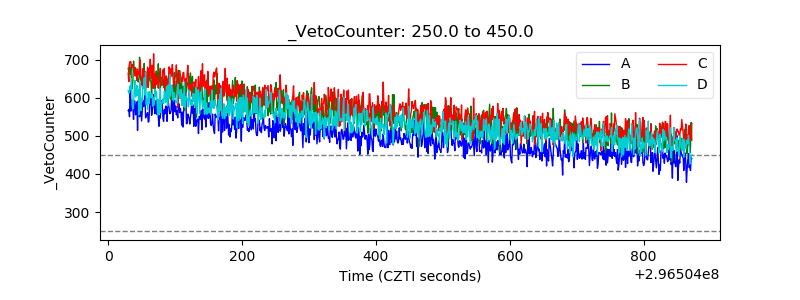 |