| Param | Original file | Final file |
|---|---|---|
| Filename | modeM0/AS1A05_104T08_9000002954cztM0_level2.fits | modeM0/AS1A05_104T08_9000002954cztM0_level2_quad_clean.evt |
| Size (bytes) | 334,512,000 | 170,023,680 |
| Size | 319.0 MB | 162.1 MB |
| Events in quadrant A | 2,116,654 | 761,282 |
| Events in quadrant B | 2,054,672 | 765,988 |
| Events in quadrant C | 1,892,516 | 676,997 |
| Events in quadrant D | 1,756,932 | 634,383 |
| Mode M0 | |||
|---|---|---|---|
| Quadrant | BADHDUFLAG | Total packets | Discarded packets |
| A | 0 | 70403 | 0 |
| B | 0 | 71183 | 0 |
| C | 0 | 115179 | 0 |
| D | 0 | 83929 | 0 |
| Mode M9 | |||
|---|---|---|---|
| Quadrant | BADHDUFLAG | Total packets | Discarded packets |
| A | 0 | 72 | 0 |
| B | 0 | 72 | 0 |
| C | 0 | 72 | 0 |
| D | 0 | 72 | 0 |
| Mode SS | |||
|---|---|---|---|
| Quadrant | BADHDUFLAG | Total packets | Discarded packets |
| A | 0 | 684 | 0 |
| B | 0 | 684 | 0 |
| C | 0 | 684 | 0 |
| D | 0 | 684 | 0 |
| Quadrant | Total seconds | Saturated seconds | Saturation percentage |
|---|---|---|---|
| A | 33578 | 277 | 0.824945% |
| B | 33578 | 373 | 1.110846% |
| C | 33578 | 5683 | 16.924772% |
| D | 33578 | 1221 | 3.636309% |
Noise dominated data is calculated using 1-second bins in cleaned event files. If a bin has >2000 counts, and if more than 50% of those come from <1% of pixels, then it is considered to be noise-dominated and hence unusable.
| Quadrant | # 1 sec bins | Bins with >0 counts | Bins with >2000 counts | High rate bins dominated by noise | Noise dominated (total time) | Noise dominated (detector-on time) | Marked lightcurve |
|---|---|---|---|---|---|---|---|
| A | 40858 | 33577 | 0 | 0 | 0.00% | 0.00% |  |
| B | 40858 | 33577 | 0 | 0 | 0.00% | 0.00% |  |
| C | 40858 | 33557 | 0 | 0 | 0.00% | 0.00% |  |
| D | 40858 | 33572 | 0 | 0 | 0.00% | 0.00% |  |
Top three noisy pixels from each quadrant. If the there are fewer than three noisy pixels in the level2.evt file, extra rows are filled as -1
| Pixel properties | Quadrant properties | ||||||
|---|---|---|---|---|---|---|---|
| Quadrant | DetID | PixID | Counts | Sigma | Mean | Median | Sigma |
| A | 0 | 29 | 1983 | 10.85 | 550 | 519 | 134.9 |
| A | 7 | 110 | 1835 | 9.76 | 550 | 519 | 134.9 |
| A | 9 | 19 | 1587 | 7.92 | 550 | 519 | 134.9 |
| B | 2 | 9 | 1646 | 10.38 | 543 | 521 | 108.4 |
| B | 5 | 128 | 1421 | 8.3 | 543 | 521 | 108.4 |
| B | 2 | 8 | 1390 | 8.02 | 543 | 521 | 108.4 |
| C | 1 | 80 | 1416 | 7.28 | 498 | 466 | 130.4 |
| C | 3 | 202 | 1413 | 7.26 | 498 | 466 | 130.4 |
| C | 1 | 81 | 1369 | 6.92 | 498 | 466 | 130.4 |
| D | 3 | 14 | 1316 | 6.41 | 501 | 457 | 134.0 |
| D | 10 | 189 | 1312 | 6.38 | 501 | 457 | 134.0 |
| D | 15 | 46 | 1294 | 6.24 | 501 | 457 | 134.0 |
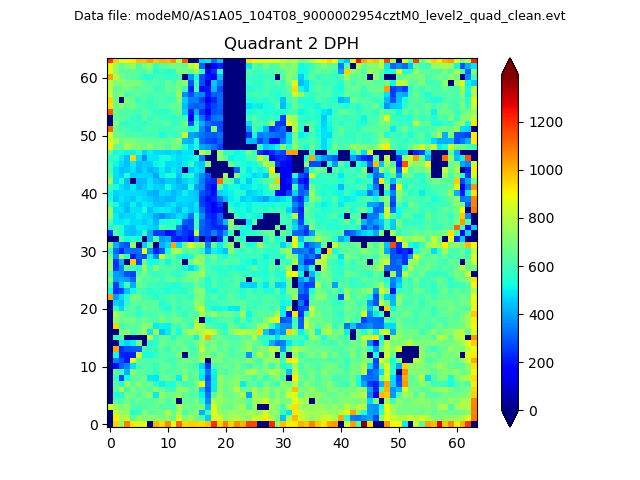
Histogram calculated using DETX and DETY for each event in the final _common_clean file
| Quadrant A |  |
 |
Quadrant B |
|---|---|---|---|
| Quadrant D | 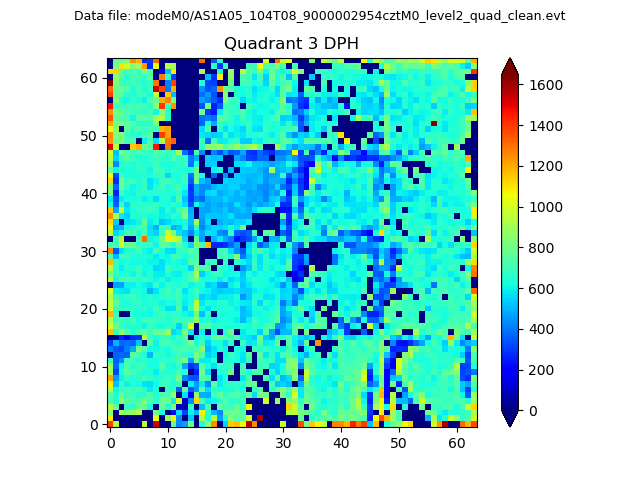 |
 |
Quadrant C |
| Plot type | Count rate plots | Images |
|---|---|---|
| Comparison with Poisson distribution Blue bars denote a histogram of data divided into 1 sec bins. Red curve is a Poisson curve with rate = median count rate of data. |
 |
 |
| Quadrant-wise count rates Data is divided into 100 sec bins |
 |
|
| Module-wise count rates for Quadrant A Data is divided into 100 sec bins |
 |
 |
| Module-wise count rates for Quadrant B Data is divided into 100 sec bins |
 |
 |
| Module-wise count rates for Quadrant C Data is divided into 100 sec bins |
 |
 |
| Module-wise count rates for Quadrant D Data is divided into 100 sec bins |
 |
 |
| Parameter | Plot |
|---|---|
| CZT HV Monitor |  |
| D_VDD |  |
| Temperature 1 |  |
| Veto HV Monitor |  |
| Veto LLD |  |
| Alpha Counter |  |
| _CPM_Rate |  |
| CZT Counter |  |
| +2.5 Volts monitor |  |
| +5 Volts monitor |  |
| _ROLL_ROT |  |
| _Roll_DEC |  |
| _Roll_RA |  |
| Veto Counter |  |