| Param | Original file | Final file |
|---|---|---|
| Filename | modeM0/AS1A05_104T08_9000002954_19772cztM0_level2.evt | modeM0/AS1A05_104T08_9000002954_19772cztM0_level2_quad_clean.evt |
| Size (bytes) | 560,139,840 | 92,191,680 |
| Size | 534.2 MB | 87.9 MB |
| Events in quadrant A | 3,171,440 | 618,272 |
| Events in quadrant B | 3,305,000 | 638,111 |
| Events in quadrant C | 5,934,401 | 531,949 |
| Events in quadrant D | 4,132,862 | 570,582 |
| Mode M0 | |||
|---|---|---|---|
| Quadrant | BADHDUFLAG | Total packets | Discarded packets |
| A | 0 | 13156 | 2 |
| B | 0 | 13467 | 2 |
| C | 0 | 21718 | 2 |
| D | 0 | 16186 | 2 |
| Mode M9 | |||
|---|---|---|---|
| Quadrant | BADHDUFLAG | Total packets | Discarded packets |
| A | 0 | 18 | 0 |
| B | 0 | 19 | 0 |
| C | 0 | 19 | 0 |
| D | 0 | 19 | 0 |
| Mode SS | |||
|---|---|---|---|
| Quadrant | BADHDUFLAG | Total packets | Discarded packets |
| A | 0 | 128 | 0 |
| B | 0 | 128 | 0 |
| C | 0 | 128 | 0 |
| D | 0 | 128 | 0 |
| Quadrant | Total seconds | Saturated seconds | Saturation percentage |
|---|---|---|---|
| A | 6191 | 57 | 0.920691% |
| B | 6191 | 89 | 1.437571% |
| C | 6191 | 942 | 15.215636% |
| D | 6191 | 328 | 5.298013% |
Noise dominated data is calculated using 1-second bins in cleaned event files. If a bin has >2000 counts, and if more than 50% of those come from <1% of pixels, then it is considered to be noise-dominated and hence unusable.
| Quadrant | # 1 sec bins | Bins with >0 counts | Bins with >2000 counts | High rate bins dominated by noise | Noise dominated (total time) | Noise dominated (detector-on time) | Marked lightcurve |
|---|---|---|---|---|---|---|---|
| A | 7551 | 6192 | 0 | 0 | 0.00% | 0.00% |  |
| B | 7551 | 6192 | 20 | 20 | 0.26% | 0.32% | 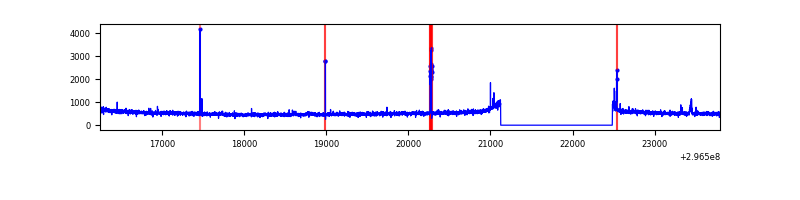 |
| C | 7551 | 6192 | 664 | 664 | 8.79% | 10.72% | 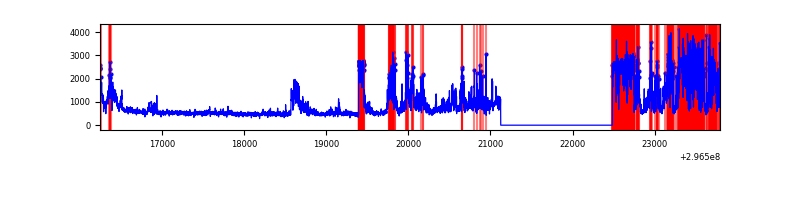 |
| D | 7551 | 6191 | 272 | 272 | 3.60% | 4.39% |  |
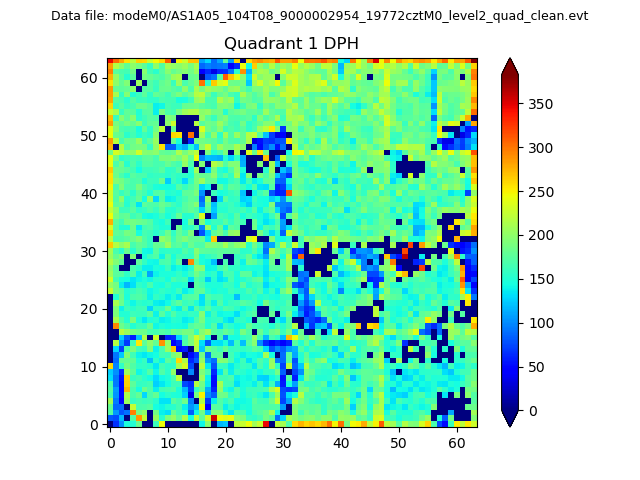
Top three noisy pixels from each quadrant. If the there are fewer than three noisy pixels in the level2.evt file, extra rows are filled as -1
| Pixel properties | Quadrant properties | ||||||
|---|---|---|---|---|---|---|---|
| Quadrant | DetID | PixID | Counts | Sigma | Mean | Median | Sigma |
| A | 6 | 16 | 29925 | 178.01 | 814 | 798 | 163.6 |
| A | 8 | 192 | 7252 | 39.44 | 814 | 798 | 163.6 |
| A | 0 | 226 | 6941 | 37.54 | 814 | 798 | 163.6 |
| B | 3 | 64 | 54763 | 348.46 | 819 | 800 | 154.9 |
| B | 12 | 111 | 18085 | 111.61 | 819 | 800 | 154.9 |
| B | 11 | 111 | 15711 | 96.28 | 819 | 800 | 154.9 |
| C | 3 | 233 | 2960106 | 17363.91 | 731 | 737 | 170.4 |
| C | 14 | 238 | 114781 | 669.14 | 731 | 737 | 170.4 |
| C | 4 | 175 | 7921 | 42.15 | 731 | 737 | 170.4 |
| D | 7 | 238 | 1108797 | 5919.36 | 765 | 745 | 187.2 |
| D | 12 | 218 | 53663 | 282.69 | 765 | 745 | 187.2 |
| D | 2 | 184 | 29893 | 155.71 | 765 | 745 | 187.2 |
Histogram calculated using DETX and DETY for each event in the final _common_clean file
| Quadrant A | 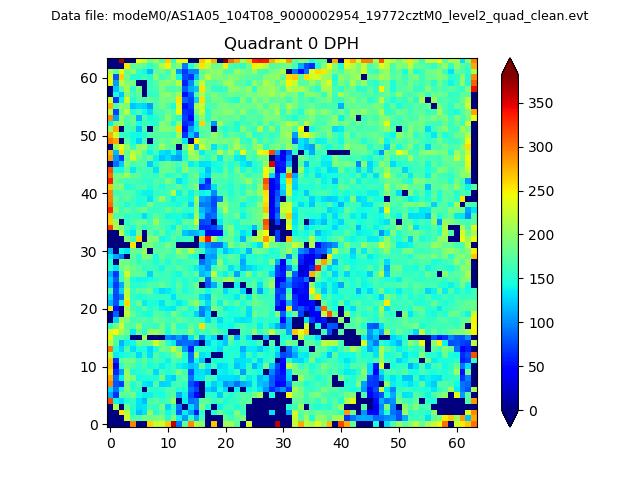 |
 |
Quadrant B |
|---|---|---|---|
| Quadrant D |  |
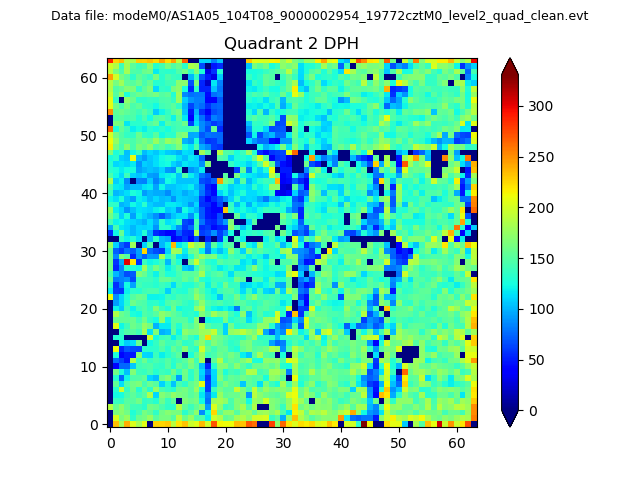 |
Quadrant C |
| Plot type | Count rate plots | Images |
|---|---|---|
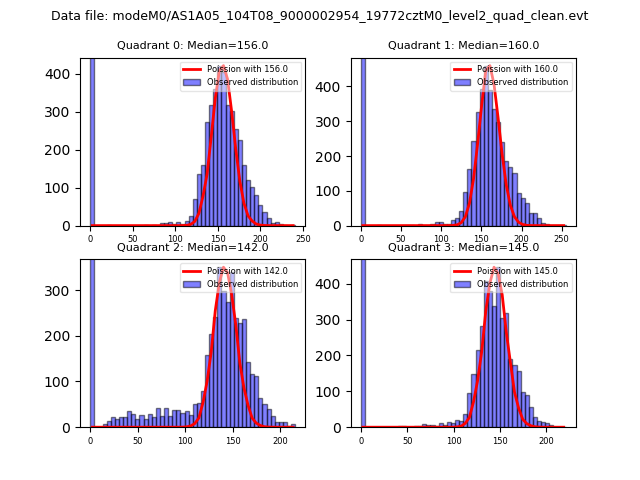
| Comparison with Poisson distribution Blue bars denote a histogram of data divided into 1 sec bins. Red curve is a Poisson curve with rate = median count rate of data. |
 |
 |
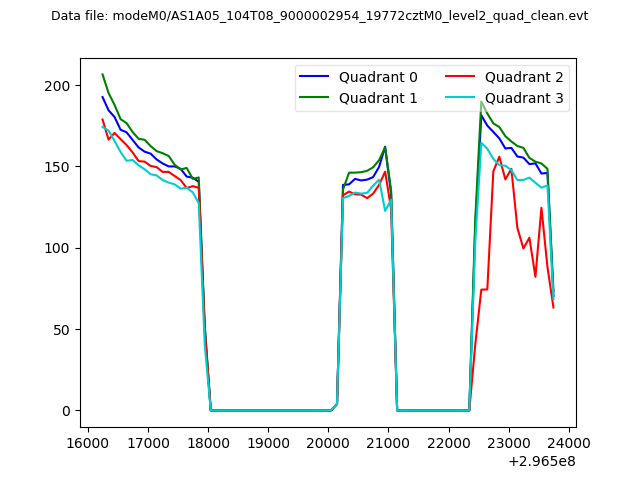
| Quadrant-wise count rates Data is divided into 100 sec bins |
 |
|
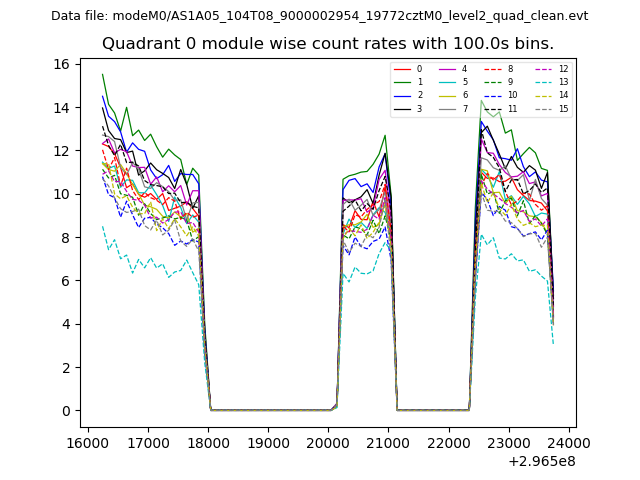
| Module-wise count rates for Quadrant A Data is divided into 100 sec bins |
 |
 |
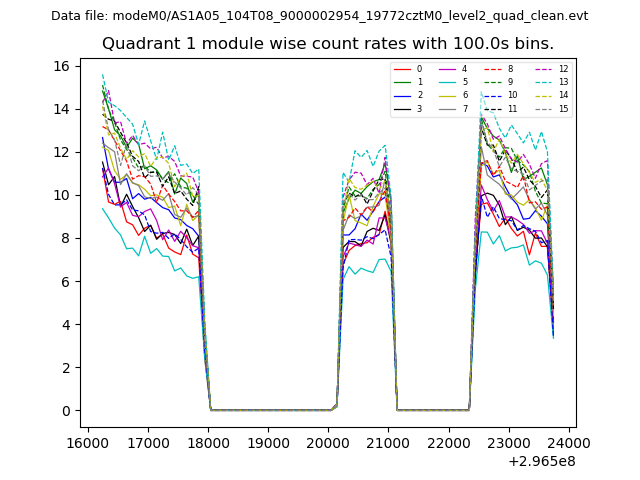
| Module-wise count rates for Quadrant B Data is divided into 100 sec bins |
 |
 |
| Module-wise count rates for Quadrant C Data is divided into 100 sec bins |
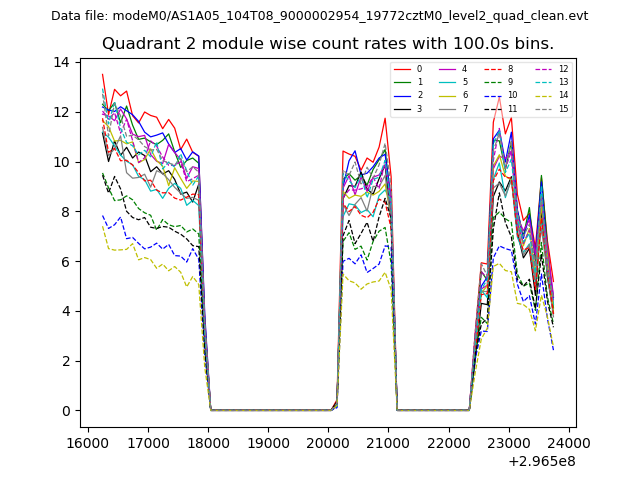 |
 |
| Module-wise count rates for Quadrant D Data is divided into 100 sec bins |
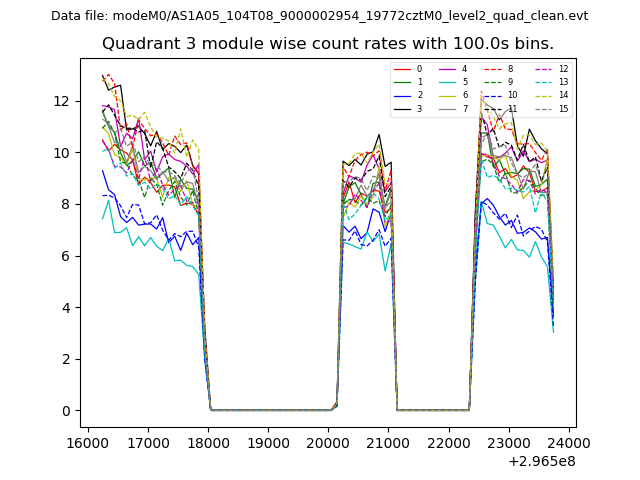 |
 |
| Parameter | Plot |
|---|---|
| CZT HV Monitor | 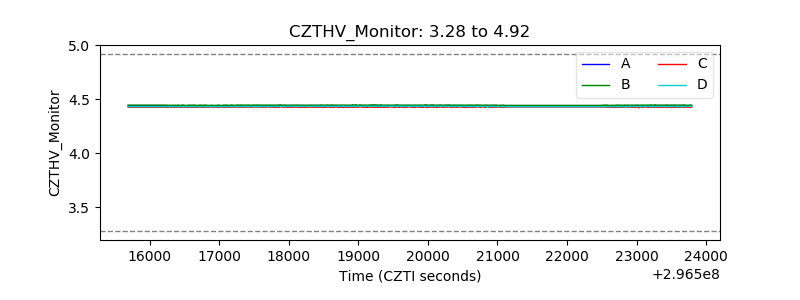 |
| D_VDD | 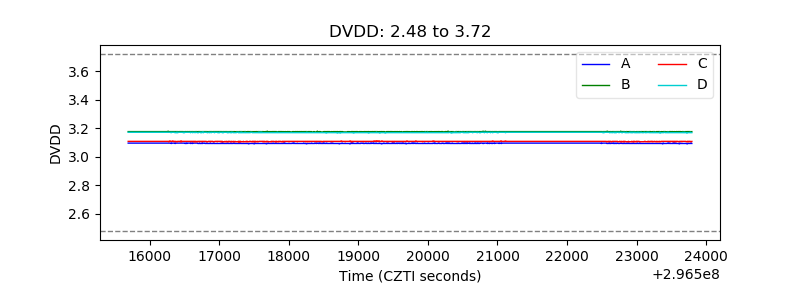 |
| Temperature 1 |  |
| Veto HV Monitor | 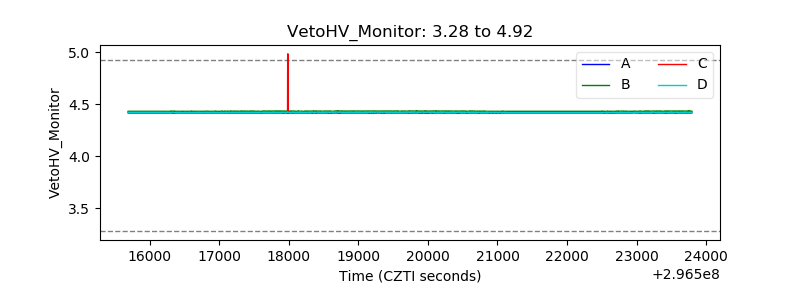 |
| Veto LLD | 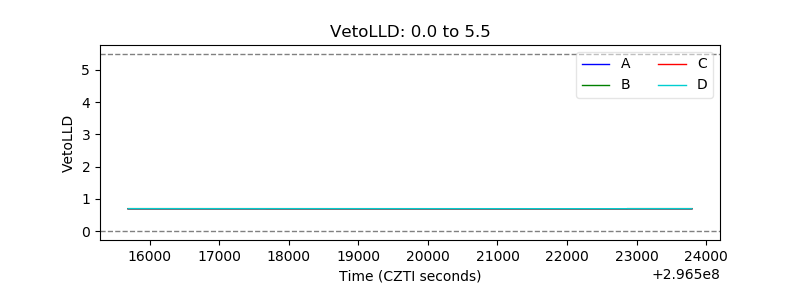 |
| Alpha Counter | 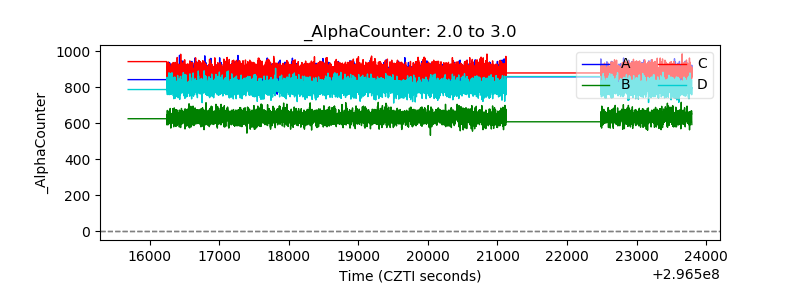 |
| _CPM_Rate | 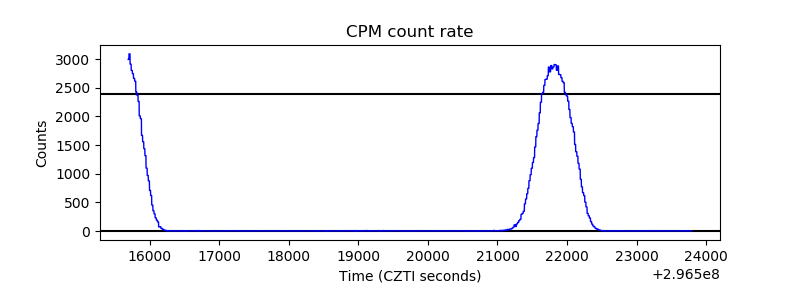 |
| CZT Counter | 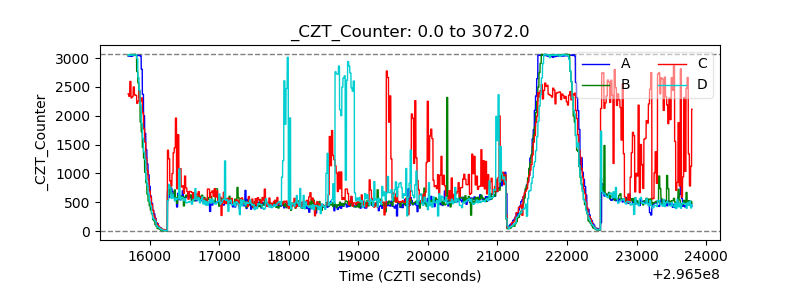 |
| +2.5 Volts monitor |  |
| +5 Volts monitor |  |
| _ROLL_ROT | 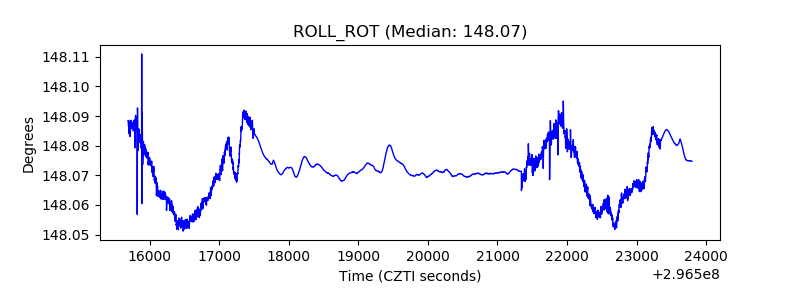 |
| _Roll_DEC | 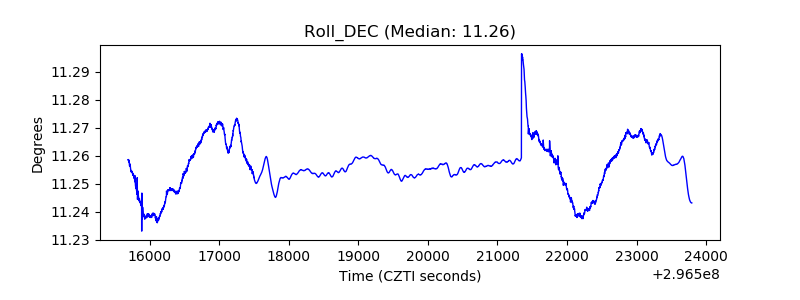 |
| _Roll_RA | 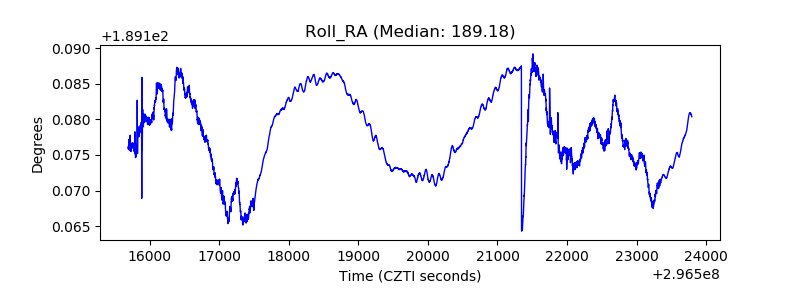 |
| Veto Counter | 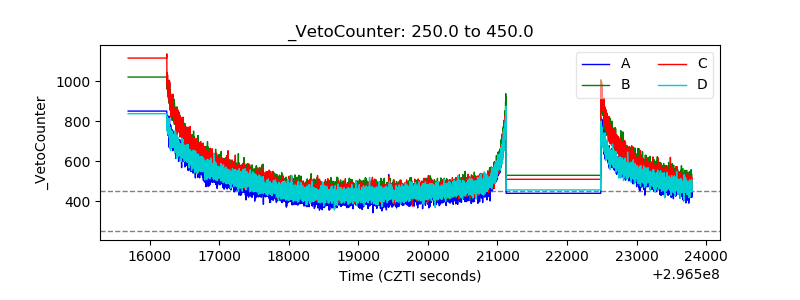 |