| Param | Original file | Final file |
|---|---|---|
| Filename | modeM0/AS1A05_104T08_9000002954_19774cztM0_level2.evt | modeM0/AS1A05_104T08_9000002954_19774cztM0_level2_quad_clean.evt |
| Size (bytes) | 584,962,560 | 74,764,800 |
| Size | 557.9 MB | 71.3 MB |
| Events in quadrant A | 3,121,206 | 479,411 |
| Events in quadrant B | 3,202,126 | 490,282 |
| Events in quadrant C | 7,364,029 | 411,747 |
| Events in quadrant D | 3,602,388 | 443,436 |
| Mode M0 | |||
|---|---|---|---|
| Quadrant | BADHDUFLAG | Total packets | Discarded packets |
| A | 0 | 13174 | 2 |
| B | 0 | 13300 | 2 |
| C | 0 | 26098 | 2 |
| D | 0 | 14786 | 2 |
| Mode M9 | |||
|---|---|---|---|
| Quadrant | BADHDUFLAG | Total packets | Discarded packets |
| A | 0 | 13 | 0 |
| B | 0 | 14 | 0 |
| C | 0 | 14 | 0 |
| D | 0 | 14 | 0 |
| Mode SS | |||
|---|---|---|---|
| Quadrant | BADHDUFLAG | Total packets | Discarded packets |
| A | 0 | 128 | 0 |
| B | 0 | 128 | 0 |
| C | 0 | 128 | 0 |
| D | 0 | 128 | 0 |
| Quadrant | Total seconds | Saturated seconds | Saturation percentage |
|---|---|---|---|
| A | 6276 | 25 | 0.398343% |
| B | 6276 | 29 | 0.462078% |
| C | 6276 | 1467 | 23.374761% |
| D | 6276 | 97 | 1.545570% |
Noise dominated data is calculated using 1-second bins in cleaned event files. If a bin has >2000 counts, and if more than 50% of those come from <1% of pixels, then it is considered to be noise-dominated and hence unusable.
| Quadrant | # 1 sec bins | Bins with >0 counts | Bins with >2000 counts | High rate bins dominated by noise | Noise dominated (total time) | Noise dominated (detector-on time) | Marked lightcurve |
|---|---|---|---|---|---|---|---|
| A | 7456 | 6277 | 2 | 2 | 0.03% | 0.03% | 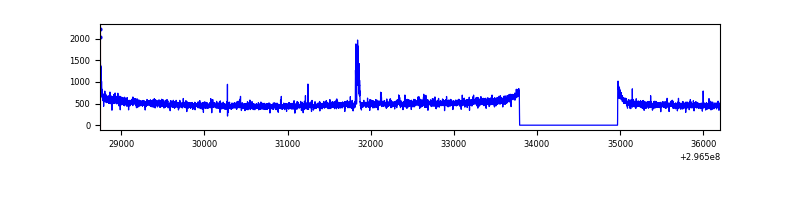 |
| B | 7456 | 6277 | 8 | 8 | 0.11% | 0.13% | 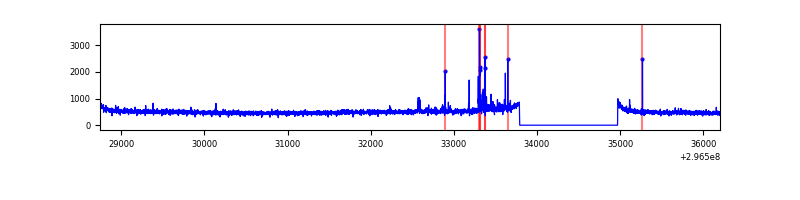 |
| C | 7455 | 6276 | 1108 | 1108 | 14.86% | 17.65% | 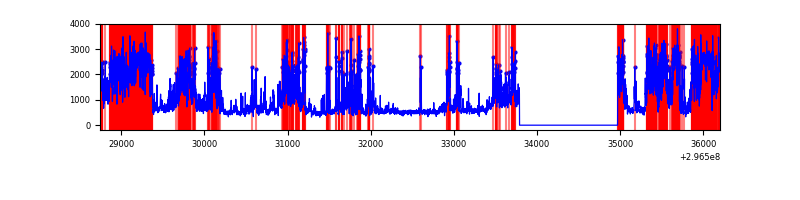 |
| D | 7456 | 6277 | 72 | 72 | 0.97% | 1.15% | 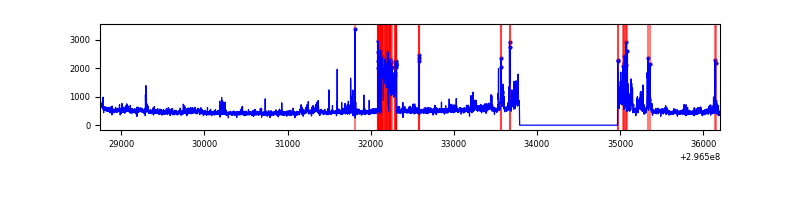 |
Top three noisy pixels from each quadrant. If the there are fewer than three noisy pixels in the level2.evt file, extra rows are filled as -1
| Pixel properties | Quadrant properties | ||||||
|---|---|---|---|---|---|---|---|
| Quadrant | DetID | PixID | Counts | Sigma | Mean | Median | Sigma |
| A | 4 | 2 | 38579 | 237.23 | 790 | 776 | 159.4 |
| A | 0 | 23 | 26865 | 163.72 | 790 | 776 | 159.4 |
| A | 15 | 192 | 10323 | 59.91 | 790 | 776 | 159.4 |
| B | 7 | 220 | 60978 | 394.67 | 794 | 774 | 152.5 |
| B | 12 | 111 | 18109 | 113.64 | 794 | 774 | 152.5 |
| B | 11 | 111 | 16149 | 100.79 | 794 | 774 | 152.5 |
| C | 3 | 233 | 4544403 | 28178.05 | 691 | 696 | 161.2 |
| C | 14 | 238 | 108320 | 667.44 | 691 | 696 | 161.2 |
| C | 4 | 175 | 7547 | 42.49 | 691 | 696 | 161.2 |
| D | 7 | 238 | 362900 | 1942.16 | 756 | 736 | 186.5 |
| D | 12 | 218 | 184814 | 987.15 | 756 | 736 | 186.5 |
| D | 1 | 52 | 135006 | 720.04 | 756 | 736 | 186.5 |
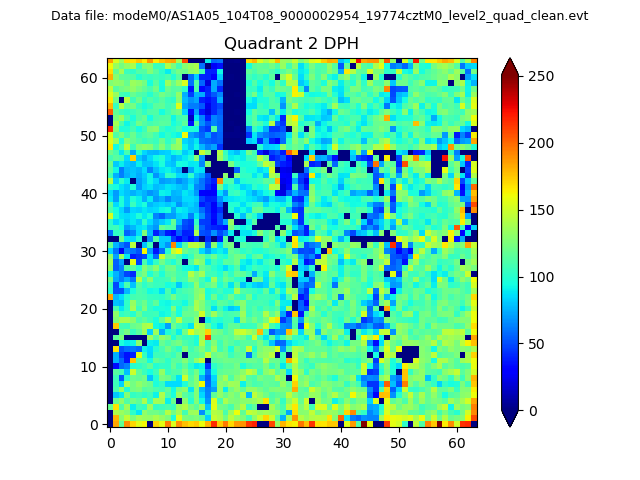
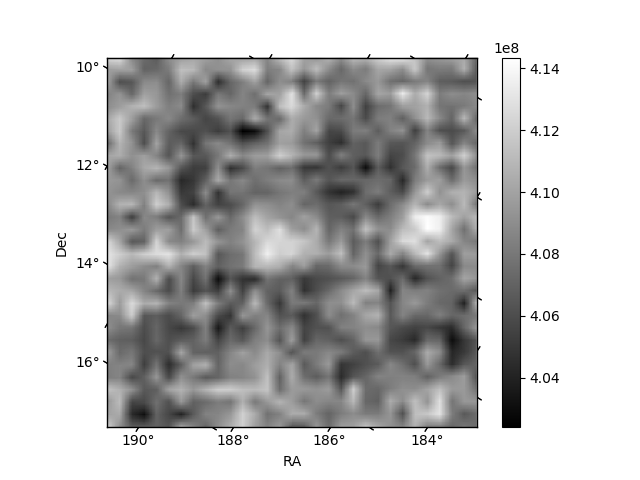
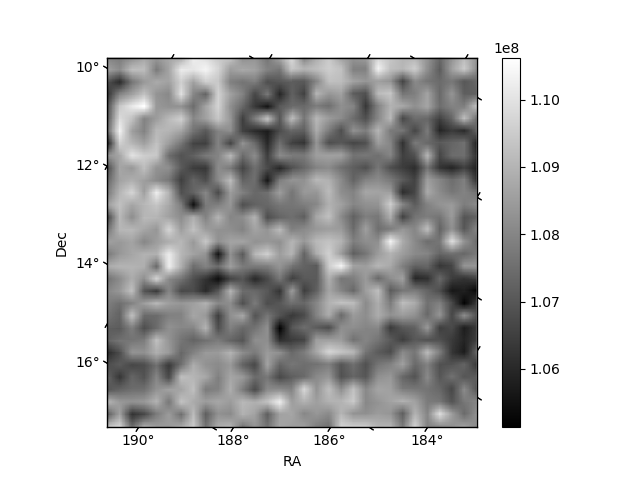
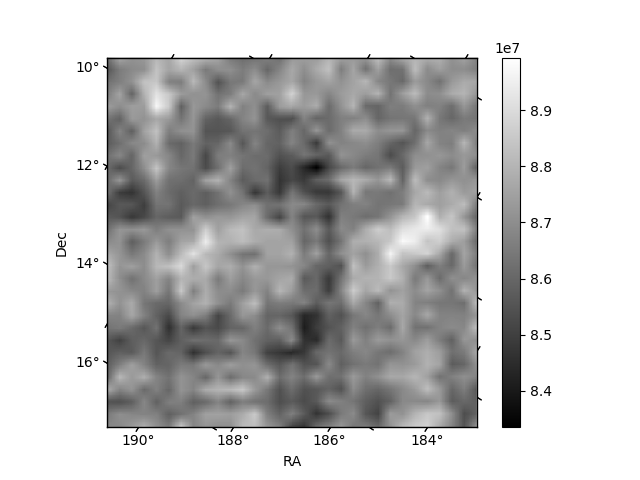
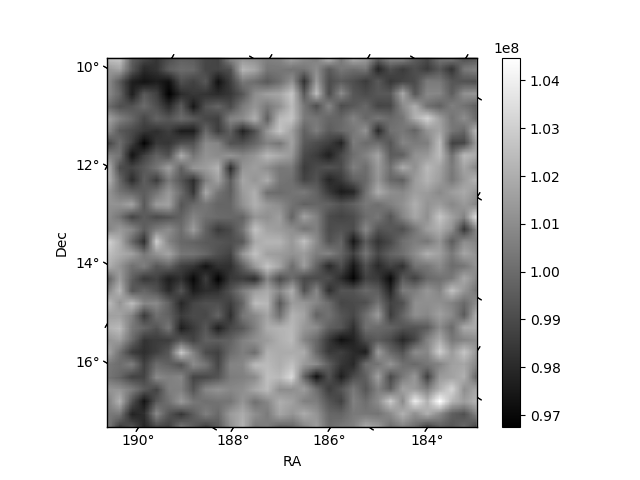
Histogram calculated using DETX and DETY for each event in the final _common_clean file
| Quadrant A | 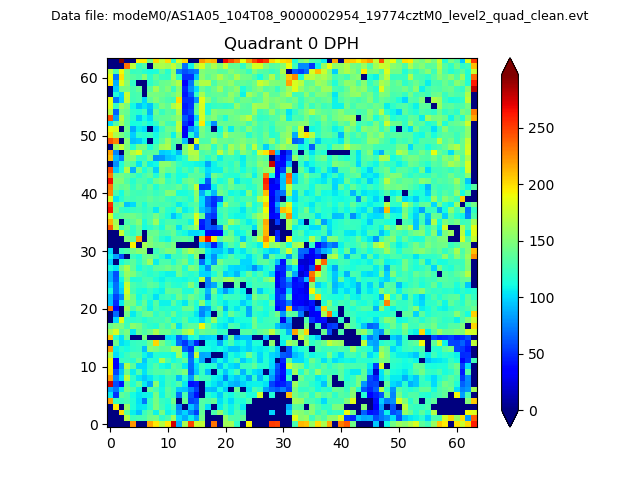 |
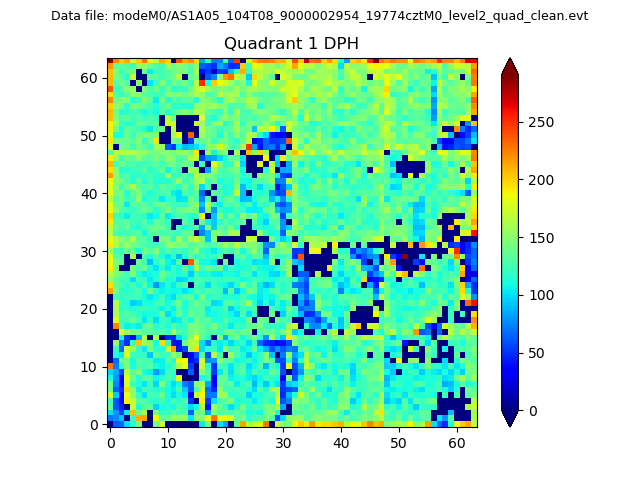 |
Quadrant B |
|---|---|---|---|
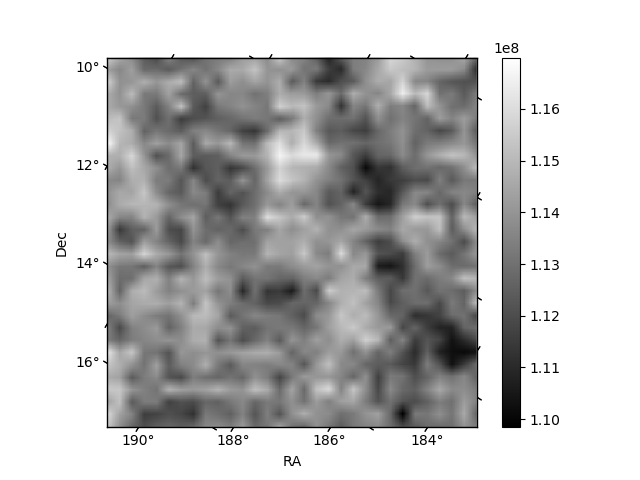
| Quadrant D | 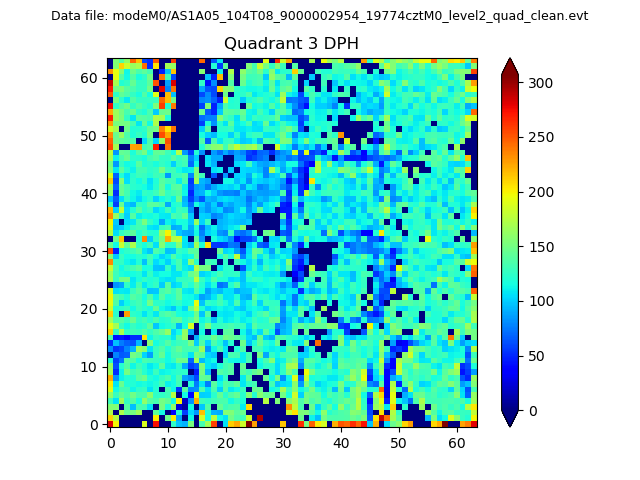 |
 |
Quadrant C |
| Plot type | Count rate plots | Images |
|---|---|---|
| Comparison with Poisson distribution Blue bars denote a histogram of data divided into 1 sec bins. Red curve is a Poisson curve with rate = median count rate of data. |
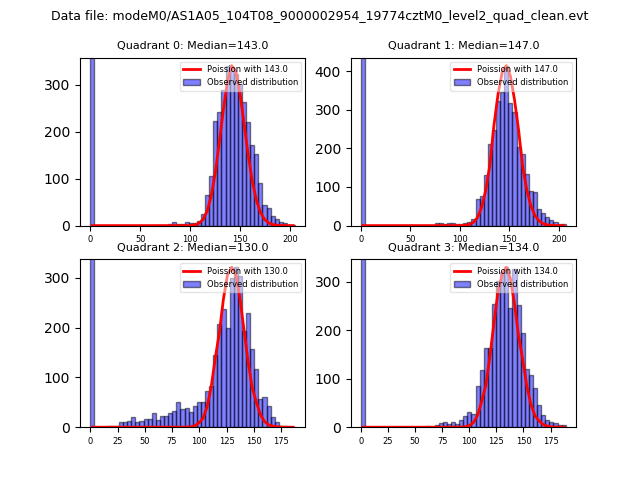 |
 |
| Quadrant-wise count rates Data is divided into 100 sec bins |
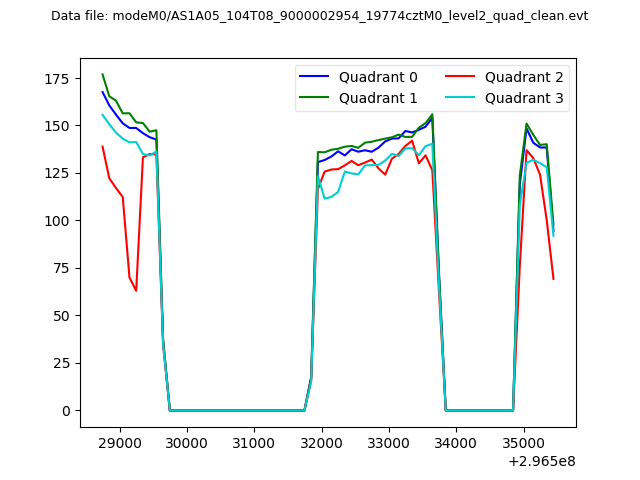 |
|
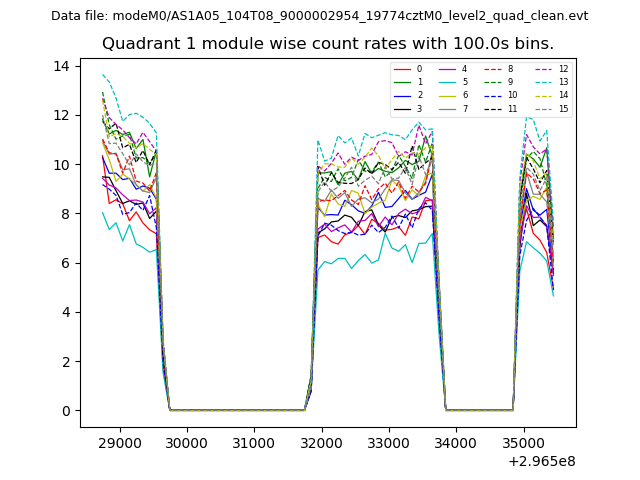
| Module-wise count rates for Quadrant A Data is divided into 100 sec bins |
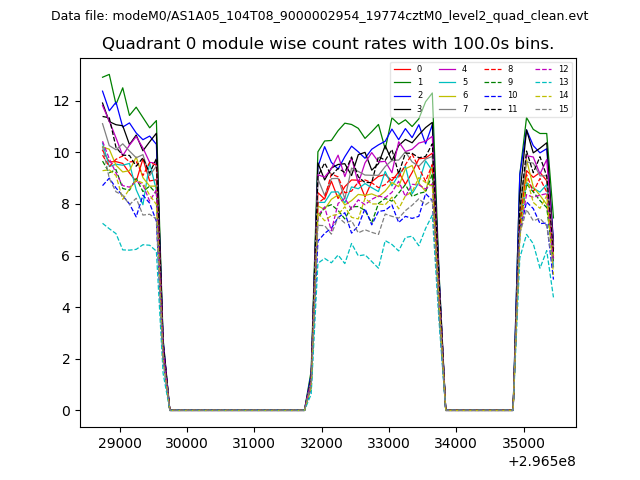 |
 |
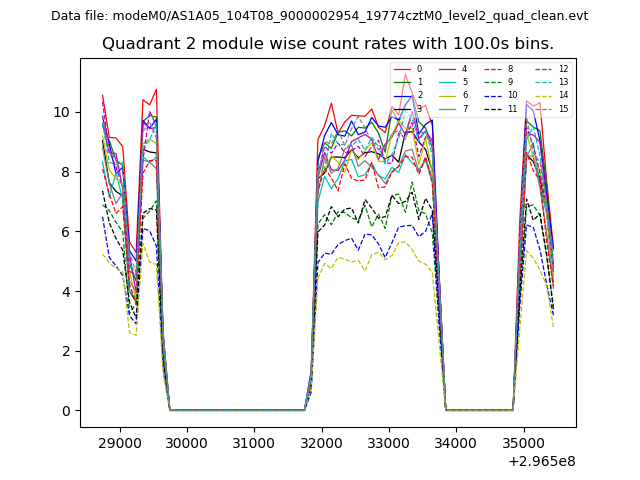
| Module-wise count rates for Quadrant B Data is divided into 100 sec bins |
 |
 |
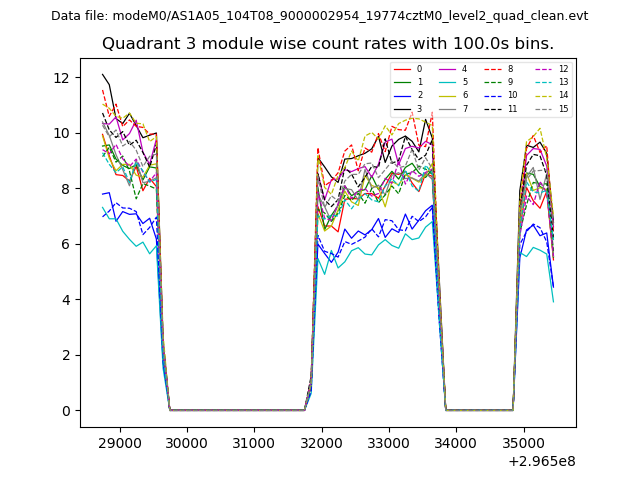
| Module-wise count rates for Quadrant C Data is divided into 100 sec bins |
 |
 |
| Module-wise count rates for Quadrant D Data is divided into 100 sec bins |
 |
 |
| Parameter | Plot |
|---|---|
| CZT HV Monitor | 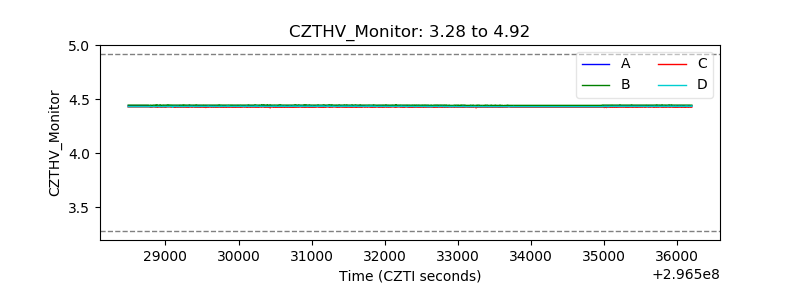 |
| D_VDD | 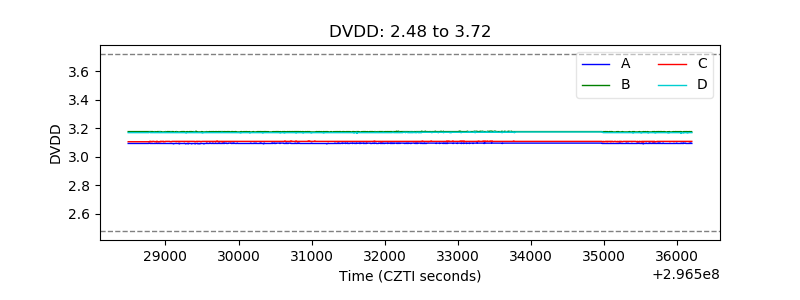 |
| Temperature 1 | 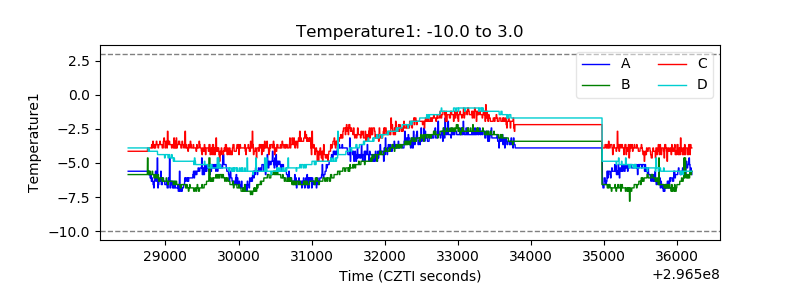 |
| Veto HV Monitor | 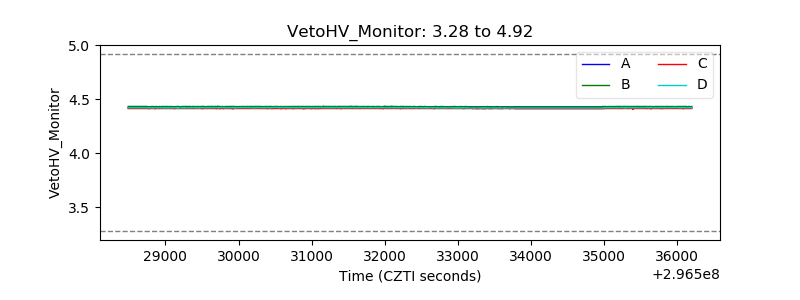 |
| Veto LLD | 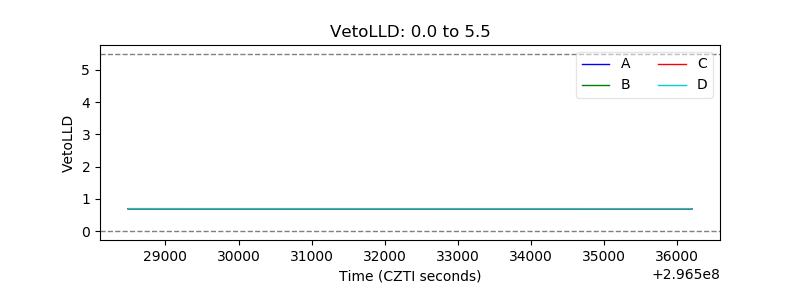 |
| Alpha Counter | 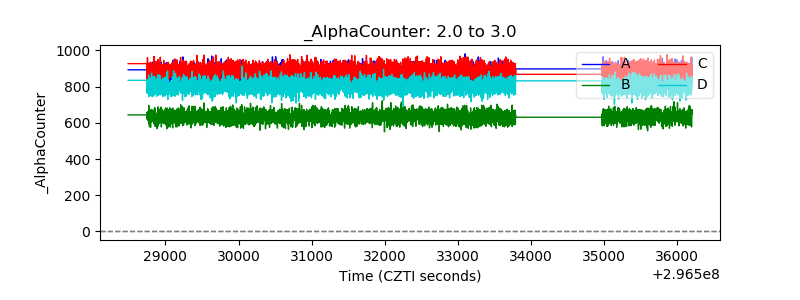 |
| _CPM_Rate | 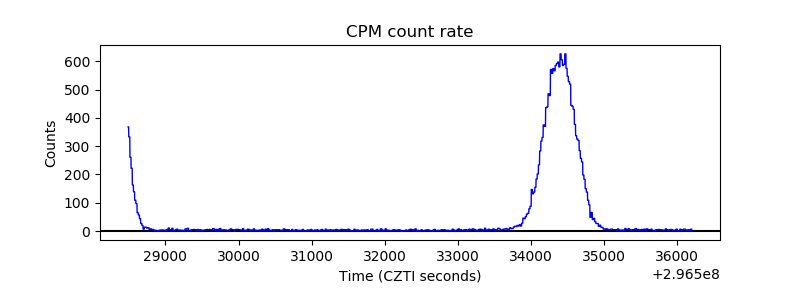 |
| CZT Counter | 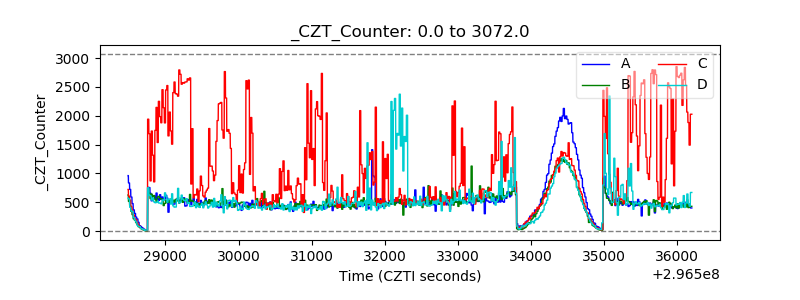 |
| +2.5 Volts monitor | 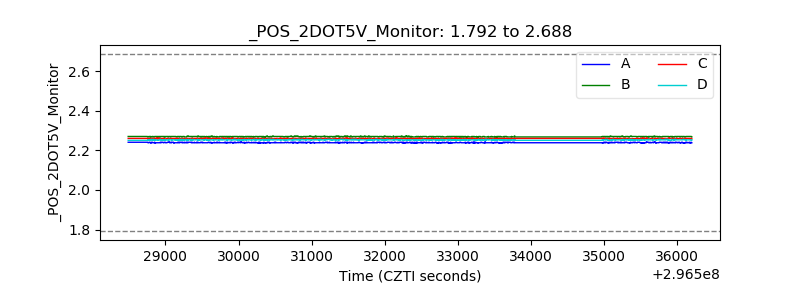 |
| +5 Volts monitor | 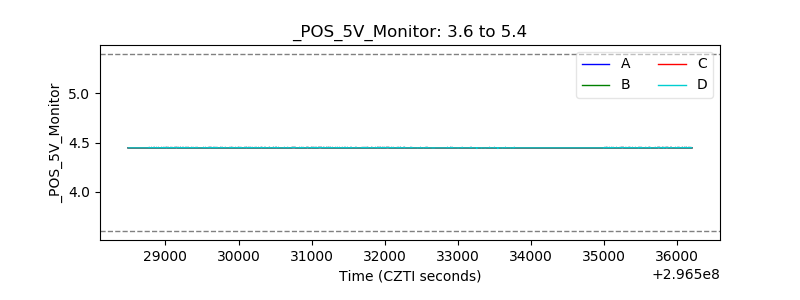 |
| _ROLL_ROT | 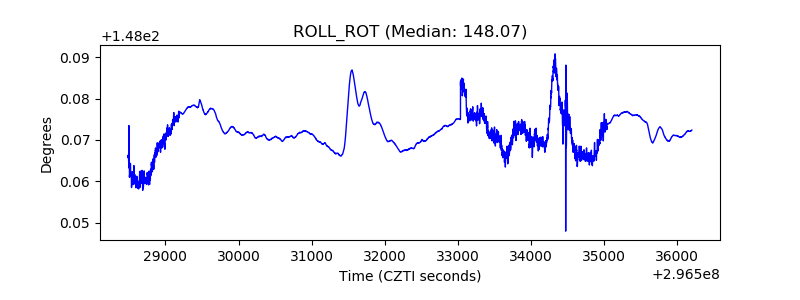 |
| _Roll_DEC | 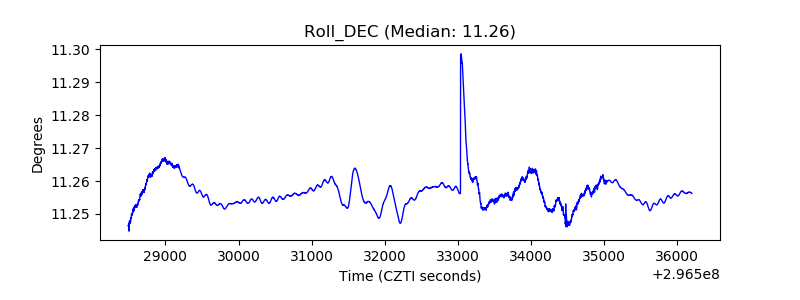 |
| _Roll_RA | 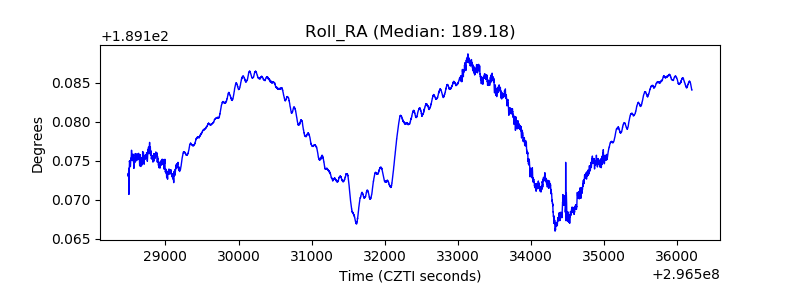 |
| Veto Counter | 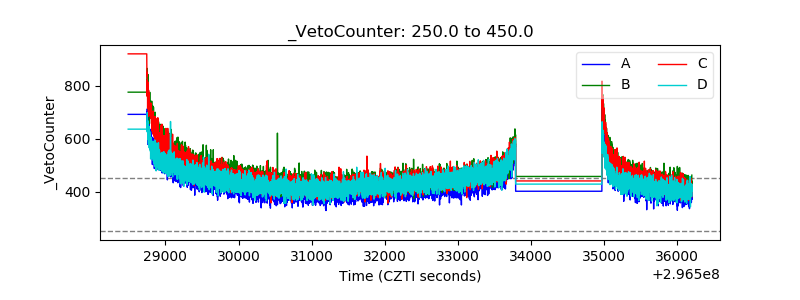 |