| Param | Original file | Final file |
|---|---|---|
| Filename | modeM0/AS1A05_104T08_9000002954_19775cztM0_level2.evt | modeM0/AS1A05_104T08_9000002954_19775cztM0_level2_quad_clean.evt |
| Size (bytes) | 578,203,200 | 73,307,520 |
| Size | 551.4 MB | 69.9 MB |
| Events in quadrant A | 3,260,616 | 451,567 |
| Events in quadrant B | 3,385,628 | 459,165 |
| Events in quadrant C | 6,559,940 | 417,670 |
| Events in quadrant D | 3,843,732 | 417,301 |
| Mode M0 | |||
|---|---|---|---|
| Quadrant | BADHDUFLAG | Total packets | Discarded packets |
| A | 0 | 13965 | 1 |
| B | 0 | 14230 | 1 |
| C | 0 | 23877 | 1 |
| D | 0 | 15980 | 1 |
| Mode M9 | |||
|---|---|---|---|
| Quadrant | BADHDUFLAG | Total packets | Discarded packets |
| A | 0 | 8 | 0 |
| B | 0 | 8 | 0 |
| C | 0 | 8 | 0 |
| D | 0 | 8 | 0 |
| Mode SS | |||
|---|---|---|---|
| Quadrant | BADHDUFLAG | Total packets | Discarded packets |
| A | 0 | 136 | 0 |
| B | 0 | 136 | 0 |
| C | 0 | 136 | 0 |
| D | 0 | 136 | 0 |
| Quadrant | Total seconds | Saturated seconds | Saturation percentage |
|---|---|---|---|
| A | 6803 | 64 | 0.940761% |
| B | 6804 | 115 | 1.690182% |
| C | 6804 | 1181 | 17.357437% |
| D | 6804 | 207 | 3.042328% |
Noise dominated data is calculated using 1-second bins in cleaned event files. If a bin has >2000 counts, and if more than 50% of those come from <1% of pixels, then it is considered to be noise-dominated and hence unusable.
| Quadrant | # 1 sec bins | Bins with >0 counts | Bins with >2000 counts | High rate bins dominated by noise | Noise dominated (total time) | Noise dominated (detector-on time) | Marked lightcurve |
|---|---|---|---|---|---|---|---|
| A | 7568 | 6804 | 0 | 0 | 0.00% | 0.00% | 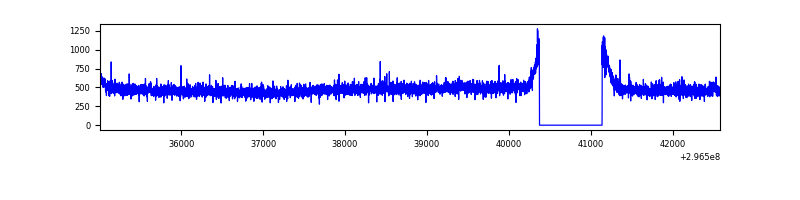 |
| B | 7569 | 6805 | 17 | 17 | 0.22% | 0.25% | 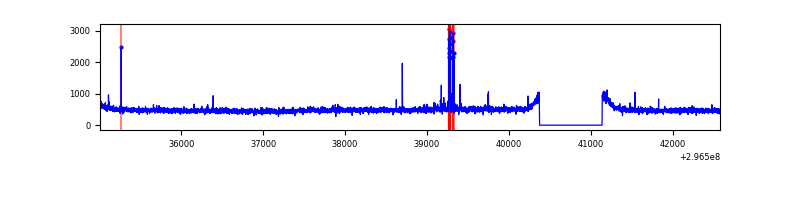 |
| C | 7569 | 6805 | 922 | 922 | 12.18% | 13.55% | 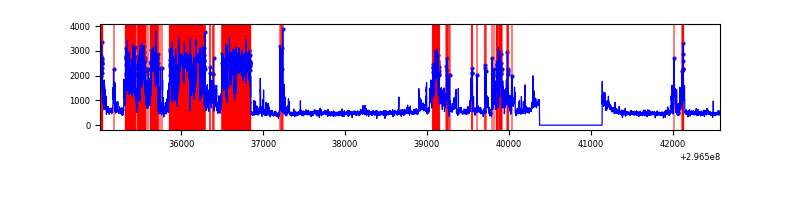 |
| D | 7569 | 6805 | 163 | 163 | 2.15% | 2.40% | 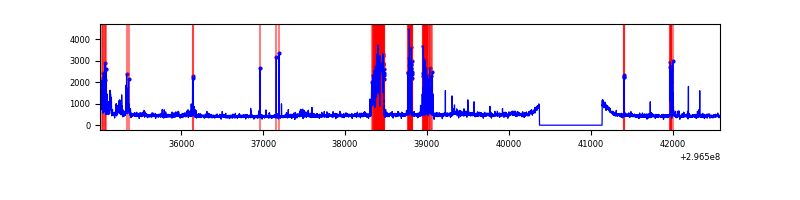 |
Top three noisy pixels from each quadrant. If the there are fewer than three noisy pixels in the level2.evt file, extra rows are filled as -1
| Pixel properties | Quadrant properties | ||||||
|---|---|---|---|---|---|---|---|
| Quadrant | DetID | PixID | Counts | Sigma | Mean | Median | Sigma |
| A | 6 | 16 | 12205 | 66.63 | 840 | 822 | 170.8 |
| A | 0 | 226 | 7495 | 39.06 | 840 | 822 | 170.8 |
| A | 13 | 254 | 7432 | 38.69 | 840 | 822 | 170.8 |
| B | 7 | 220 | 75850 | 462.06 | 840 | 819 | 162.4 |
| B | 12 | 111 | 19708 | 116.32 | 840 | 819 | 162.4 |
| B | 11 | 111 | 17755 | 104.3 | 840 | 819 | 162.4 |
| C | 3 | 233 | 3502237 | 19718.73 | 750 | 753 | 177.6 |
| C | 14 | 238 | 115558 | 646.53 | 750 | 753 | 177.6 |
| C | 7 | 247 | 14701 | 78.55 | 750 | 753 | 177.6 |
| D | 7 | 238 | 470381 | 2379.48 | 802 | 778 | 197.4 |
| D | 12 | 218 | 155692 | 784.95 | 802 | 778 | 197.4 |
| D | 1 | 52 | 109783 | 552.33 | 802 | 778 | 197.4 |
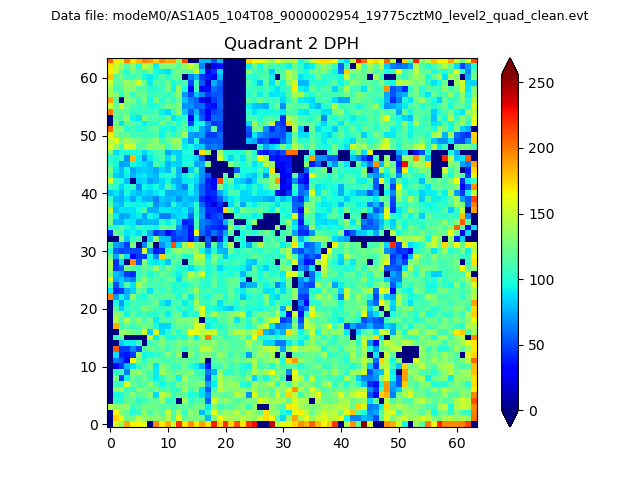
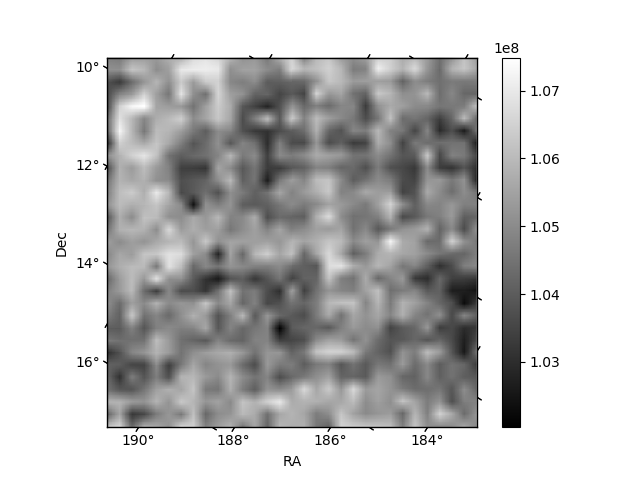
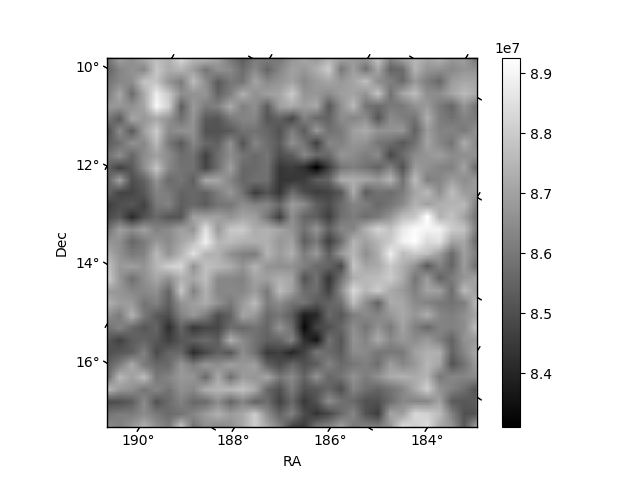
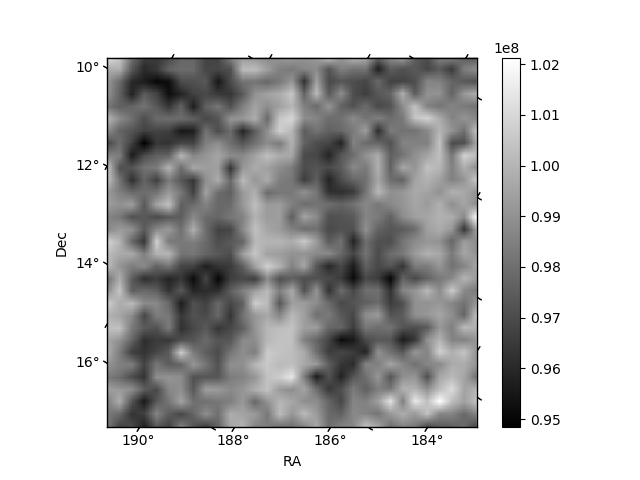
Histogram calculated using DETX and DETY for each event in the final _common_clean file
| Quadrant A | 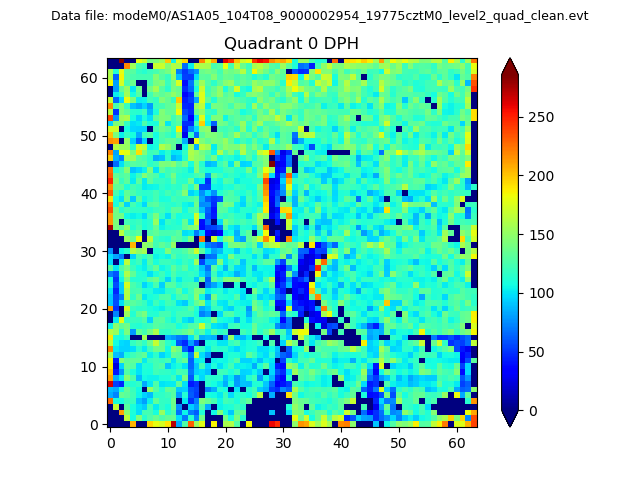 |
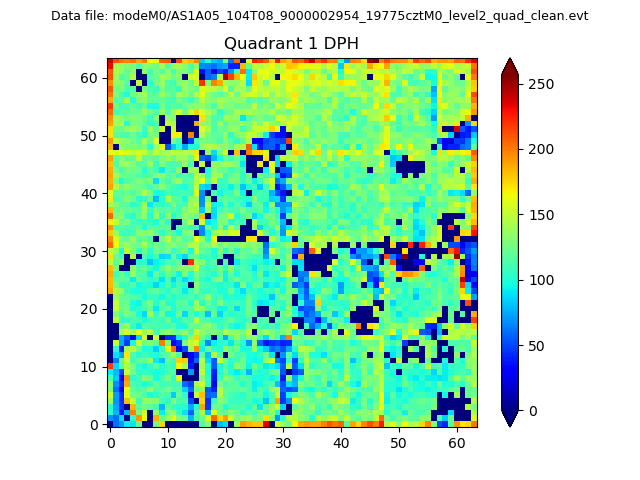 |
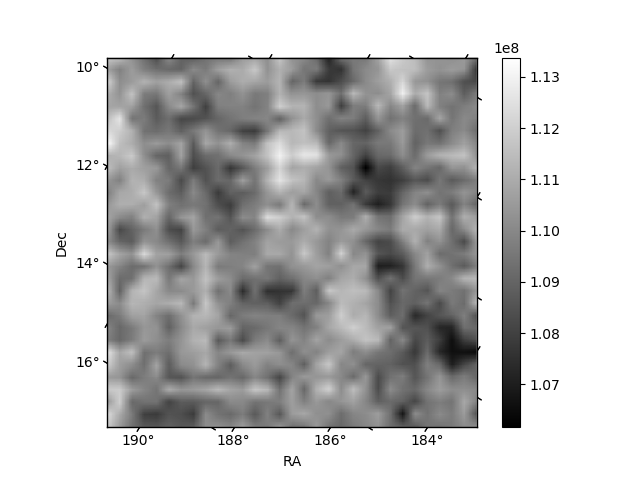
Quadrant B |
|---|---|---|---|
| Quadrant D | 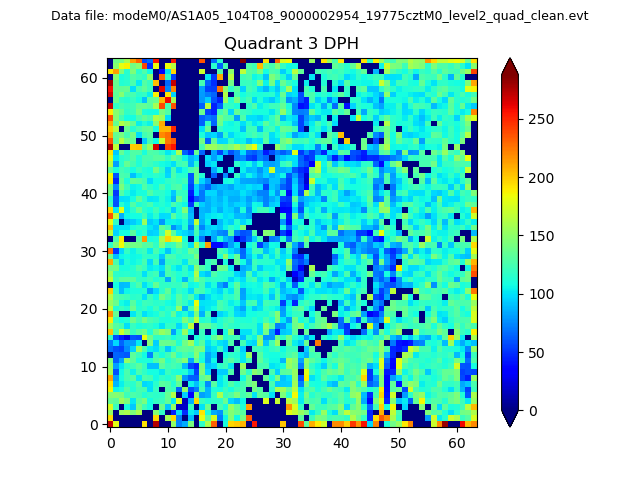 |
 |
Quadrant C |
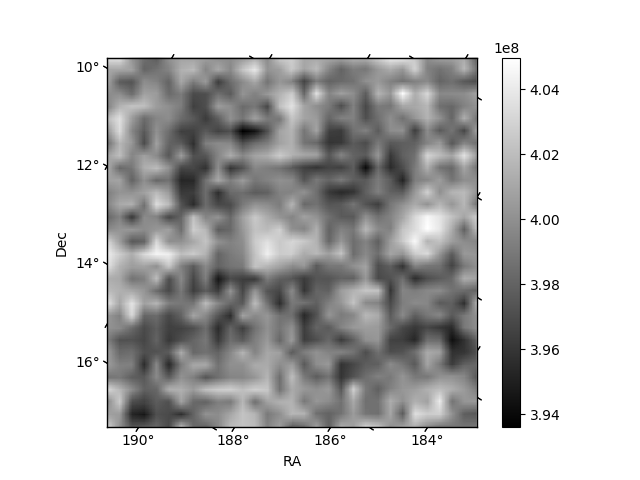
| Plot type | Count rate plots | Images |
|---|---|---|
| Comparison with Poisson distribution Blue bars denote a histogram of data divided into 1 sec bins. Red curve is a Poisson curve with rate = median count rate of data. |
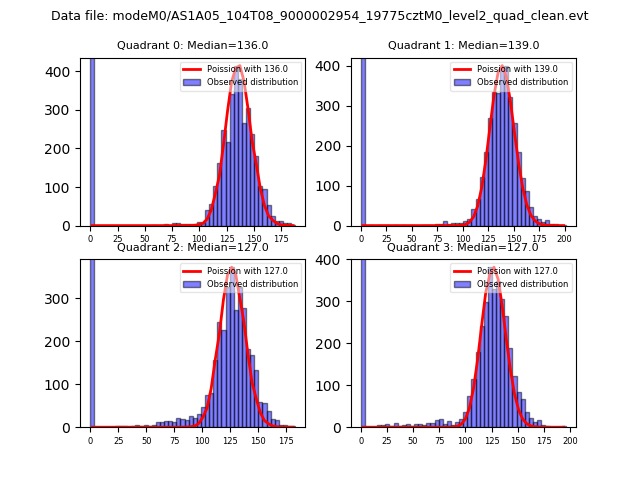 |
 |
| Quadrant-wise count rates Data is divided into 100 sec bins |
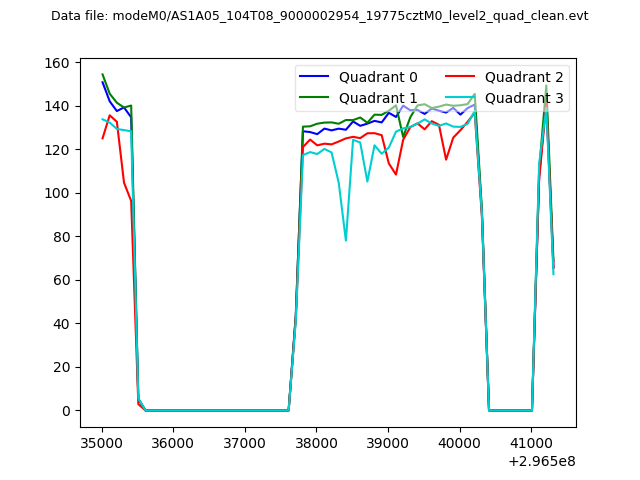 |
|
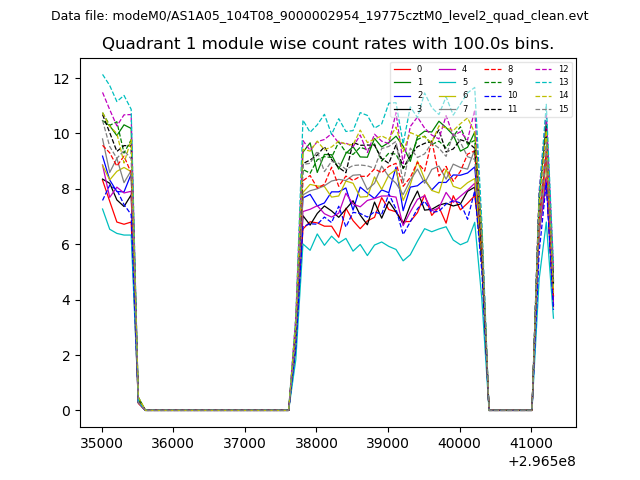
| Module-wise count rates for Quadrant A Data is divided into 100 sec bins |
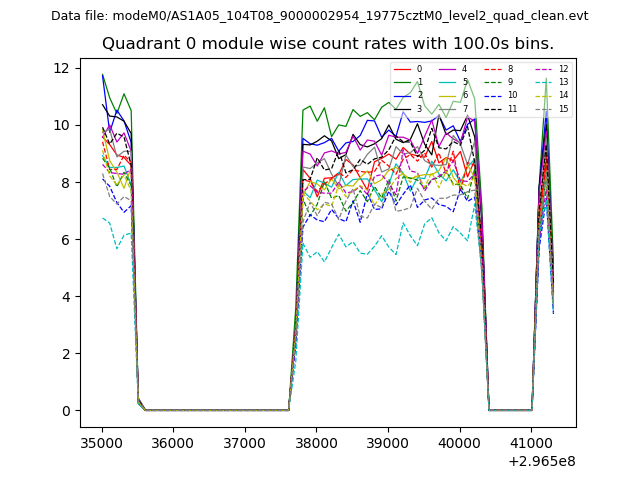 |
 |
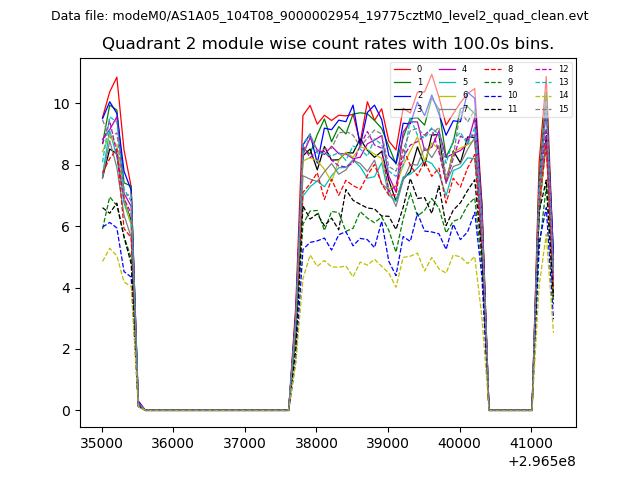
| Module-wise count rates for Quadrant B Data is divided into 100 sec bins |
 |
 |
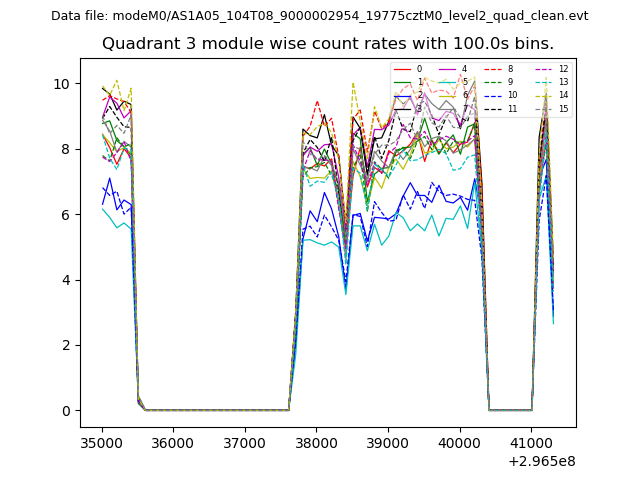
| Module-wise count rates for Quadrant C Data is divided into 100 sec bins |
 |
 |
| Module-wise count rates for Quadrant D Data is divided into 100 sec bins |
 |
 |
| Parameter | Plot |
|---|---|
| CZT HV Monitor | 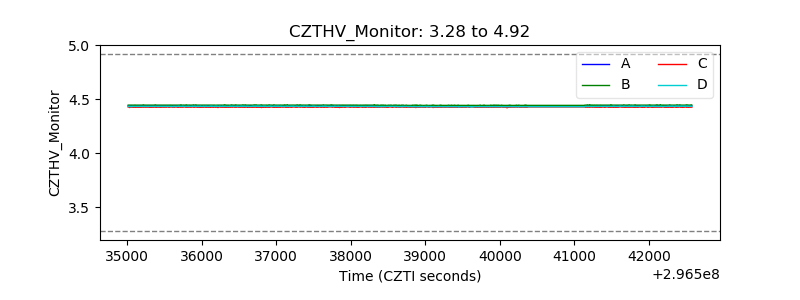 |
| D_VDD | 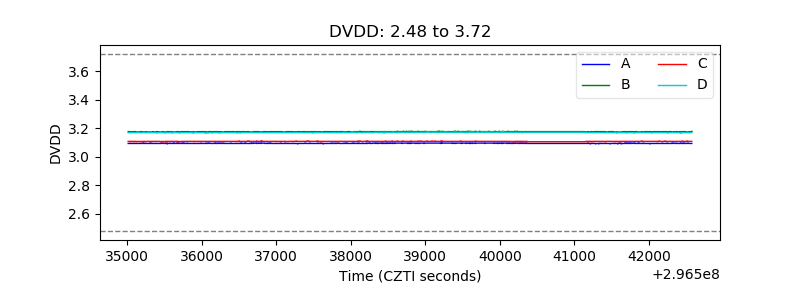 |
| Temperature 1 |  |
| Veto HV Monitor | 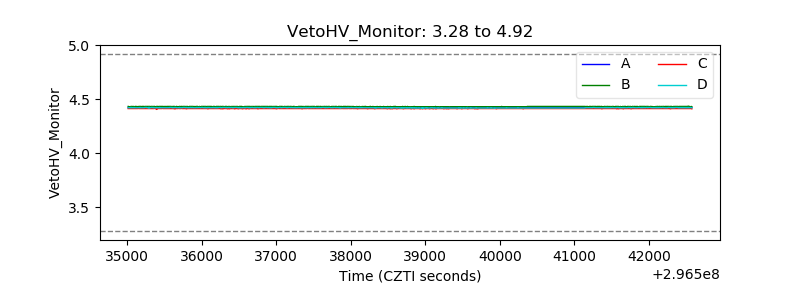 |
| Veto LLD | 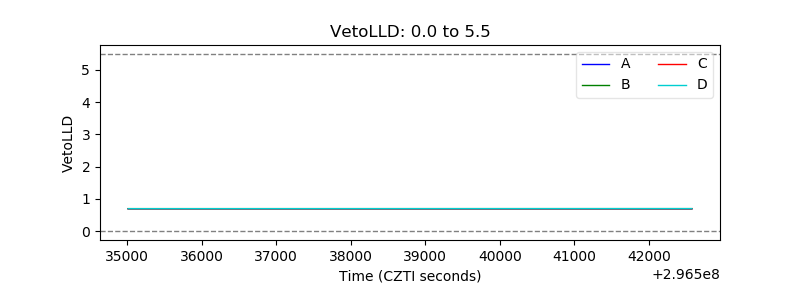 |
| Alpha Counter |  |
| _CPM_Rate | 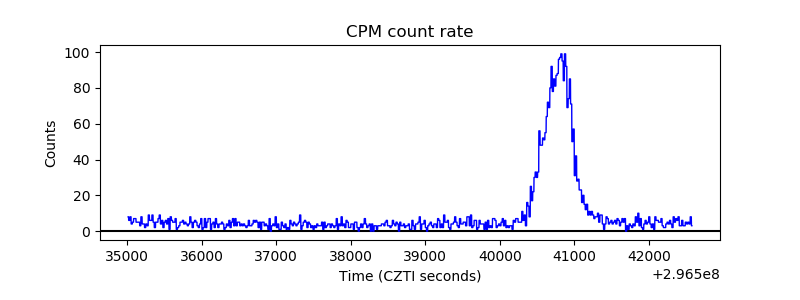 |
| CZT Counter | 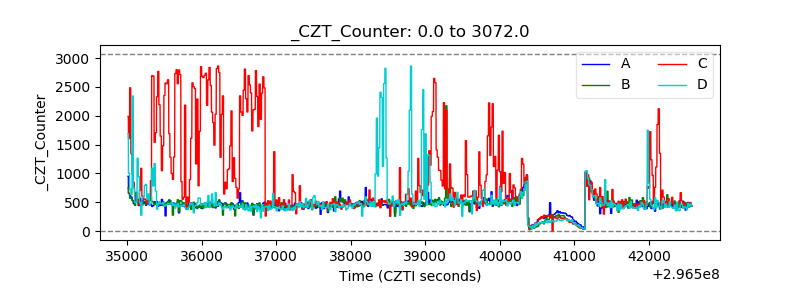 |
| +2.5 Volts monitor |  |
| +5 Volts monitor |  |
| _ROLL_ROT | 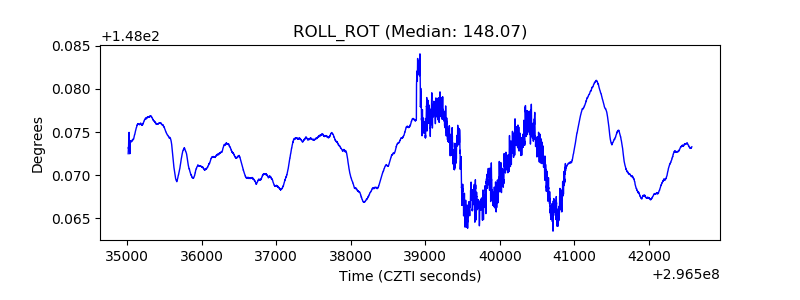 |
| _Roll_DEC | 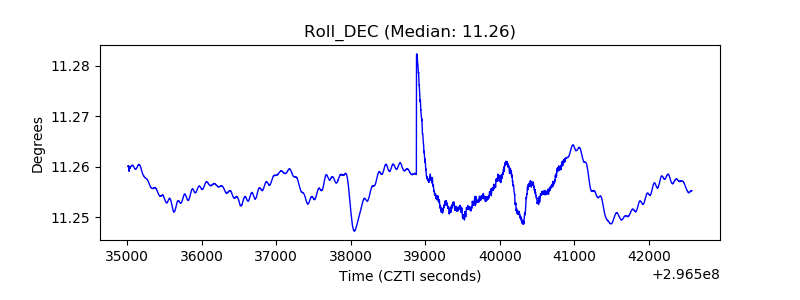 |
| _Roll_RA | 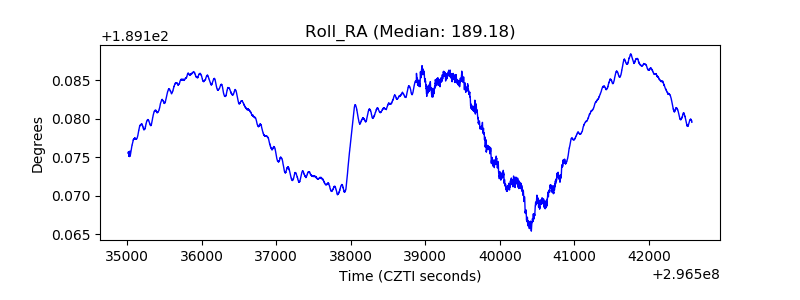 |
| Veto Counter | 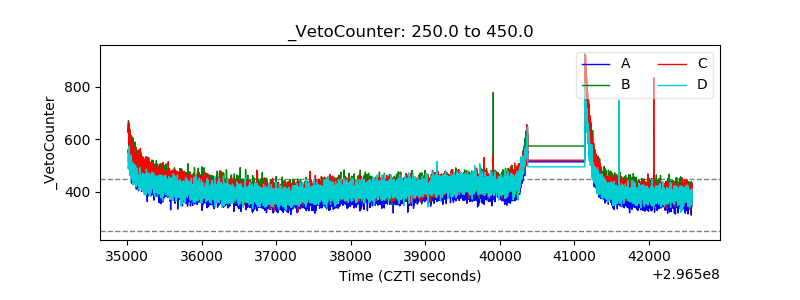 |