| Param | Original file | Final file |
|---|---|---|
| Filename | modeM0/AS1A05_117T01_9000002958cztM0_level2.fits | modeM0/AS1A05_117T01_9000002958cztM0_level2_quad_clean.evt |
| Size (bytes) | 1,117,618,560 | 1,071,970,560 |
| Size | 1.0 GB | 1022.3 MB |
| Events in quadrant A | 6,659,236 | 6,092,214 |
| Events in quadrant B | 6,753,782 | 6,675,084 |
| Events in quadrant C | 6,702,614 | 6,095,138 |
| Events in quadrant D | 5,890,260 | 5,768,882 |
| Mode M9 | |||
|---|---|---|---|
| Quadrant | BADHDUFLAG | Total packets | Discarded packets |
| A | 0 | 209 | 0 |
| B | 0 | 209 | 0 |
| C | 0 | 209 | 0 |
| D | 0 | 209 | 0 |
| Mode M0 | |||
|---|---|---|---|
| Quadrant | BADHDUFLAG | Total packets | Discarded packets |
| A | 0 | 351474 | 0 |
| B | 0 | 246091 | 0 |
| C | 0 | 290836 | 0 |
| D | 0 | 294186 | 0 |
| Mode SS | |||
|---|---|---|---|
| Quadrant | BADHDUFLAG | Total packets | Discarded packets |
| A | 0 | 2324 | 0 |
| B | 0 | 2324 | 0 |
| C | 0 | 2324 | 0 |
| D | 0 | 2324 | 0 |
| Quadrant | Total seconds | Saturated seconds | Saturation percentage |
|---|---|---|---|
| A | 114312 | 10117 | 8.850339% |
| B | 114318 | 2014 | 1.761752% |
| C | 114314 | 6890 | 6.027258% |
| D | 114315 | 5267 | 4.607444% |
Noise dominated data is calculated using 1-second bins in cleaned event files. If a bin has >2000 counts, and if more than 50% of those come from <1% of pixels, then it is considered to be noise-dominated and hence unusable.
| Quadrant | # 1 sec bins | Bins with >0 counts | Bins with >2000 counts | High rate bins dominated by noise | Noise dominated (total time) | Noise dominated (detector-on time) | Marked lightcurve |
|---|---|---|---|---|---|---|---|
| A | 134593 | 114254 | 0 | 0 | 0.00% | 0.00% |  |
| B | 134593 | 114323 | 0 | 0 | 0.00% | 0.00% |  |
| C | 134593 | 114186 | 0 | 0 | 0.00% | 0.00% |  |
| D | 134593 | 114323 | 0 | 0 | 0.00% | 0.00% |  |
Top three noisy pixels from each quadrant. If the there are fewer than three noisy pixels in the level2.evt file, extra rows are filled as -1
| Pixel properties | Quadrant properties | ||||||
|---|---|---|---|---|---|---|---|
| Quadrant | DetID | PixID | Counts | Sigma | Mean | Median | Sigma |
| A | 0 | 29 | 6257 | 11.06 | 1734 | 1630 | 418.5 |
| A | 7 | 110 | 5442 | 9.11 | 1734 | 1630 | 418.5 |
| A | 9 | 19 | 5034 | 8.13 | 1734 | 1630 | 418.5 |
| B | 2 | 9 | 5471 | 10.92 | 1782 | 1701 | 345.2 |
| B | 2 | 8 | 4676 | 8.62 | 1782 | 1701 | 345.2 |
| B | 3 | 17 | 4435 | 7.92 | 1782 | 1701 | 345.2 |
| C | 1 | 80 | 5135 | 7.79 | 1766 | 1655 | 446.9 |
| C | 1 | 81 | 5114 | 7.74 | 1766 | 1655 | 446.9 |
| C | 2 | 191 | 4561 | 6.5 | 1766 | 1655 | 446.9 |
| D | 6 | 67 | 4210 | 6.11 | 1681 | 1535 | 437.5 |
| D | 15 | 46 | 4199 | 6.09 | 1681 | 1535 | 437.5 |
| D | 10 | 189 | 4171 | 6.03 | 1681 | 1535 | 437.5 |
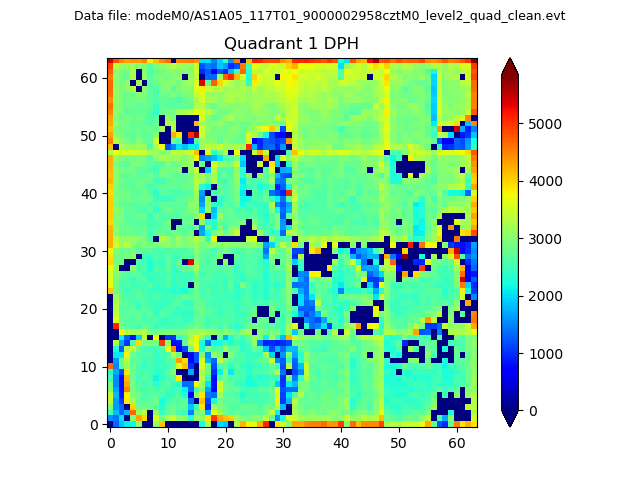
Histogram calculated using DETX and DETY for each event in the final _common_clean file
| Quadrant A |  |
 |
Quadrant B |
|---|---|---|---|
| Quadrant D |  |
 |
Quadrant C |
| Plot type | Count rate plots | Images |
|---|---|---|
| Comparison with Poisson distribution Blue bars denote a histogram of data divided into 1 sec bins. Red curve is a Poisson curve with rate = median count rate of data. |
 |
 |
| Quadrant-wise count rates Data is divided into 100 sec bins |
 |
|
| Module-wise count rates for Quadrant A Data is divided into 100 sec bins |
 |
 |
| Module-wise count rates for Quadrant B Data is divided into 100 sec bins |
 |
 |
| Module-wise count rates for Quadrant C Data is divided into 100 sec bins |
 |
 |
| Module-wise count rates for Quadrant D Data is divided into 100 sec bins |
 |
 |
| Parameter | Plot |
|---|---|
| CZT HV Monitor |  |
| D_VDD |  |
| Temperature 1 |  |
| Veto HV Monitor |  |
| Veto LLD |  |
| Alpha Counter |  |
| _CPM_Rate |  |
| CZT Counter |  |
| +2.5 Volts monitor |  |
| +5 Volts monitor |  |
| _ROLL_ROT |  |
| _Roll_DEC |  |
| _Roll_RA |  |
| Veto Counter |  |