| Param | Original file | Final file |
|---|---|---|
| Filename | modeM0/AS1A05_117T01_9000002958_19780cztM0_level2.evt | modeM0/AS1A05_117T01_9000002958_19780cztM0_level2_quad_clean.evt |
| Size (bytes) | 775,261,440 | 74,787,840 |
| Size | 739.3 MB | 71.3 MB |
| Events in quadrant A | 3,480,641 | 483,150 |
| Events in quadrant B | 3,671,554 | 487,865 |
| Events in quadrant C | 11,309,480 | 333,284 |
| Events in quadrant D | 4,531,470 | 459,481 |
| Mode M9 | |||
|---|---|---|---|
| Quadrant | BADHDUFLAG | Total packets | Discarded packets |
| A | 0 | 11 | 0 |
| B | 0 | 11 | 0 |
| C | 0 | 11 | 0 |
| D | 0 | 11 | 0 |
| Mode M0 | |||
|---|---|---|---|
| Quadrant | BADHDUFLAG | Total packets | Discarded packets |
| A | 0 | 14994 | 2 |
| B | 0 | 15480 | 2 |
| C | 0 | 38524 | 2 |
| D | 0 | 18236 | 2 |
| Mode SS | |||
|---|---|---|---|
| Quadrant | BADHDUFLAG | Total packets | Discarded packets |
| A | 0 | 144 | 0 |
| B | 0 | 144 | 0 |
| C | 0 | 144 | 0 |
| D | 0 | 144 | 0 |
| Quadrant | Total seconds | Saturated seconds | Saturation percentage |
|---|---|---|---|
| A | 7183 | 124 | 1.726298% |
| B | 7183 | 159 | 2.213560% |
| C | 7183 | 3314 | 46.136712% |
| D | 7183 | 244 | 3.396909% |
Noise dominated data is calculated using 1-second bins in cleaned event files. If a bin has >2000 counts, and if more than 50% of those come from <1% of pixels, then it is considered to be noise-dominated and hence unusable.
| Quadrant | # 1 sec bins | Bins with >0 counts | Bins with >2000 counts | High rate bins dominated by noise | Noise dominated (total time) | Noise dominated (detector-on time) | Marked lightcurve |
|---|---|---|---|---|---|---|---|
| A | 7873 | 7184 | 12 | 12 | 0.15% | 0.17% | 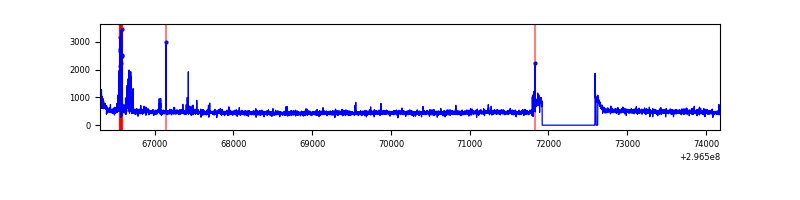 |
| B | 7873 | 7183 | 34 | 34 | 0.43% | 0.47% | 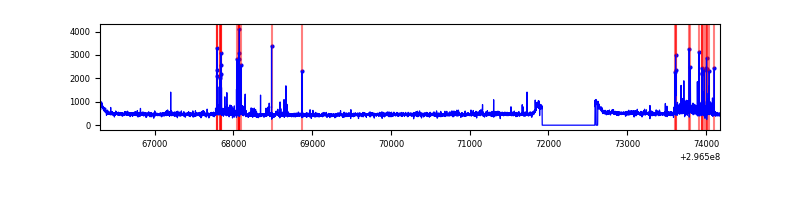 |
| C | 7873 | 7183 | 2659 | 2659 | 33.77% | 37.02% | 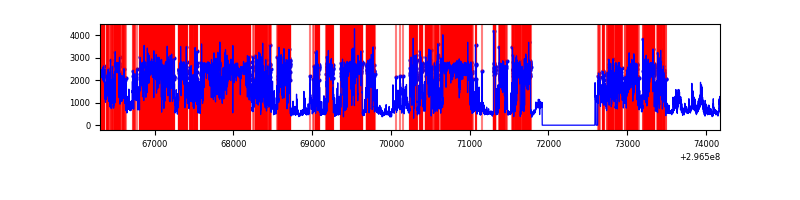 |
| D | 7872 | 7183 | 157 | 157 | 1.99% | 2.19% | 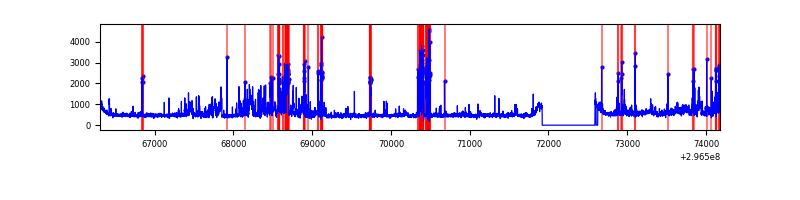 |
Top three noisy pixels from each quadrant. If the there are fewer than three noisy pixels in the level2.evt file, extra rows are filled as -1
| Pixel properties | Quadrant properties | ||||||
|---|---|---|---|---|---|---|---|
| Quadrant | DetID | PixID | Counts | Sigma | Mean | Median | Sigma |
| A | 4 | 2 | 90064 | 501.62 | 873 | 852 | 177.8 |
| A | 0 | 23 | 9270 | 47.33 | 873 | 852 | 177.8 |
| A | 8 | 192 | 8480 | 42.89 | 873 | 852 | 177.8 |
| B | 7 | 220 | 255340 | 1527.55 | 862 | 838 | 166.6 |
| B | 12 | 111 | 20311 | 116.88 | 862 | 838 | 166.6 |
| B | 11 | 111 | 18162 | 103.98 | 862 | 838 | 166.6 |
| C | 3 | 233 | 8630984 | 56331.45 | 648 | 651 | 153.2 |
| C | 14 | 238 | 96113 | 623.09 | 648 | 651 | 153.2 |
| C | 7 | 247 | 36789 | 235.88 | 648 | 651 | 153.2 |
| D | 1 | 52 | 841270 | 4111.51 | 844 | 818 | 204.4 |
| D | 12 | 218 | 273022 | 1331.62 | 844 | 818 | 204.4 |
| D | 2 | 184 | 125811 | 611.47 | 844 | 818 | 204.4 |
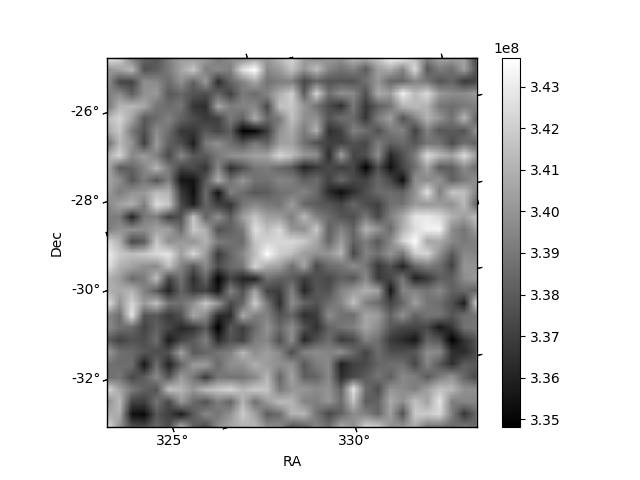
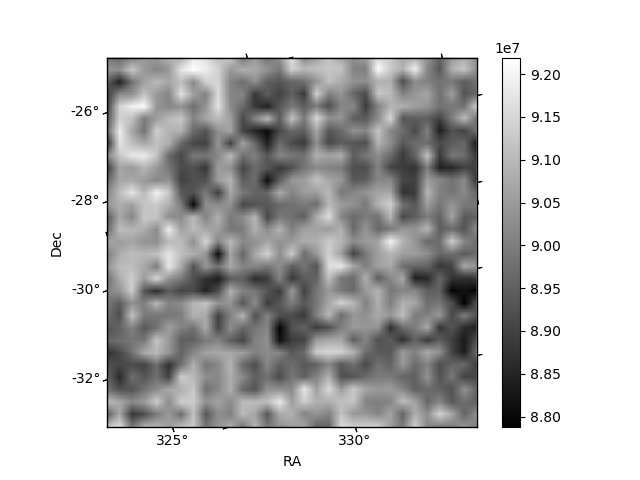
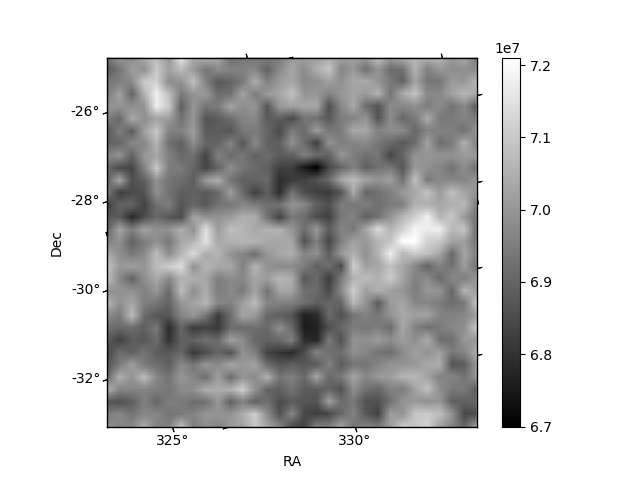
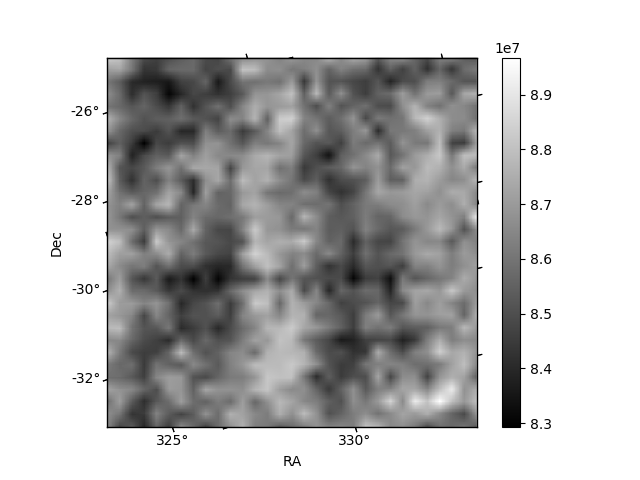
Histogram calculated using DETX and DETY for each event in the final _common_clean file
| Quadrant A | 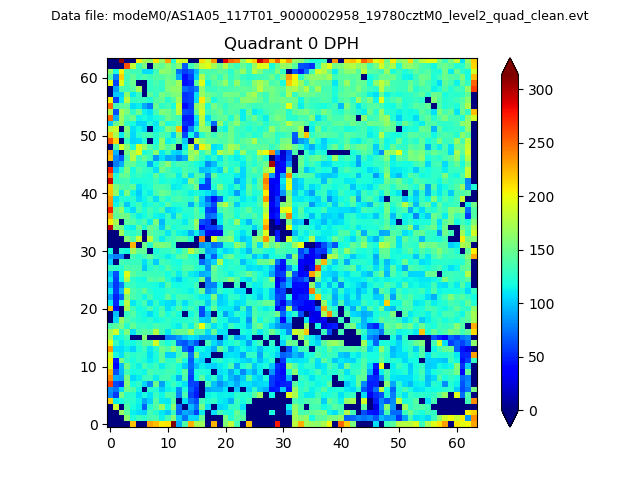 |
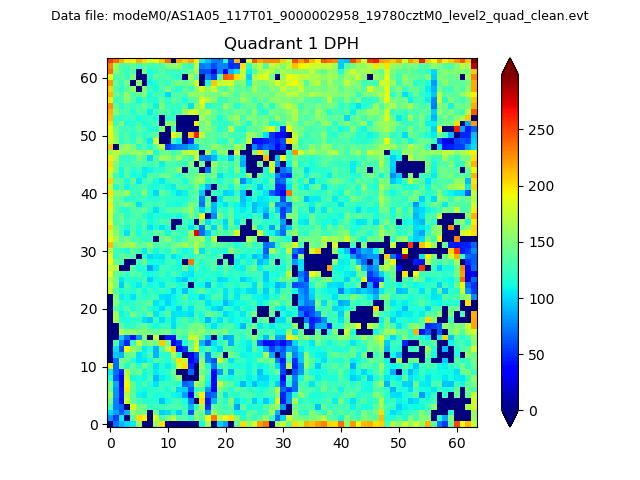 |
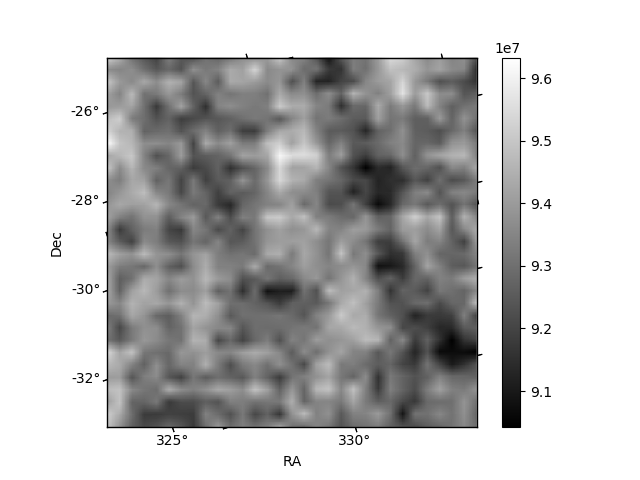
Quadrant B |
|---|---|---|---|
| Quadrant D | 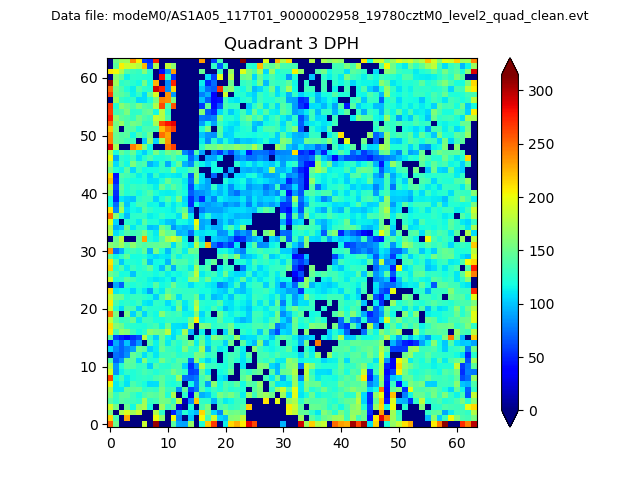 |
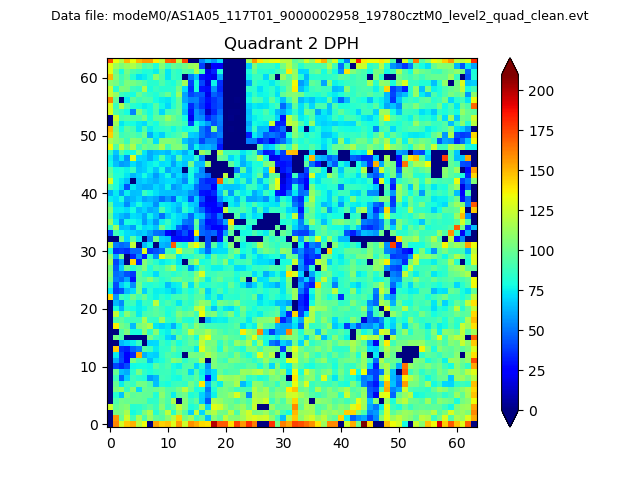 |
Quadrant C |
| Plot type | Count rate plots | Images |
|---|---|---|
| Comparison with Poisson distribution Blue bars denote a histogram of data divided into 1 sec bins. Red curve is a Poisson curve with rate = median count rate of data. |
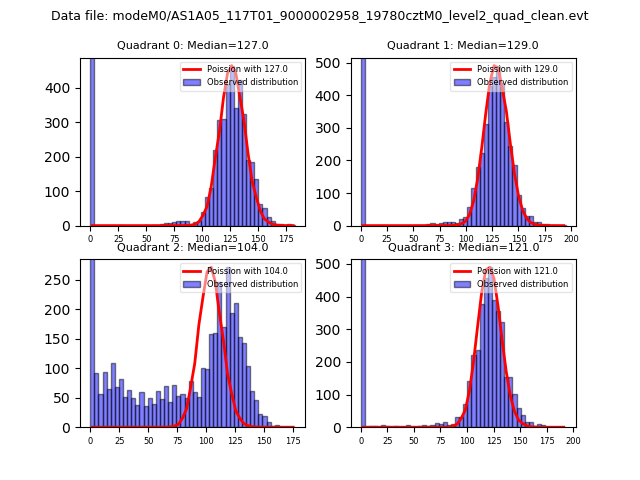 |
 |
| Quadrant-wise count rates Data is divided into 100 sec bins |
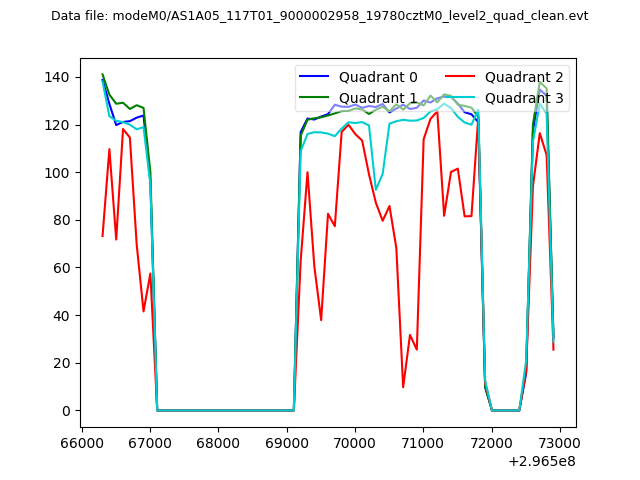 |
|
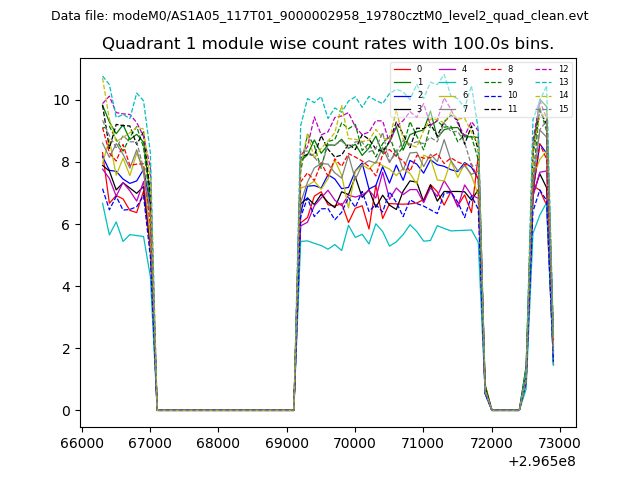
| Module-wise count rates for Quadrant A Data is divided into 100 sec bins |
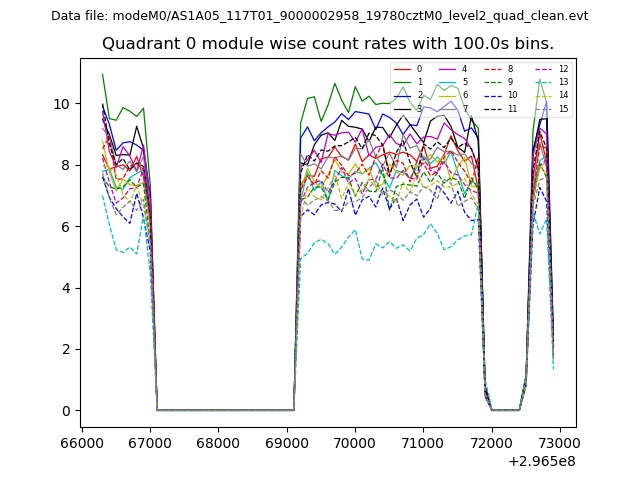 |
 |
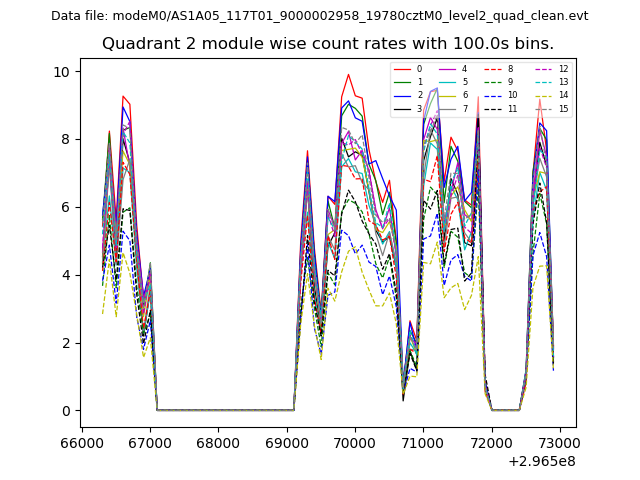
| Module-wise count rates for Quadrant B Data is divided into 100 sec bins |
 |
 |
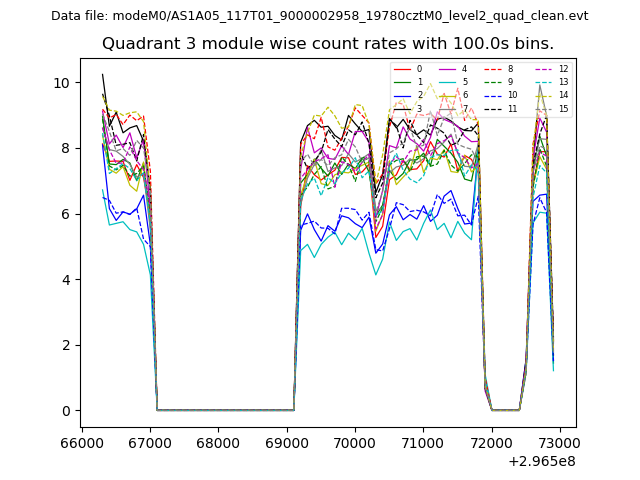
| Module-wise count rates for Quadrant C Data is divided into 100 sec bins |
 |
 |
| Module-wise count rates for Quadrant D Data is divided into 100 sec bins |
 |
 |
| Parameter | Plot |
|---|---|
| CZT HV Monitor | 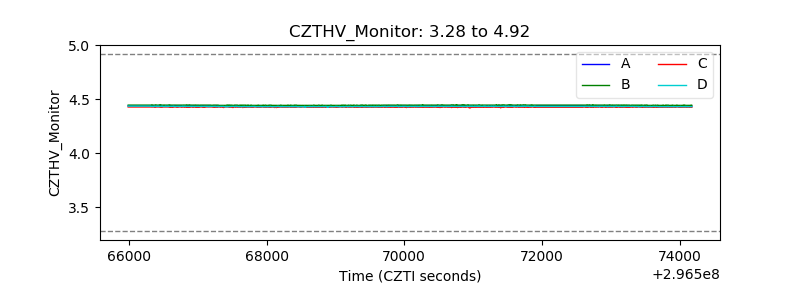 |
| D_VDD | 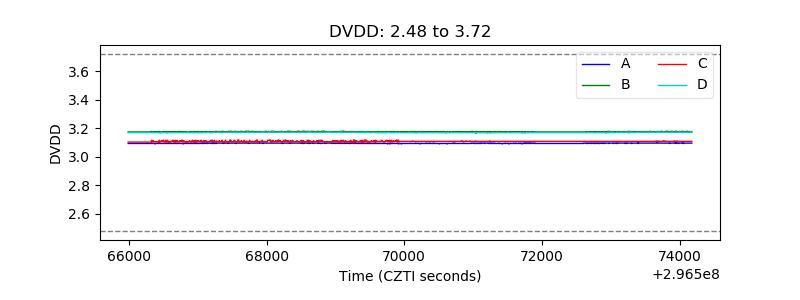 |
| Temperature 1 |  |
| Veto HV Monitor | 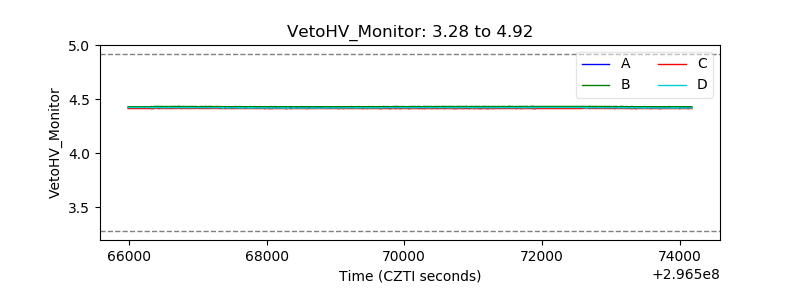 |
| Veto LLD | 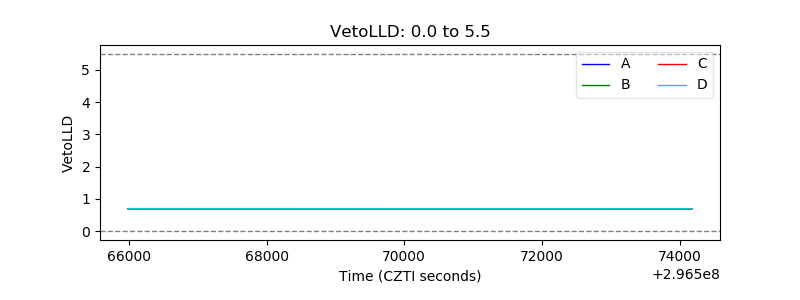 |
| Alpha Counter | 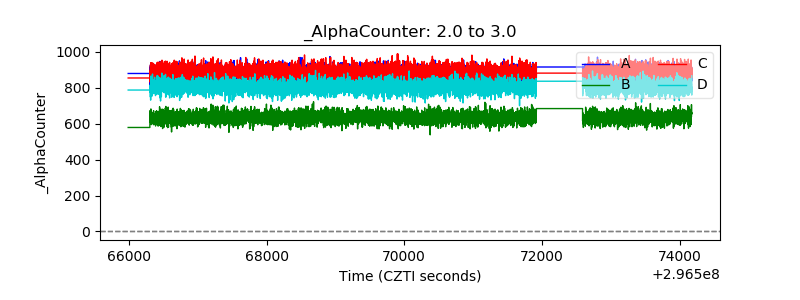 |
| _CPM_Rate | 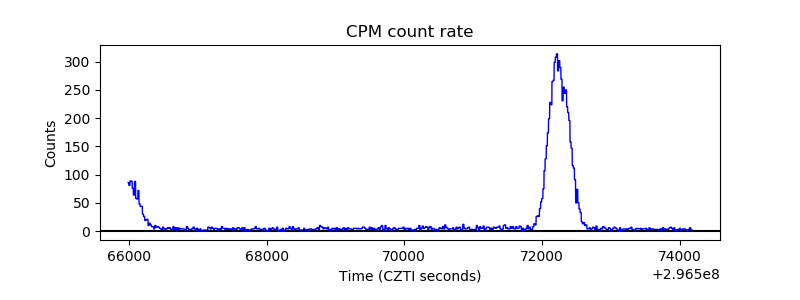 |
| CZT Counter | 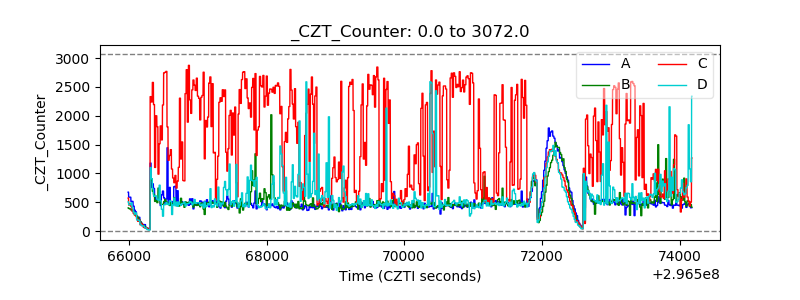 |
| +2.5 Volts monitor |  |
| +5 Volts monitor |  |
| _ROLL_ROT | 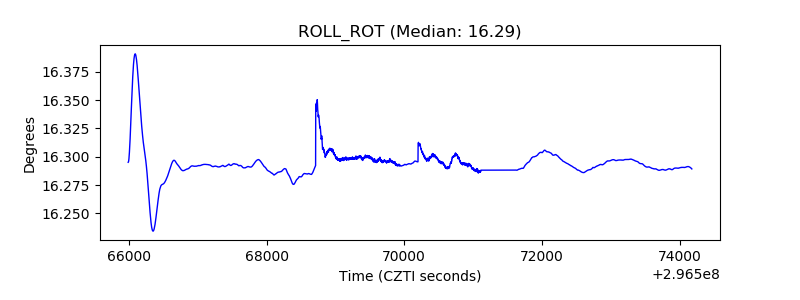 |
| _Roll_DEC | 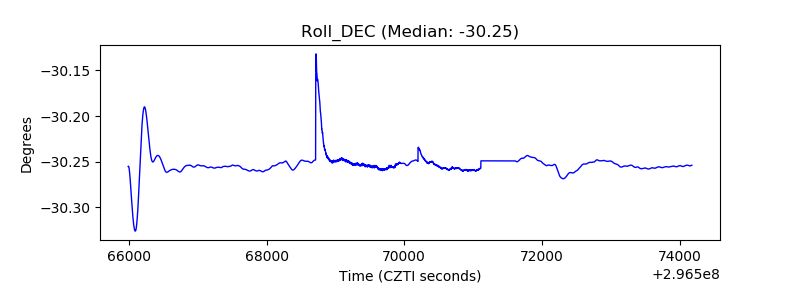 |
| _Roll_RA | 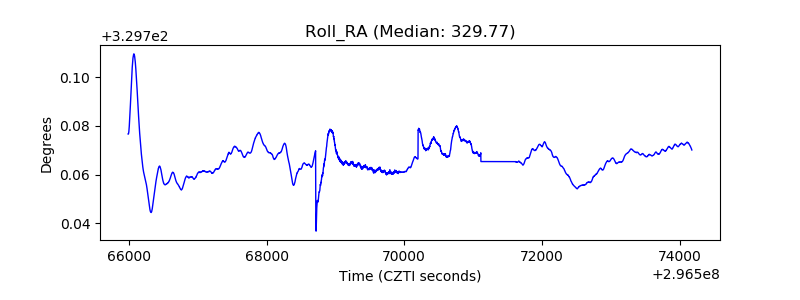 |
| Veto Counter | 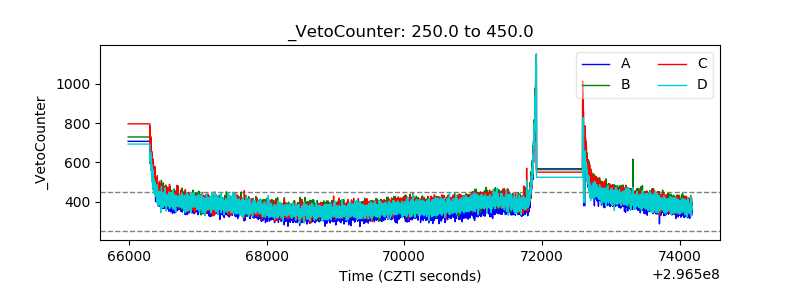 |